
Abstract
How to obtain the “truth” of land surface parameter as reference value to validate the remote sensing retrieved parameter in heterogeneous scene and coarse-resolution pixel is one of the most challenging topics in environmental studies. In this paper, a distributed sensor network system named CPP-WSN was established to capture the spatial and temporal variation of land surface parameters at coarse-resolution satellite pixel scale around the Huailai Remote Sensing Station, which locates in the North China Plain. The system consists of three subnetworks that are RadNet, SoilNet, and VegeNet. Time series observations of typical land surface parameters, including UVR, PAR, SWR, LWR, albedo, and land surface temperature (LST) from RadNet, multilayer soil moisture and soil temperature from SoilNet, and fraction of vegetation cover (FVC), clumping index (CI), and leaf area index (LAI) from VegeNet, have been obtained and shared on the web. Compared with traditional single-point measurement, the “true” reference value of coarse pixel is obtained by averaging or representativeness-weighted averaging the multipoint measurements acquired using the sensor network. The preliminary applications, which validate several remote sensing products with CPP-WSN data, demonstrate that a high quality ground “truth” dataset has been available for remote sensing as well as other applications.
1. Introduction
With the increase of datasets from coarse-resolution remote sensing satellites, researchers have developed many quantitative products of land surface parameters and have been concerned with the need to quantify the accuracy of their application [1, 2]. Thus, several validation plans have been implemented to verify these products at both the local scale and global scale, such as BigFoot, Validation of the Land European Remote Sensing Instruments (VALERI), and Land Product Validation (LPV) [3–5]. These works have evaluated the accuracy of remote sensing products under abundant land covers in long time series but mainly use single-point observation for remote sensing pixel validation. The representativeness of the in situ point observation with regard to the remote sensing pixel scale observation is questionable, especially for products with coarse spatial resolution [6, 7]. The mismatch between point observation and pixel observation, in other words, the scale effect, becomes the main challenge for the validation of remote sensing products in coarse resolution. Advanced observation methods should be employed with consideration of the heterogeneity of coarse pixel.
Wireless sensor network (WSN), which is typically comprised of a collection of sensors with their own power supply, wireless communication, data storage, and data processing capability, collects and transmits data from remote field sites back to base station [10–12]. Networks of embedded devices that work together to provide enhanced monitoring across spatial and temporal scales are growing in popularity [13]. Wireless sensor networks are increasingly applied in research fields including earth observation, environmental monitoring, agriculture, resource management, public health, public security, transportation, and military [14]. With the ability of large-scale coverage and long time series running, WSN has the potential to contribute to the solution of the scale effect challenge in remote sensing research.
Recently, new remote sensing products of energy budget, vegetation characteristics, and soil characteristics have been generated to meet the needs in the climate change, environment monitoring, and agricultural yield estimation. WSN is an effective way for simultaneously monitoring these parameters at ground. With its flexibility, automation, and relatively low cost to synchronously acquire data in multiple sites, the WSN is recently adopted in validation/calibration of remote sensing products [15–17]. For this purpose, it is desirable that each node could contain multiple sensors to measure different kinds of parameters. In this paper, we explore the establishment of the wireless sensor networks which monitor the heterogeneity of coarse spatial resolution pixel, with consideration of different categories of land surface parameters (hereafter referred to as CPP-WSN).
This paper firstly presents the China validation network and Huailai remote sensing station where the CPP-WSN lies. Then, the parameter selection and sensor specifications of CPP-WSN are discussed. Construction of CPP-WSN, including design of CPP-WSN nodes, optimized layout at pixel scale, and automatic data transmission and sharing are described in the third part of this paper. And, finally, the validations of a variety of remote sensing products are introduced as preliminary applications of the CPP-WSN.
2. Huailai Remote Sensing Station
There are many ecohydrology and flux sites around China (Figure 1), and these sites have provided various data for environmental monitoring and remote sensing products validation. With advanced observational techniques, abundant data accumulation, and ability of carrying on multiscale experiment, the Huailai Remote Sensing Station and around (for short HuailaiS), located in Huailai, Hebei province, China (40.349°N, 115.785°E), becomes one of the ideal study areas for remote sensing algorithms/products validation and scale effect research. The HuailaiS is mainly covered by irrigated corn and unirrigated corn. The differences in irrigation condition and soil type distribution make the single land cover area heterogeneous but continuously changing, which characterize the problem of scale transformation from point-measured parameters to pixel scale reference value.

Location and underlying characteristics of research area (revised from [7]).
The sinusoidal grid is one of the most widely used grid schemes for global remote sensing products. For 1 km sinusoidal pixel covering HuailaiS (the green parallelogram shown on the right of Figure 1), a 2 km ∗ 1.5 km layout area for CPP-WSN (the red square shown on the right of Figure 1) is chosen in consideration of the adjacent pixels’ influence.
3. CPP-WSN Observations and Data Collection
3.1. Specifications of CPP-WSN and Sensor Intercomparison
Considering the needs of validating various remote sensing products and the different heterogeneity conditions of different parameters, three categories of parameters are observed, including multiband upward/downward radiation, multilayer soil moisture and temperature, and vegetation structure parameters. Different layouts are required to capture the heterogeneity of each kind of parameters. Therefore, three WSNs were established, namely, RadNet, SoilNet, and VegeNet. The specifications of the three WSNs are shown in Table 1, including WSN name, parameters’ category, observed parameters, and selected sensors. The three vegetation structural parameters, that is, FVC, LAI, and CI, are estimated from the camera-acquired true color image based on the improved Lang and Xiang (LAILX) algorithm [18, 19].
Specifications of WSNs’ parameters and sensors in CPP-WSN.
Sensor intercomparison is commonly performed before the establishment of observation network or experiment, such as the First International Satellite Land Surface Climatology Project Field Experiment (FIFE), the Energy Balance Experiment (EBEX-2000), and the Heihe Watershed Allied Telemetry Experimental Research (HiWATER) [20–22]. To acquire reliable radiation data when multiple sensors observe simultaneously, intercomparison is essential to ensure all of these sensors have consistent performance. Thus, an intercomparison experiment was carried out for RadNet sensors/parameters, including CUV5/UVR, CNR4/SWR, CNR4/LWR, PQS1/PAR, and SI-111/LST. The intercomparison scene and acquired data of CNR4/SWR are shown in Figure 2. All CNR4 sensors lay on the same horizontal plane with identical solar radiation condition (Figure 2(a)), and time series observations from various CNR4s were collected for comparison (Figure 2(b)). The comparisons of other sensors/parameters were conducted using the same method.
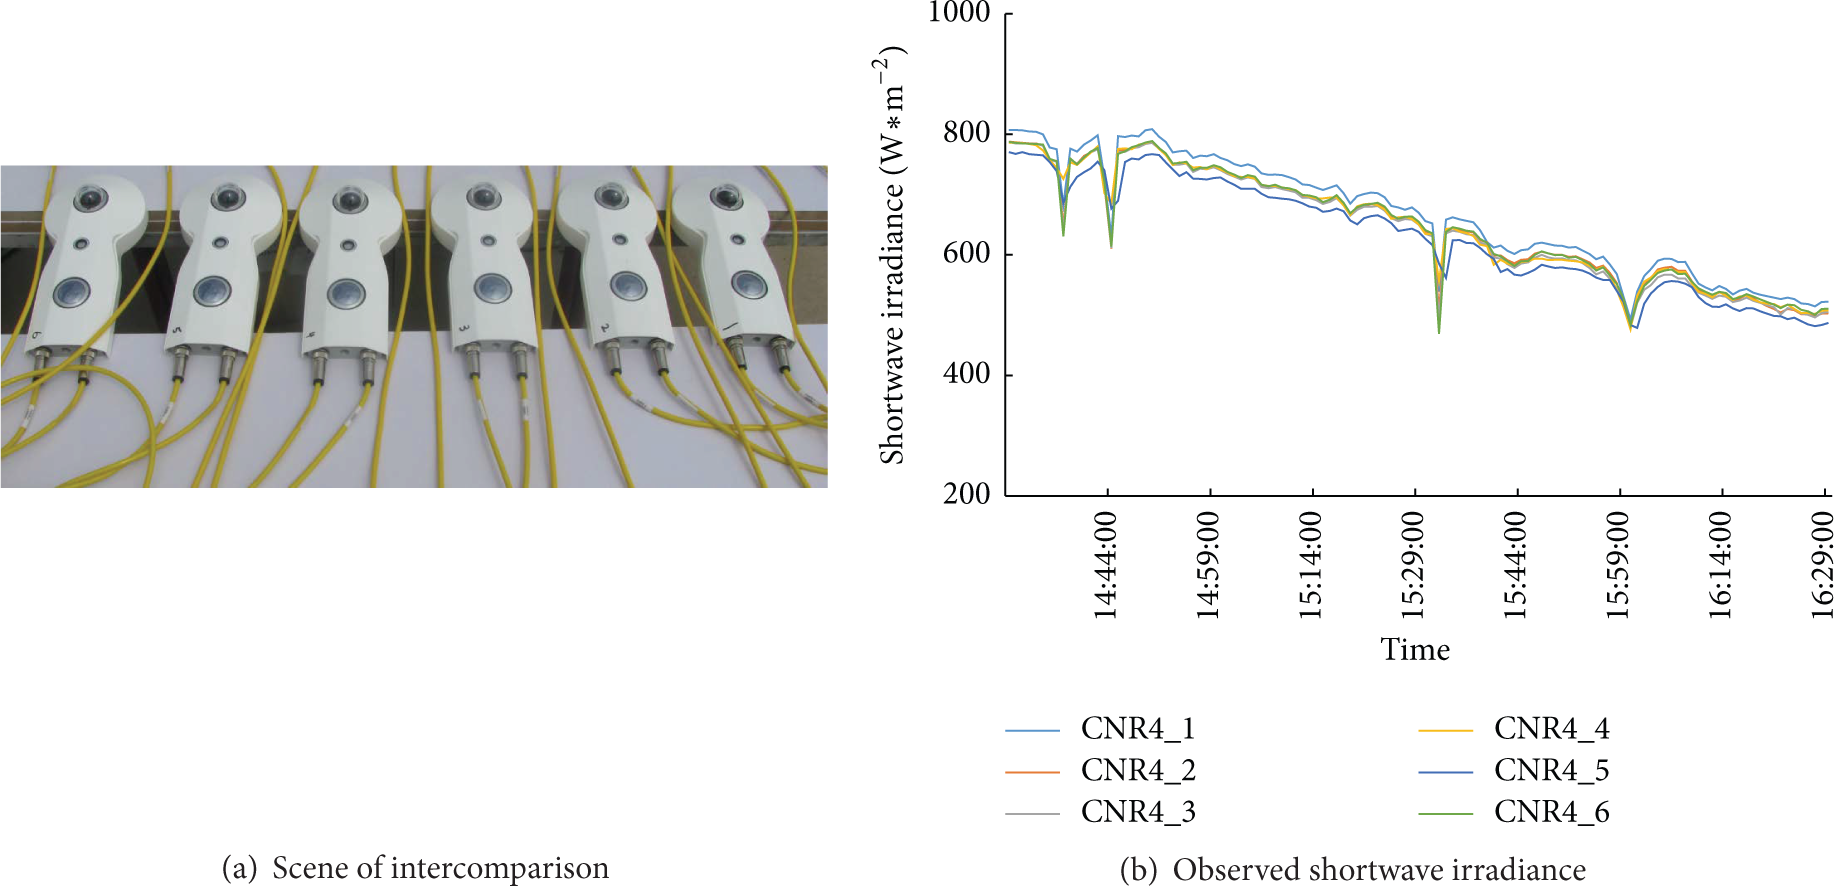
Intercomparison scene (a) and measured data (b) of CNR4/SWR.
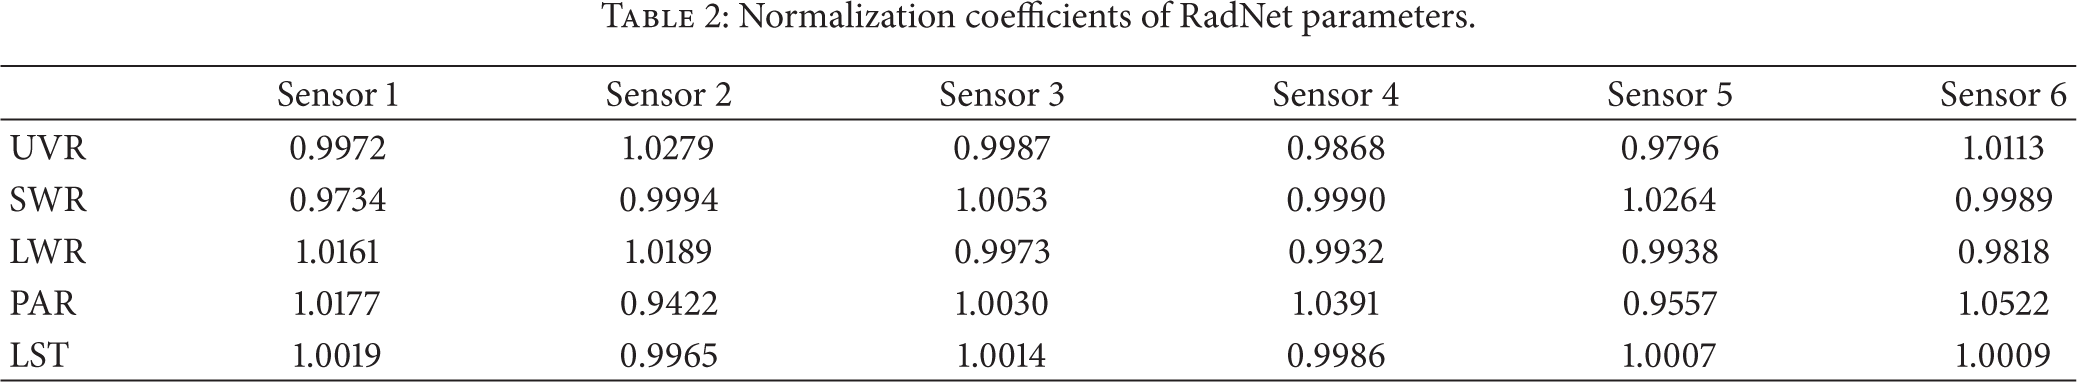
The measured parameters were collected and temporally averaged for each individual sensor. The maximum relative differences among sensors of UVR, SWR, LWR, PAR, and LST are 4.83%, 5.3%, 3.71%, 11%, and 0.54%, respectively. Sensor/parameter differences indeed exist and are considerably large for PAR, SWR, UVR, and LWR, which cannot be ignored. Thus, it is necessary to analyze and correct the discrepancies among the sensors. The normalization coefficient, defined as the mean ratio of each sensor observed value to the average value of all sensor observations, is adopted to adjust the sensor observation (1). Consider
Table 2 lists the normalization coefficients of employed sensor parameters. The corrected observation value equals the original observation value multiplied by the normalization coefficient.
Normalization coefficients of RadNet parameters.

3.2. CPP-WSN Construction
Figure 3 shows the CPP-WSN system for coarse scale pixel observation and near real-time data sharing consists of the following components: WSN nodes, data receiving/processing server, data sharing server, and data sharing website. The observations of WSN nodes are collected by data receiving/processing server via a 3G network that is General Packet Radio Service (GPRS) and then processed in near real-time. After quality control and standardization, data together with the metadata is imported into the data sharing database. Finally, the near real-time CPP-WSN dataset is shared with self-explanatory metadata on the data sharing website.

Archetype of CPP-WSN.
According to the needs of validating remote sensing products in coarse spatial resolution, three scientific objectives are proposed and accomplished to establish the CPP-WSN.
3.2.1. Design of CPP-WSN Nodes
As the variation in vegetation density is the main driving factor for the variation of radiation parameters in the study area, the nodes of RadNet and VegeNet are bonded together, while SoilNet node was designed separately, and both RadNet/VegeNet node and SoilNet node consist of bracket, sensors, data collector, solar panel, and battery, just as Figure 4 shows. The minimum height of bracket and solar panel should be higher than the height of canopy for solar energy supply. Thus, the bracket height of SoilNet node is set to 2.5 m because the maximum canopy height of observed area is about 2 m, while the bracket height of RadNet/VegeNet node with above canopy bracket height of wide field of view radiometer is set to 4 m to supply a large enough field of view for effective parameters observation.

Scene of RadNet/VegeNet node (a) and SoilNet node (b).
The observing period depends on the variation frequency of parameter; for example, the instantaneous LST measurement for synchronously validating the remote sensing retrieved LST changes rapidly. However, the power supply of solar panel is limited. Therefore, there is a compromise strategy between the observing period and power supply limitation. The observing period of RadNet and SoilNet is set to 5 minutes, which is a typical frequency of global flux observation station, to ensure a sustainable continuous observation in day and night. The VegeNet camera sensor works twice a day at 12 o'clock and 17 o'clock, respectively. After sampling, the observed voltages are preliminarily processed to parameters.
3.2.2. Optimized Layout to Capture the Land Surface Heterogeneity
Different categories of parameters show different heterogeneity within coarse pixel. According to the influence of underground water, soil texture, irrigation condition, and vegetation, the soil moisture and temperature have the highest spatial variation. Therefore, dense grid layout should be selected for SoilNet nodes, especially considering the lack of a priori information of soil moisture and temperature distribution in the study area. The radiation (including albedo) and vegetation parameters are mainly determined by the planting structure and vegetation growth, and it is preferred that they share the same layout for relevance and mutually supportive study. In contrast to soil parameters, the radiation and vegetation parameters have lower spatial variation and abundant a priori information retrieved from remote sensing image. So, the heterogeneity of RadNet/VegeNet could be captured using fewer nodes. As the radiation sensors (CUV5, CNR4, PQS1, and SI-111) are expensive and fragile, it is also a practical need to reduce the number of RadNet nodes so long as the radiation parameters at the coarse-resolution pixel scale can be satisfactorily represented by the nodes. In this consideration, the representativeness-based sampling method [23] is adopted to determine the node number and location of the RadNet/VegeNet in CPP-WSN. The method selects the point of highest representativeness as the location for WSN node and multiple nodes are selected one by one to increase the cumulative representativeness for 1 km pixel. Figure 5 reveals the cumulative representativeness for 1 km pixel increases with node number and approaches a steady state after the sixth point. Therefore, the coarse-resolution pixel could be well-represented by six nodes with cumulative representativeness high to 99.1%.

Cumulative representativeness for the 1 km pixel with different node number.
As shown in Figure 6, 6-node RadNet/VegeNet and 21-node SoilNet were set up, respectively. The red points show the layout of RadNet/VegeNet, and the green points show the layout of SoilNet. The 1 km pixel “true” value of radiation parameters could be obtained by the weighted average of the measurements at the 6 nodes, and the weights are calculated according to the representativeness as well as covariance of the nodes. The SoilNet consists of both the gridded nodes and the nodes attached with RadNet. The 1 km pixel “true” value of soil parameters could be yielded by the simple average or the geostatistic interpolation of the measurements at all nodes.

Sampling layout of the RadNet/VegeNet and SoilNet.
3.2.3. Automatic Data Transmission and Sharing
Near real-time data transmission is not only important for data user, but also essential for WSN maintenance to monitor the node status and track bugs. GPRS is best-effort service, implying variable throughput and latency that depend on the number of other users sharing the service concurrently, as opposed to circuit switching, where a certain quality of service (QoS) is guaranteed during the connection [24]. It is one of the general ways for real-time and stable wireless data transmission. Since the data amount of CPP-WSN is large compared with general wireless sensor networks, a 3G network via GPRS is adopted.
For energy saving, the WSN nodes send observation data once per hour, and the data are listened and received by remote data server. After the data are received, a time series continuity check is performed and a gap-filling method is taken to make time-continuous data by identifying and filling the missing or invalid data. A further quality control process is conducted to check if the data is effective and mark the data with a quality flag. The data of RadNet and SoilNet are packaged, and their self-description metadata are produced every month. The data of VegeNet is true color photo of the canopy; it is further processed to separate green leaf from background and then used to estimate the FVC, LAI, and CI. A dataset is composed of both the data and metadata and shared via an open access website (http://rsesd.slrss.cn/WSNProj/business/product/datalist.jsp).
4. Preliminary Applications of CPP-WSN Data
The main objective of CPP-WSN is to provide ground “truth” at the coarse pixel scale over heterogeneous land surface to assess the accuracy of remote sensing products or algorithms. The RadNet data has been available since May 2013, and the SoilNet has been available since December 2012. Many researchers have used the data for various validation activities.
4.1. Remote Sensing Albedo Products Validation
Land surface albedo observed by RadNet was upscaled to satellite pixel scale using weighted average according to the representativeness-based sampling method and then validated three albedo products, that is, MCD43B3, GLASS albedo, and NPP VIIRS albedo products in 2014. Figure 7(a) shows the scatterplot of the validation of 16-day 1 km pixel scale in situ observation and mean MCD43B3 albedo which is with 1 km spatial resolution and 16-day temporal composition window. The WSN measurement is also upscaled to 1 km pixel and averaged on the 16 days corresponding to MCD43B3 product. Figure 7(b) shows the scatterplot of the validation of VIIRS albedo which is in 750 m spatial resolution and 1-day temporal resolution. Only the inversion results on clear sky conditions are selected. The in situ WSN measurements are processed to the identical spatial and temporal resolution. Figure 7(c) shows the scatterplot between 1 km pixel scale in situ observation and GLASS daily albedo in clear sky conditions. All the three albedo products show similar and acceptable accuracy, and the RMSEs are 0.023, 0.021, and 0.021, respectively, for MCD43B3, VIIRS, and GLASS. VIIRS albedo on “strict clear days” shows less RMSE of 0.014 than that of the “clear days” of this site [25].

Validation of three land surface albedo products.
4.2. Remote Sensing PAR Algorithm Validation
Observed PAR data from RadNet was compared with the instantaneous PAR estimated from the geostationary and polar-orbiting satellite data in spatial resolution of 5 km. Figure 8(a) shows the scatterplot between derived instantaneous PAR and measured instantaneous PAR under different climate conditions; Figure 8(b) shows the scatterplot between the measured instantaneous PAR and the retrieved instantaneous PAR according to measured AOD in clear sky conditions. The accuracy of retrieved PAR in clear sky is higher than retrieved PAR in cloudy sky. With the assistance of measured AOD in clear sky, the retrieved instantaneous PAR gets even higher accuracy, and the RMSE decreases to 25.13 W/m2 [8].

Validation of PAR algorithm [8].
4.3. Remote Sensing LST Products Validation
The multipoint measurements of ground LST were averaged as the pixel scale value to validate different LST products, including NPP VIIRS LST, Terra MODIS LST, and Aqua MODIS LST. Figure 9(a) shows the scatterplot between ground LST and NPP VIIRS LST; Figure 9(b) shows the scatterplot between ground LST and Terra MODIS LST; Figure 9(c) shows the scatterplot between ground LST and Aqua MODIS LST. The daytime and nighttime LST were verified separately. The NPP VIIRS LST shows higher accuracy than the Terra MODIS LST and Aqua MODIS LST of this site.

Validation of three land surface temperature products.
4.4. Leaf Area Index (LAI) Products Validation
VegeNet at Huailai Station was used to validate three MODIS C5 LAI products, including MOD15A2, MYD15A2, and MCD15A2. Figure 10 shows the time series comparison between the pixel scale LAI reference values derived from WSN measurement and the corresponding LAI of the three MODIS products. The accuracy of MOD15A2 and MCD15A2 is higher than MYD15A2 of this site. The mean RMSE of MODIS LAI is 0.33, and the relative uncertainty is 12.2% [9].
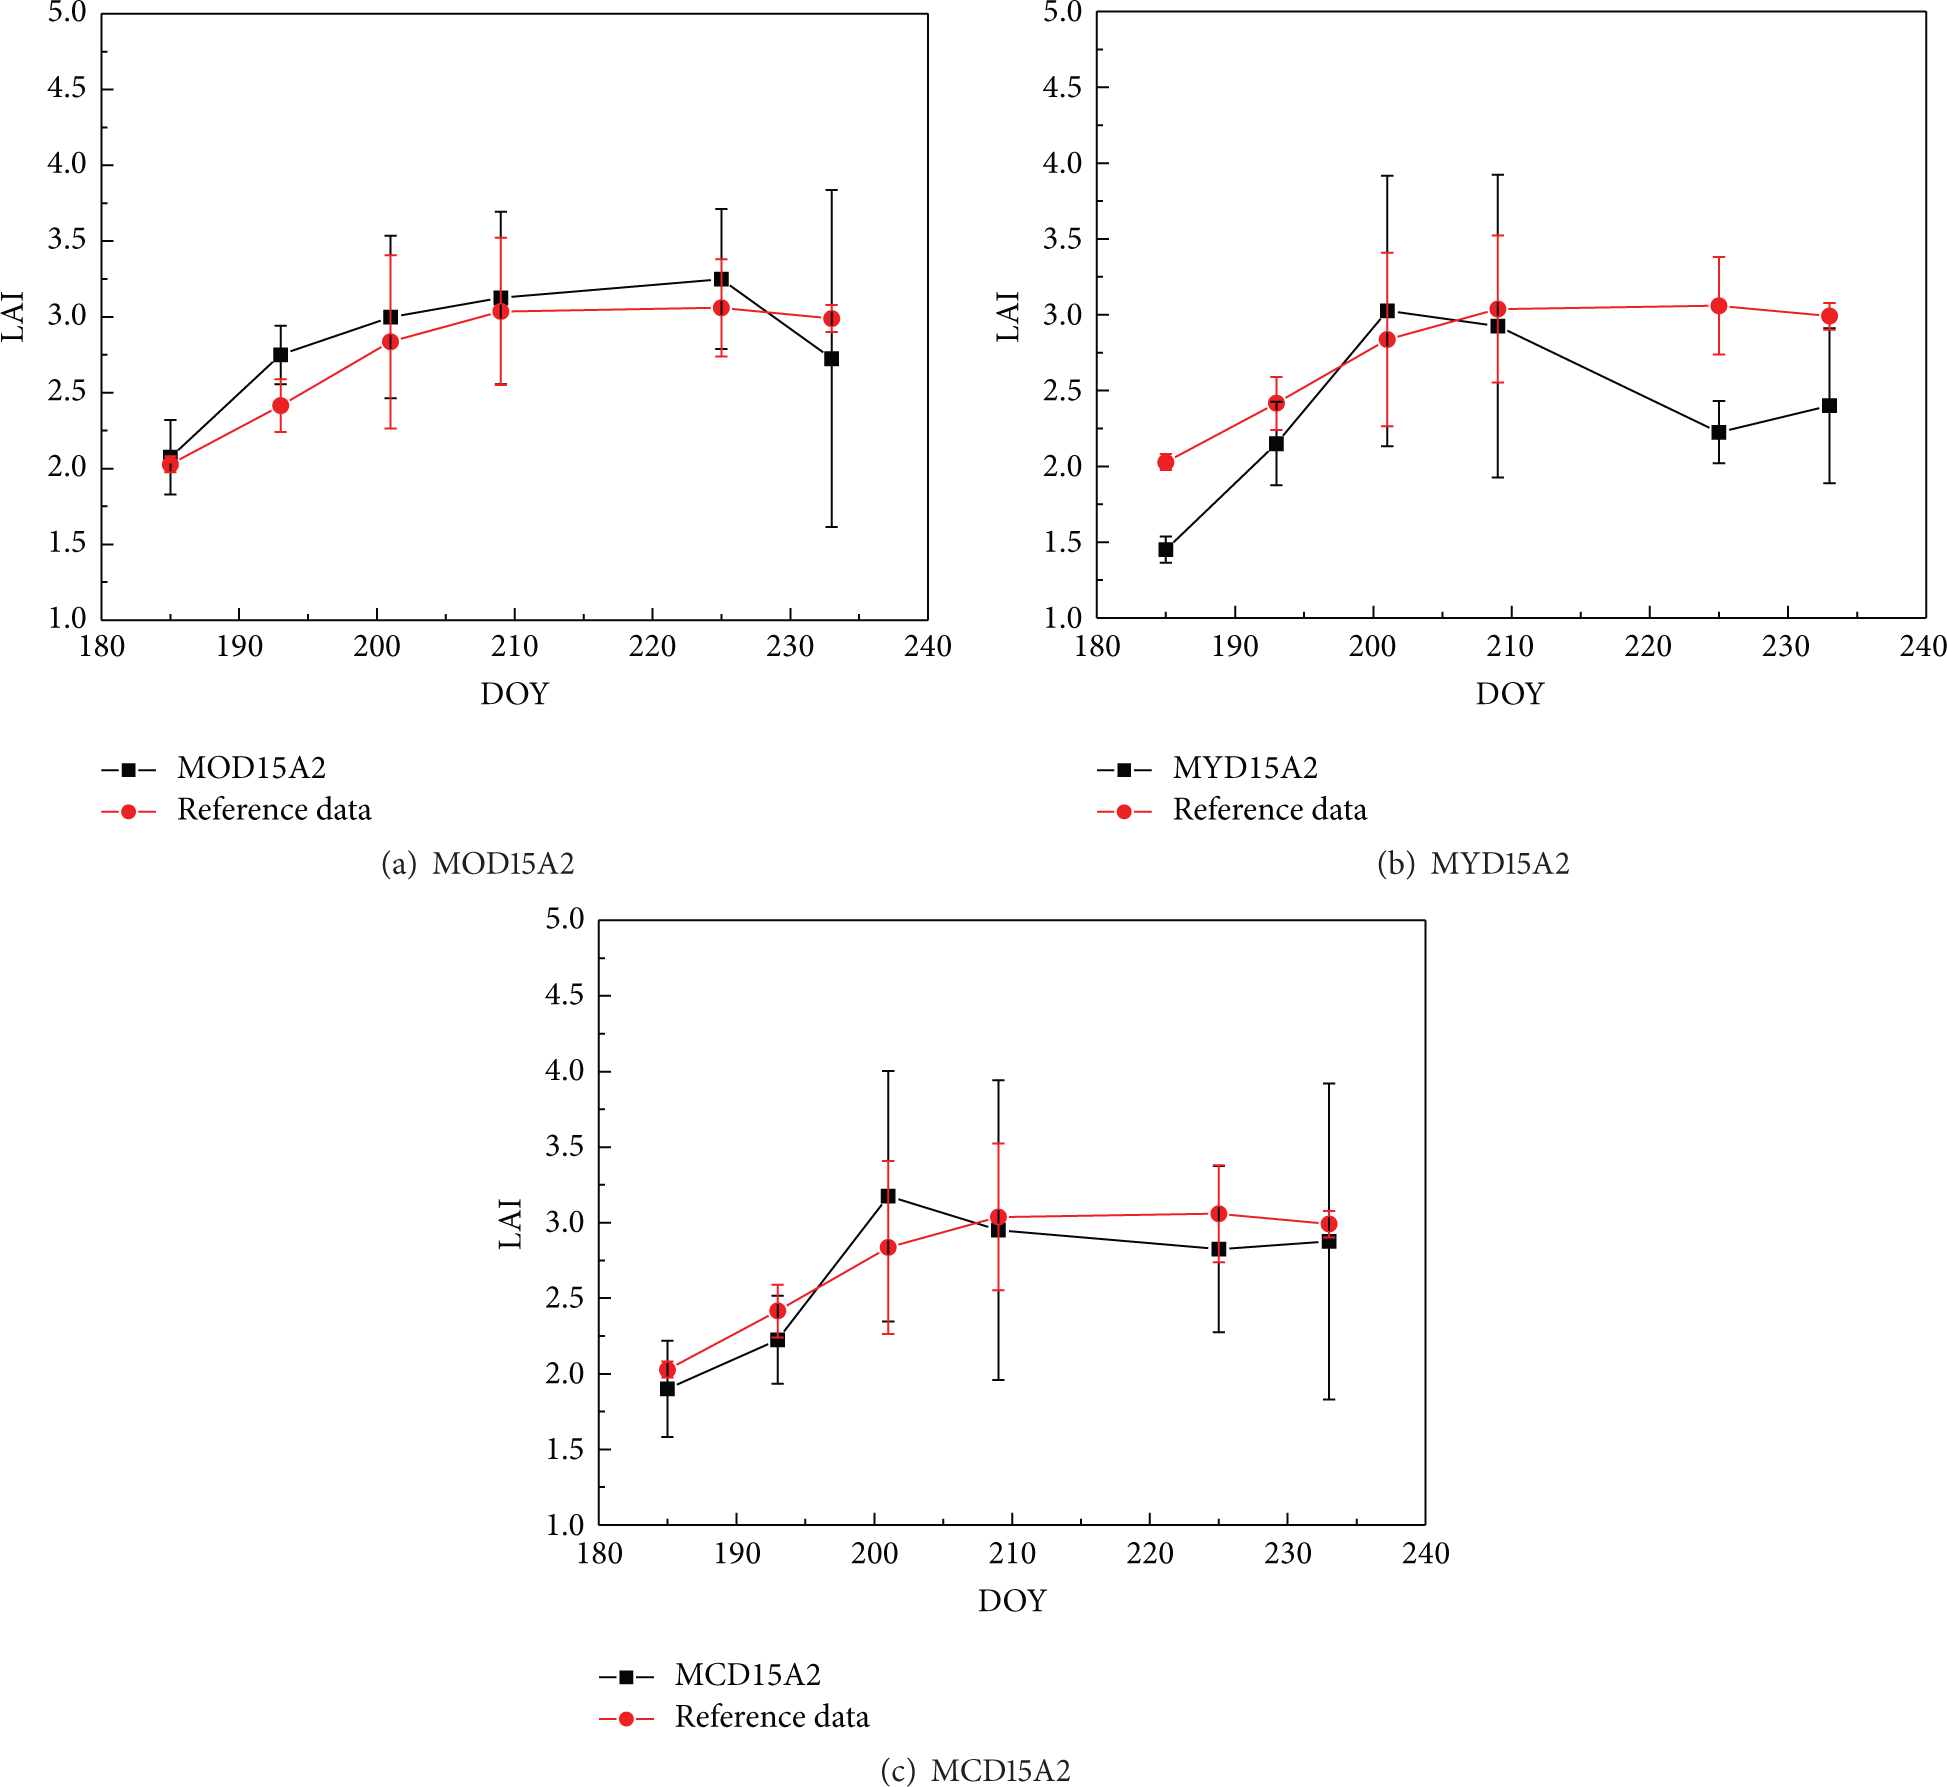
Validation of three MODIS LAI products [9].
5. Conclusions
The CPP-WSN with consideration of the heterogeneity of different parameters was established for the research of parameters’ scale effect and the validation of remote sensing products. And it achieves the near real-time data transmission and standard data sharing for three categories of parameters. Time series observations of land surface typical parameters, including UVR, PAR, SWR, LWR, albedo, NR, and LST from RadNet, multilayer soil moisture and soil temperature from SoilNet, and FVC, LAI, and CI from VegeNet, have been obtained and shared online. The WSN measurements with multiple nodes can capture the spatial variation of parameters in heterogeneous low-resolution pixel. Based on optimized layout and precalculated weights, the parameters measured with WSN can be upscaled to the scale of low-resolution pixels. So, it provides a more accurate reference value for validating the remote sensing products than the traditional single-point value.
The dataset has been shared and many researchers have started to use it to assess a variety of remote sensing products. The preliminary results show good consistency between remote sensing products and the reference values acquired with CPP-WSN, indicating that the system is running smoothly and fulfills its scientific goal. However, more sites and longer time series of good quality observations are needed for comprehensive validation of remote sensing products and strict calibration for the WSN sensors and improvement to the upscaling scheme are also needed to support the high quality of the reference values in coarse pixel scale. These show our further research direction.
Footnotes
Competing Interests
The authors declare that there is no conflict of interests regarding the publication of this paper.
Acknowledgments
This research was jointly supported by National Basic Research Program of China (2013CB733401), Chinese Natural Science Foundation Project (41271368), and National High Technology Research and Development Program of China (2013AA12A301). Additionally, the authors would like to thank all of the scientists, engineers, and students who participated in the maintenance of CPP-WSN, especially Dr. Bai Junhua at the Institute of Remote Sensing and Digital Earth of the Chinese Academy of Sciences.