
Abstract
This paper presents characteristics of the Frame Error Rate versus Signal to Noise Ratio obtained from Smart Lighting LV network. These characteristics are the results of carrying out many field-trials in three locations. During the one-year tests period lighting systems evolved from the traditional, gas-discharge not individually dimmable system to LED or gas-discharge Smart Lighting system controlled with the use of PLC technology every lamp individually. A different influence of the frame length on the
1. Introduction
Smart Lighting low voltage (LV) network is a power network between a MV/LV transformer and loads in which all the loads are dimmable lamps. The only exceptions to this rule are traffic concentrators which, unlike the lamps, do not practically affect the impedance of the LV network. Smart Lighting systems may be supplied from general purpose LV networks or from Smart Lighting LV networks. Supplying the lighting systems from general purpose LV network is getting rarer and concerns mainly rural areas and suburbs. Smart Lighting systems allow controlling every lamp individually, where basic control functions are brightening and dimming as well as turning-on and turning-off. To control every lamp individually (not the entire street as it was with older systems) a last mile communication network must be employed. This part of the Smart Grid communication networks has a decisive impact on the cost of implementation and operation of the whole communications system. Thus very cheap short-range devices (SRDs) have been used to deploy last mile wireless or PLC (Power Line Communications) networks. Both the Smart Metering and the Smart Lighting, last mile communication systems based on PLC or RF technology, create a specific kind of the distributed sensor networks. Smart Metering solutions based on RF technology are very similar to Wireless Sensor Networks (WSNs) [1] in both their topology and hardware solutions.
One of the differences between Smart Metering and Smart Lighting last mile networks is their topologies. Smart Metering networks in most cases create a mesh topology whilst Smart Lighting networks a link topology. Using the PLC technique in three-phase network, as in most cases, there are two variants of the topology of the Smart Metering communication network, namely,
three links with shared modem topology, topology with three independent links.
In Figure 1 two examples of variants are presented.

Two variants of the topology of the Smart Metering PLC network: (a) three links with shared modem, (b) three independent links.
Using the three links with shared modem variant the traffic concentrator works in the hub mode, whilst using three independent links' variant it works in the router mode. Thus, sending information to any lamp supplied from
Using Figure 1(a), it is easy to imagine the difference between the last mile Smart Metering realized in RF and PLC technology. In the case of RF, connections between lamps are independent from power lines but they depend mainly on physical distances between nodes (lamps).
The differences between Smart Metering and Smart Lighting in topology and services are the main reasons, which cause a need to create new communication protocols dedicated just to last mile Smart Lighting communication networks. The development of communication protocols has always been dictated by the necessity to implement new services or by new possibilities given by better technology. A good example can be Frame Relay technology, which replaced X.25, when new, better (more reliable) links have been applied in telecommunications. These two main reasons resulted in the existence of so many “made to measure” communication protocols. With Smart Lighting the situation is similar; it needs to have its own dedicated communication protocol or set of protocols, which meet all the specific requirements. The specific requirements for Smart Lighting are inter alia
fast autoconfiguration of the network, the ability to work across all CENELEC bands, in space and time multichannel working, real-time services supporting, data transfer asymmetry (more data is downloaded).
All these requirements are difficult or impossible to meet by interfaces designed for Smart Metering, for example, PRIME or G3 [2–5].
To develop a new communication protocol, knowledge of the behavior of lower layers is very useful, because it allows optimizing the parameters of the protocol. The physical layer is the lowest layer. The behavior of the PLC physical links is generally described by the primary and secondary parameters of the power line [6, 7] as well as by noise models [8]. The possibilities of the physical data transmission interfaces are described by FER (Frame Error Rate) versus SNR (Signal to Noise Ratio) or PER (Packet Error Rate) versus SNR.
Author of the paper as the person responsible for ensuring the last mile communication in the Smart Metering System carried out series of tests. The Smart Metering system is currently developed by University of Science and Technology in Bydgoszcz (UTP), Poland, and Orion Electric Poland under the GEKON Project supported by the National Centre for Research and Development and also by the National Fund for Environmental Protection and Water Management. In this paper
2. Test-Beds, Measurement Conditions, and Method of Data Collection and Presentation
Analyzed data were obtained as a result of many field-trials carried out in three locations: Kamienna Street in Bydgoszcz City, Nieszawska Street in Torun City, and UTP Campus. In addition to these locations, observations were also done on separate Smart Lighting LV network test-beds prepared for studies related to the GEKON project.
The longest power line section of Kamienna Street LV network is 1.5 km long, with the traffic concentrator located at 500 m from one of the ends of the section. This section contains 100 lamps (terminal nodes) installed on 50 poles. The old gas-discharge light sources are used on this street. This network was used for testing the PLC transmission, that is, modulation types, methods of data correction, and of course transmission coverage.
One-section Nieszawska Street LV network has a length of 3 km with two traffic concentrators located in the middle. The LV network on Nieszawska Street contains 108 lamps; there is one lamp on every electric pole. The old gas-discharge light sources have been used during the three-month period of testing. They have been subsequently changed to LED. This network was used for functional testing, including traffic concentrators protection on/off switching.
UTP Campus LV network is not separated, dedicated to street lighting supplying only; it also supplies offices, classrooms, and labs. Both gas-discharge and LED light sources were used during the tests. This network consisted of 36 lamps.
Tests carried out on the lab test-beds were done with the different types and numbers of lamps. These tests were done for the results verification and also when we wanted to have condition impossible to obtain in the field, for example, transmission over the overhead power lines.
All data for the analysis were collected in traffic concentrators. Analyzed data were erroneous or error-free frames received by the traffic concentrator with the different values of SNR. When 3-phase LV network was under test, the traffic concentrator presented in Figure 1(a) was employed, whilst testing 1-phase LV network we employed traffic concentrator presented in Figure 1(b), using only one port. The SNR range of the frame reception was from 0 dB to 34 dB. Both traffic concentrators and lamps were equipped with our own construction modems based on STMicroelectronics ST7580 chip. To ensure the long range transmission the multihop [9] communication protocol has been designed and to ensure adequate data transfer reliability the multipath technique [10] was also implemented. An exemplary data flowchart for one traffic concentrator-lamp action is presented in Figure 2. In this diagram, the differences in time of the same frame reception by lamps are not shown, because the differences of the propagation times are negligible compared to the time of the frame transmission.
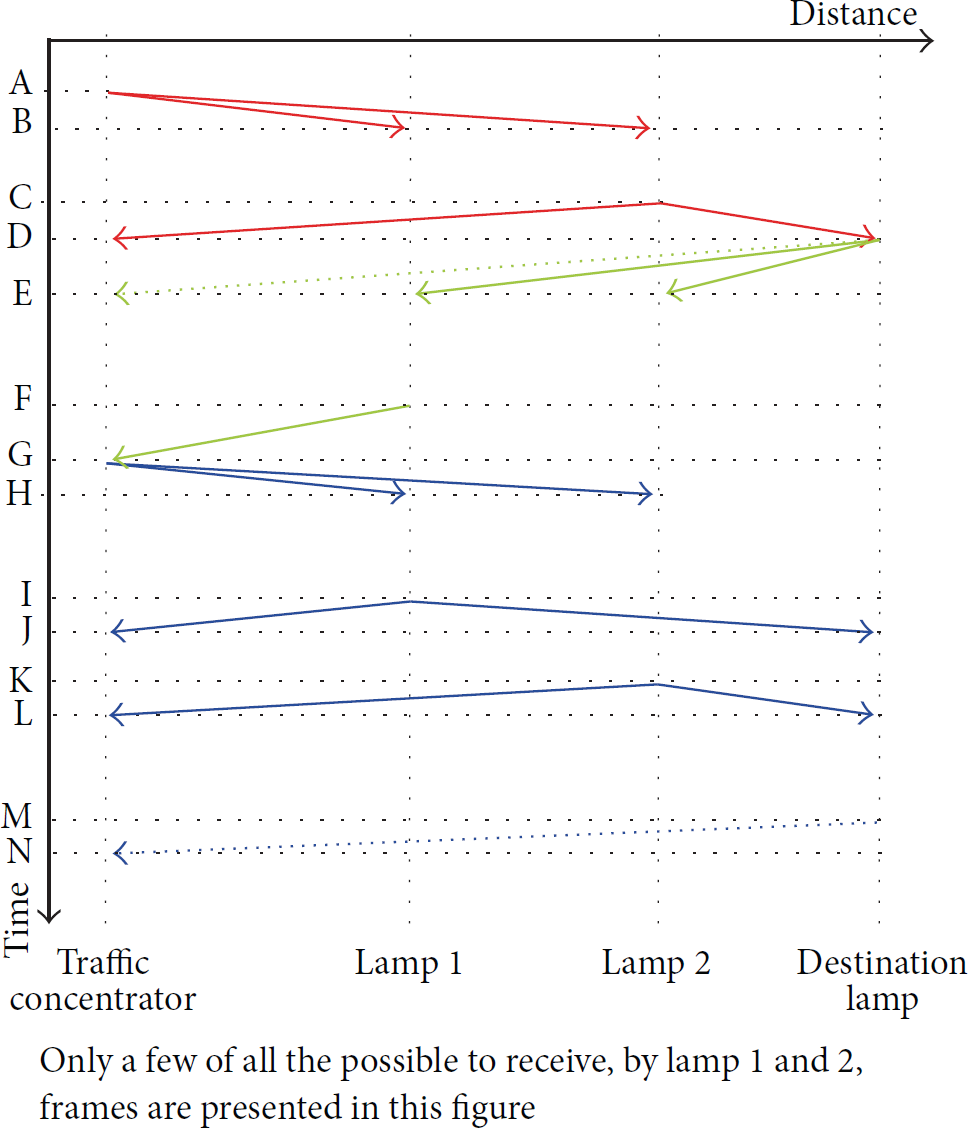
An exemplary data flowchart, which explains multihop technique in the shared communication medium and the method of data collection in the traffic concentrator.
The whole action presented in Figure 2 lasted from timestamp A to timestamp N. In this example, lamp 1 and lamp 2, which are within range of the traffic concentrator, have to act as relay because the destination lamp is out of range of the traffic concentrator. Three types of frames were received by the traffic concentrator: commands (presented in red), responses (presented in green), and ACK/Cancel (presented in blue). The ACK/Cancel frames are always relayed by all the lamps that act as relay. Every relaying process starts after 60 ms plus random time (from 0 to 500 ms) for each lamp independently. The relay timer can be stopped if the command frame is expected to be relayed and the response frame was receipted or if the response frame is expected to be relayed and the ACK/Cancel was receipted. Such a situation happened at the time of E, which did not allow lamp 1 to send a copy of the command frame. The command frame was received by the traffic concentrator at the time of D; actually it was a copy of the command originally sent by traffic concentrator at the time of A and copied by lamp 2 at the time of C. Assuming the same bit rates for all the exchanged frames, the time duration of the command frame is B-A = D-C. At the time of C the destination lamp did not receive the command frame because it was out of the traffic concentrator transmission range; this happened only at the moment of D, thanks to multihop technique. After a negligibly short time at the time of D the destination lamp sent the response frame, which was received again by intermediate in the transmission nodes, that is, lamp 1 and lamp 2. This frame was also received by the traffic concentrator but with errors detected thanks to FCS (Frame Check Sequence) implementation. The correct response frame reception took place at time G, after sending it by lamp 1 at the moment of F (this time lamp 1 has overtaken lamp 2 in the frame relaying process; random time delay in lamp 1 was shorter than in lamp 2). At the end of the information exchanging process, the traffic concentrators sent ACK/Cancel frame, immediately after error-free response frame reception. Three copies of ACK/Cancel were received: one erroneous (from the destination lamp) and two error-free from lamp 1 and lamp 2.
In the above example, 6 frames have been received by the traffic concentrator. This example was very simple, just to explain multihop and multipath techniques and also to explain how data are collected by the traffic concentrator. Field-trials showed that even more than 10 frames may be received after sending one command by the traffic concentrator. During the one information exchanging action, frames received by traffic concentrator may usually have three lengths. Sometimes they may have two lengths or the same lengths, but this is rather an untypical situation. These situations can happen when command and response frames have the same length or when command and response frames do not carry any packet payload; in this case all the received frames have the shortest possible lengths. The shortest frames in presented solution have the length of 23 bytes and consist of
four-byte preamble, two-byte unique word, one-byte transmission mode indicator, one-byte length indicator, fourteen-byte frame payload (packet), one-byte FCS.
For the frames longer than 23 bytes the structure is the same except the fact that frame payload is longer than 14 bytes because it contains also the packet payload. The ACK/Cancel frames are always the shortest ones. The typical length of the response frames is 24 bytes but the length of these kinds of frames can also be a quite long, for example, when registers of the lamp are readout in burst mode. There is no typical length of the command frames; they may have length from 23 bytes up to 250 bytes.
When all the lamps are in the direct communication range of the traffic concentrator, no command frame can be received by it. This situation is presented in Figure 3, which shows the oscillogram with 5 different frame signals recorded from 1-phase LV power line during the one querying process. The oscillogram was taken off close to the traffic concentrator.
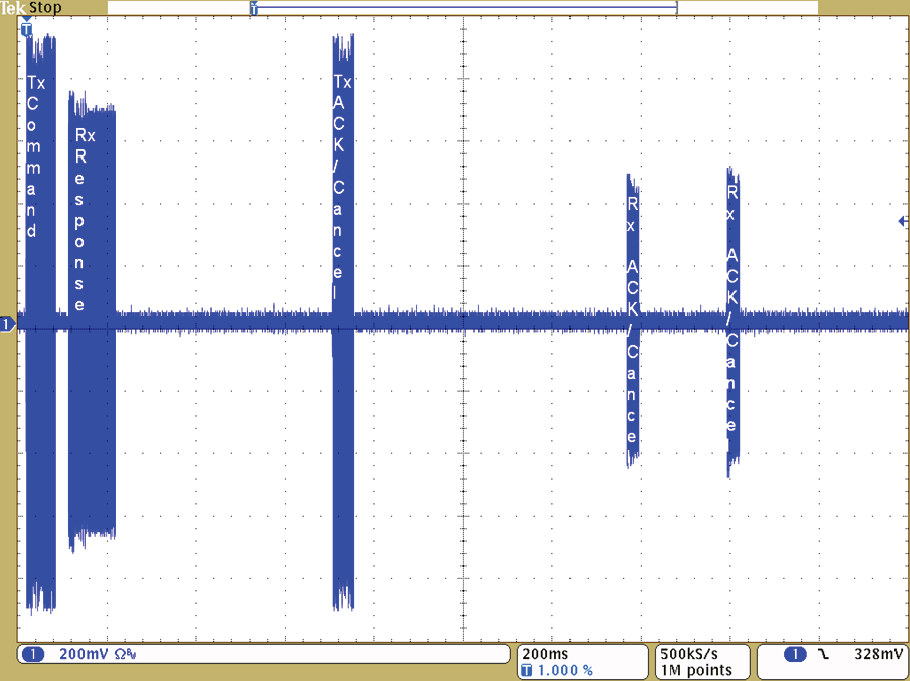
Data exchanging process recorded on the oscilloscope; captions on “frames” describe the direction of the transmission from the traffic concentrator position.
The waveform in Figure 3 contains five frames; two of them were transmitted by concentrator and three were received by it. The first frame (from the left) is the 33-byte command frame sent by traffic concentrator using BPSK (Binary Phase-Shift Keying) coded modulation. The second frame is the 55-byte response frame sent by the queried lamp also using BPSK coded modulation. It is easy to notice that the level of the signal of the response frame is lower than the level of the signal of the command frame. The third frame is the 23-byte ACK/Cancel sent by traffic concentrator with the same signal level and the same kind of modulation that command frame was sent. The fourth and fifth frames are also the 23-byte ACK/Cancel frames copied and sent by two far lamps (not queried at the moment); their signals are weaker because they are far from the concentrator; also their duration is shorter because they were sent using QPSK (Quadrature PSK) modulation, which allows transmitting data twice faster than BPSK modulation. Above example shows us differences in the shapes of the frames as a result of the transmission in the noisy environment, attenuation, and the length of the frame.
Every received line frame is extended by PLC modem with the information about its level and SNR and sent to the microcontroller. After a frame reception, the traffic concentrator updates its two-dimensional array. Every element of this array has two records: erroneous frames counter and error-free frames counter. One frame reception causes updating only the one counter of only one element of the array. This element is indexed by the SNR value and the length value. The SNR values are natural numbers or zero. For the given SNR and length, the FER value is calculated by dividing the value of the erroneous frames counter and the sum of the value of the erroneous frames counter and the value of the error-free frame counter. This is formalized by

The FER value does not only depend on SNR and the length of the frame. It also depends on frame modulation and also if PLC modem was configured to work in single or dual channel mode. Using the fact that presented Smart Lighting communication system was designed to work in single channel mode only results in this condition are presented. All the types of PSK frame modulation, supported by ST 7580, were tested but to understand the errors nature of the narrowband PLC transmission in Smart Lighting LV network only not coded kinds of modulation are considered in this paper; this modulation is BPSK, QPSK, and 8PSK (8-phase PSK) with their bit rates 9600 bits/s, 19200 bits/s, and 28800 bits/s, respectively. In Figure 4, as an example, two charts are showed; they presented the same data but in different form: chart (a) has logarithmic axis of ordinates, which is more commonly used, whilst chart (b) has linear, which will be used in this paper only when it is necessary.

FER versus SNR for 38-byte frames with BPSK and QPSK modulation: (a) the axis of ordinates is logarithmic; (b) the axis of ordinates is linear.
Regardless of which type of charts in Figure 4 is analyzed, it is clearly seen, from the curves, a well-known principle that BPSK modulation is more reliable but the cost of its robustness is the low bit rate; it is twice lower than the bit rate offered by QPSK. The reason for using two types of modulation is to increase reliability in this communication system, which is based SRDs. The most sensitive moment of exchanging data, using multihop technique, is the moment of the original packet sending, rather than sending a copy of it. The original packet can only be sent by one node while its copy can be sent usually by many intermediate nodes. Sending copies of the same packet by a few intermediate nodes significantly improves the reliability of transmission and also allows using faster though less reliable kind of modulation.
3. Differences in FER(SNR) Characteristics of LED and Gas-Discharge Lamps
Many tests were done to answer two questions, namely: which kind of modulation is optimal and what is the maximum length of the frame for the narrowband PLC transmission over the Smart Lighting LV network?
For the short frames, practically, there was no difference whether analyzed data were collected from the Smart Lighting LV network supplied LED or gas-discharge lamps. Of course there was also no difference in
As metrics of the difference between two curves an averaged difference of FERs has been used; it may be calculated from

The constant 256 is used in formula because there are theoretically 256 possible values of SNR, when ST7580 is applied. In practice, all values of SNR were always in range from 0 to 34; higher values than 34 never occurred. Nevertheless, formula (1) gives indefinite value when both counters of the same element are zero. This situation takes place when the element is indexed by SNR that has never occurred during the observation period. In such a case it is assumed that
As an example the absolute value of
The averaged difference of FERs, that is,
The first difference between LED and gas-discharge Smart Lighting LV networks in
The above relationship was found for all the tests carried out. As an example in Figure 5 the set of four

FER versus SNR performance test results obtained from Nieszawska Street on 24 April 2015 for the gas-discharge lamps and on 10 September 2015 for LED lamps.
Using data presented in Figure 5 the ratio of

FER versus SNR performance test results obtained from Nieszawska Street on 24 April 2015 for the gas-discharge lamps (the same as that in Figure 5) and on 28 August 2015 for LED lamps.
Eight curves presented in Figures 5 and 6 are the results of three 48-hour tests; all the tests were performed in the same separated LV network, dedicated only to the lighting purposes. Test number 1 took place in April 2015 where all the light sources were gas-discharge. Two curves as a result of this test are presented in Figure 5; exactly the same two curves are also presented in Figure 6. Test number 2 took place in August 2015 after replacing gas-discharge type lamps with LED ones. Two curves as a result of this test are presented in Figure 6. Replacement of gas-discharge type lamps with LED ones caused deterioration of the

Frequency spectrum of the noise signal, measured in the range of 80 kHz to 100 kHz: (a) before applying the 1 mH filter, (b) after applying the 1 mH filter.
About 15 dB noise reduction together with the increase of input impedance had significant, positive influence on
The results of the August and September tests also confirmed the performance observations noted on the lab test-beds. Using them it can be concluded that
the type of the lamps (gas-discharge or LED) in Smart Lighting LV network does not determine the performance of the transmission in narrowband PLC technology; the frame length has a significant impact on the transmission performance when LED lamps are applied; the frame length has rather small impact on the transmission performance when gas-discharge lamps are applied.
The third conclusion is more noticeable when less sophisticated kind of the PSK modulation is used, which is demonstrated in Table 1.
Values of the averaged difference of FERs calculated for 23- and 80-byte frames, transmitted in gas-discharge LV network versus modulation type.

Knowing the fact that in the frequency of ten kHz the impedance of the gas-discharge LV network is higher than the impedance of the LED LV network and also that small differences in
4. Bit Errors Distribution
Knowing the original format of the frame, both the BER (Basic Error Rate) and the bit errors distribution can be estimated. In this work the focus is only the bit errors distribution. The distance between two bit errors is defined as the difference between m and n, where m and n are the bit positions (the number of the bits in frame) one which the error occurred; additionally
For the bit errors distribution assessment, all the frames that had more than one error were examined. If there are x bit errors in the frame, it is possible to determine
In Figure 8 the bit errors distribution versus bit distance obtained from observations in the LV network which supplied LED lamps is presented.
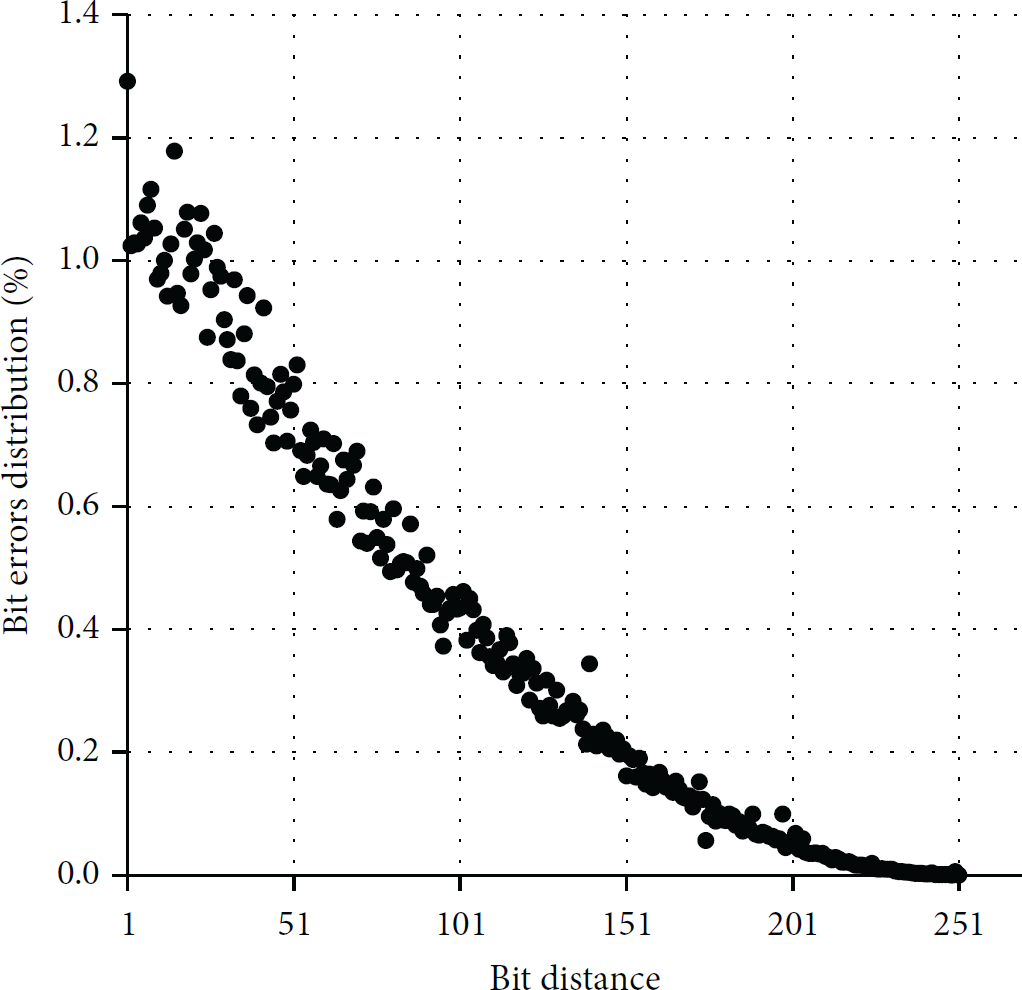
Bit errors distribution versus bit distance, for BPSK modulation, obtained from observations in the LV network used for LED lamps supplying.
Analysis of the data contained in the graph of Figure 8 proves well-known rule, namely; the biggest probability of the next error occurring is on the next bit after the erroneous bit [11]. The chart of the bit errors distribution has a decreasing trend.
For comparison, in Figure 9, the bit errors distribution versus bit distance obtained from observations in the LV network which supplied gas-discharge lamps is presented.

Bit errors distribution versus bit distance, for BPSK modulation, obtained from observations in the LV network used for gas-discharge lamps supplying.
The difference between charts presented in Figures 8 and 9 is evident; the bit errors distribution characteristic of gas-discharge lamps has extra oscillation. The period of this oscillation is about 95 bits. Knowing that the BPSK modulation was used during the test, the time for 95-bit transmission takes about
5. Conclusion
In this work no problem was solved. This paper describes the characteristic phenomenon for the narrowband PLC transmission in Smart Lighting LV networks, which supply gas-discharge lamps. To highlight this phenomenon all the presented transmission parameters and characteristics were compared with the same obtained from LED Smart Lighting systems. Most of the experiments were carried out in the same physical LV network, which supplied different types of lamps, making the results of experiments more credible and easier to analyze.
The test results presented in this paper may be particularly useful in the PLC communication protocols designing as well as in their parameterization. Knowing bit errors distribution characteristics of not coded types of modulations can be very beneficial when selecting the method of forward error correction [12, 13] or if the implementation of the peak noise avoidance algorithms makes sense.
The small impact of the frame length on the
Currently, Smart Lighting systems are implemented in many countries. This process may take place in three different ways:
installing the lamps already equipped with communication modules, adding communication modules to already installed “smart ready” lamps, which were originally equipped with DALI or 0–10 V lighting control interface [14], adjusting existing quite new gas-discharge lamps to be individually controlled.
Presented in this work, results can be helpful in the realization of any of the above processes as well as after replacing old overhead power lines with new cable ones.
Footnotes
Conflict of Interests
The author declares that there is no conflict of interests regarding the publication of this paper.
Acknowledgments
This research was supported by the National Centre for Research and Development and also by the National Fund for Environmental Protection and Water Management under the realized GEKON Program (Project no. 214093).