
Abstract
The sparsity problem of user-item matrix is a major obstacle to improve the accuracy of the traditional collaborative filtering systems, and, meanwhile, it is also responsible for cold-start problem in the collaborative filtering approaches. In this paper, a three-tier network Architecture, which includes user relationship network, item similarity network, and user-item relationship network, is constructed using comprehensive data among the user-item matrix and the social networks. Based on this framework, a Regression Model Recommendation Approach (RMRA) is established to calculate the correlation score between the test user and test item. The correlation score is used to predict the test user preference for the test item. The RMRA mines the potential information among both social networks and user-item matrix to improve the recommendation accuracy and ease the cold-start problem. We conduct experiment based on KDD 2012 real data set. The result indicates that our algorithm performs superiorly compared to traditional collaborative filtering algorithm.
1. Introduction
A variety of recommendation systems can help people to find useful information from big data sets. In these recommendation systems, the collaborative filtering algorithm (hereinafter referred to as CFA) is the most popular recommendation algorithm for its easy implementation and good expandability [1]. All of these algorithms are facing the following problems: (1) the data sparsity problem, in which the user-item matrix is highly sparse in most cases, leading to the inaccuracy of the user similarity calculated through this matrix; (2) the cold-start problem, in which a new user has not specified enough of his or her product preferences for the system to make effective predictions. Calculating the neighbors of a new user will fail because of the lack of evaluation records. This leads to the result that a new user cannot get effective recommendation. For solving these issues in CFA, Wang et al. have put forward a collaborative filtering algorithm based on both user and item, which brought about improvement to forecast difficulties and inaccuracy stem from data sparseness problem [2].
In early stage, these recommended systems were based on the assumption that users are independent and identically distributed. However, people usually ask for some friends' advice about some things, and friends' suggestions often play an important role in the final decision of the individual. With the rapid development of social network services (hereinafter referred to as SNS), such as Facebook (http://www.facebook.com/), Twitter (http://www.twitter.com/), and Tencent (http://www.qq.com/) a good social platform for information exchanging among people is provided. User relationship, user attributes, and item attributes in SNS can provide more available information for recommendation systems. Recently, improving the performance of the recommendation system using social network information has aroused the interest of many scholars [3–6].
The main contributions of this paper include (1) improving the accuracy of user similarity using user friendship and user natures in the SNS; (2) improving the accuracy of item similarity using item natures in the SNS; (3) proposing and constructing a three-tier network Architecture, which includes user similarity network, item similarity network, and user relationship network; (4) establishing a Regression Model Recommendation Approach (hereinafter referred to as RMRA) to calculate the correlation score between the test user and test item. The correlation score is used to predict the test user preference for the test item. The RMRA fully mines the potential information among SNS and user-item matrix, which can improve the recommendation accuracy and ease the cold-start problem. Experiment based on KDD 2012 real data set is conducted. The RMRA performs superiorly compared to traditional CFA.
2. Related Work
2.1. Prerequisites
In a recommendation system, user set and item set are two basic elements. Let the user set be
There are different kinds of relationship between users, such as user topology neighbor relations in the SNS, users similarity relationship based on user tags (user tags are some words that describe the user properties) in SNS, and user similarity relationship based on user-item matrix (user-based CFA is based on this relationship to predict). These relationships among users can constitute an integrated user relationship network (denoted by
Definition 1.
Define user relationship network as
Definition 2.
Define item similarity network as
Definition 3.
Define user-item relationship network as
A three-tier network Architecture is constructed by integrating networks

User-item integrated network.
2.2. Construction of an Integrated User Relationship Network
Many commercial websites, including Amazon, Taobao, and JD, provide users with personalized recommendation. The so-called personalized recommendation refers to the fact that commercial sites offer wish lists for people to buy commodities. Most of these sites offer recommendations for clients using CFA [7], since CFA has better scalability and easy implementation. CFA recommendation system uses two strategies, one is based on user [8, 9], and the other one is based on item [10, 11]. The former is mainly based on the user high similarity top N neighbors by user-item matrix calculation. If the nodes represent users and weighted edges represent similar relationship between the users, then the CFA constitute a user relationship network defined the same as in Definition 1. The user similarity calculated by using the CFA is sometimes inaccurate, since CFA calculates the similarity between users who only use user-item matrix, and the matrix is very sparse. To improve the accuracy of the similarity between users, this paper proposes a comprehensive relationship network with user-item matrix, trust relationship between users, and similarity between users' tags in SNS.
2.2.1. Calculate the Level of Trust between Users in SNS
Traditional CFA is based on the assumption that users are independent and identically distributed, which ignores the trust relationship between users and does not comply with the phenomenon that people often ask the opinions of friends in real life. In order to improve the accuracy of the recommendation, some recommendation system takes into account the information in the SNS, known as social recommendation systems [12–14]. Users may trust other users in SNS and the level of trust between users is a good predictor of user preferences. Trust relationship in SNS (e.g., the follower and followee in Twitter or Tencent) forms a directed graph as in Definition 1, where weighted directed edge

2.2.2. Calculate the User Similarity Using User-Item Matrix
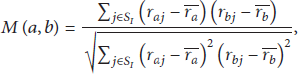
In the user-based CFA, first the similarity between test user and other users is calculated; then, according to the test user similarity neighbor's preference for test item, the test user preference for test item is predicted. The Pearson correlation coefficient between users is a frequently used method to calculate user similarity [15, 16], as shown in
2.2.3. Calculate the User Similarity Using User Tags in SNS
In SNS, not only are there trust relationships between users, but also some user behavior characteristics are exhibited; for example, users use keywords to represent their self-introduction which reveal their occupation, interest, and viewpoint. A series of those keywords is called user tags.
User tags are the user self-description, which is used to express their standpoint freely. Generally speaking, compared with other information (such as the information via data mining), it is more accurate to obtain user information and express user demand by using the user tags. Therefore, the similarity of user tags represents the user similarity to some degree. Generally, the user tags take the following form:

2.2.4. Building of an Integrated User Relationship Network
Due to the sparsity of a single data source, the user similarity calculated with a particular data source is sometimes insufficient and inaccurate. Formula (4) is the combination of formulae (1), (2), and (3) and is used to calculate the weights of the edges in Definition 1:

2.3. Construction of an Integrated Item Relationship Network
In item-based CFA, the similarity between test item and other items is calculated. If each node represents an item and a weighted undirected edge represents similar relationship between a pair of the items, then item-based CFA constitutes an item relationship network as in Definition 2. Item similarity calculated by CFA is inaccurate, since the CFA calculate the similarity between items only using user-item matrix, and the matrix is very sparse, which is the main reason affecting the accuracy of the recommended method. To improve the accuracy of the similarity between items, a comprehensive relationship network has been constructed with user-item matrix and similarity between item tags.
2.3.1. Calculate the Item Similarity Using User-Item Matrix
Item similarity is the basis of the CFA and is calculated with Pearson's correlation coefficient in this paper:

2.3.2. Calculate the Item Similarity Using Item Tags in SNS
In SNS, there are item tags that use a set of keywords to describe the item. The set of keywords is generally written by industry experts and is more accurate than other items of information (such as item information obtained by data mining). Thus, the similarity between item tags is a good complement to the item similarity based on user-item matrix. Item tag set takes the following general form:

2.3.3. Construction of an Integrated Item Similarity Network
Formula (7) is the combination of formulae (5) and (6) and is used to calculate the weights of the edges in Definition 2:

2.4. Construction of User-Item Relationship Network
By Definition 3,

3. The RMRA Based on Three-Tier Network Architecture
The idea of user-based CFA recommendation system is to determine whether a test user a has enough preferences for test item b (whether or not to recommend the item b to the user a). Firstly, based on the user-item matrix, the user a's top N most similar neighbors are obtained and let these neighbors constitute a set

In formula (9), the value
According to formula (10), formula (9) can be rewritten as

Formula (11) illustrates the similarity between test user u and other users
Let

Let

According to formulae (12) and (13), (9) can be extended to the following forms:

As seen from formula (14), there is a relationship between

Schematic diagram of incidence relation between test user u and test item i.

Schematic diagram of correlation between
The correlation between vectors

4. Algorithm Analysis
The time complexity of RMRA is mainly reflected in formulae (1), (2), (3), (5), and (7). Among them, the time complexity of formulae (2) and (5) is
5. Experimental Design and Analysis
5.1. Data Set
In order to verify the validity of RMRA, we carried out experiments on the KDD CUP 2012 Track 1 data (http://www.kddcup2012.org/). The following is a brief overview of data collection.
The data set of KDD CUP 2012 Track 1 is real sampling user data provided by Tencent (http://www.qq.com/). And the data set includes 2320895 users and 6095 items with a total of 73209277 users' ratings, wherein the data files and data format are as follows: user-item matrix (rec_log_train.txt) file is in a format of
Let

Thus, user-item matrix is pretty sparse. In this paper, the experimental facilities include a computer with CPU 2.6 GHz and RAM 8 G, because the size of the original data set exceeds our computer's processing power in both space and time, and thus we randomly take out 10 million data sets from the original data set as the experimental data set, and, in accordance with the tenfold cross-validation method, the experimental data set is randomly divided into 10 parts, with each part being used as a test set and the remaining 9 parts as the training set.
5.2. Evaluation Criteria
In this experiment, the RMRA's objective is to recommend an item list that the test user is interested in. In order to verify the accuracy of the recommended results, average accuracy (Mean Average Precision at N, which is MAP@N) is used to evaluate the accuracy of RMRA [17].
Given a test user u and a recommendatory list L of items sorted by the correlation score, AP@N is shown as follows:


5.3. Experimental Procedure
Step 1.
Calculate user similarity based user-item matrix, user tag's similarity, and user relationship topological distance, and then generate user relationship network
Step 2.
Calculate item similarity based on user-item matrix and item tag's similarity; then generate item relationship network
Step 3.
Generate user-item relationship network
Step 4.
Use three networks mentioned above, extract the vector
Step 5.
Test predictions and calculate MAP@3.
Step 6.
Carry on experiment on all 10 data sets. The average of MAP@3 in these experiments is the final MAP@3.
Step 7.
Calculate the MAP@3 according to the user-based CFA and item-based CFA. Then compare them to the RMRA.
5.4. Analysis of Results
In order to achieve the best average accuracy, the model parameters were trained. First, for the parameters θ and μ in formula (7) of item similarity network, since the two coefficients satisfy
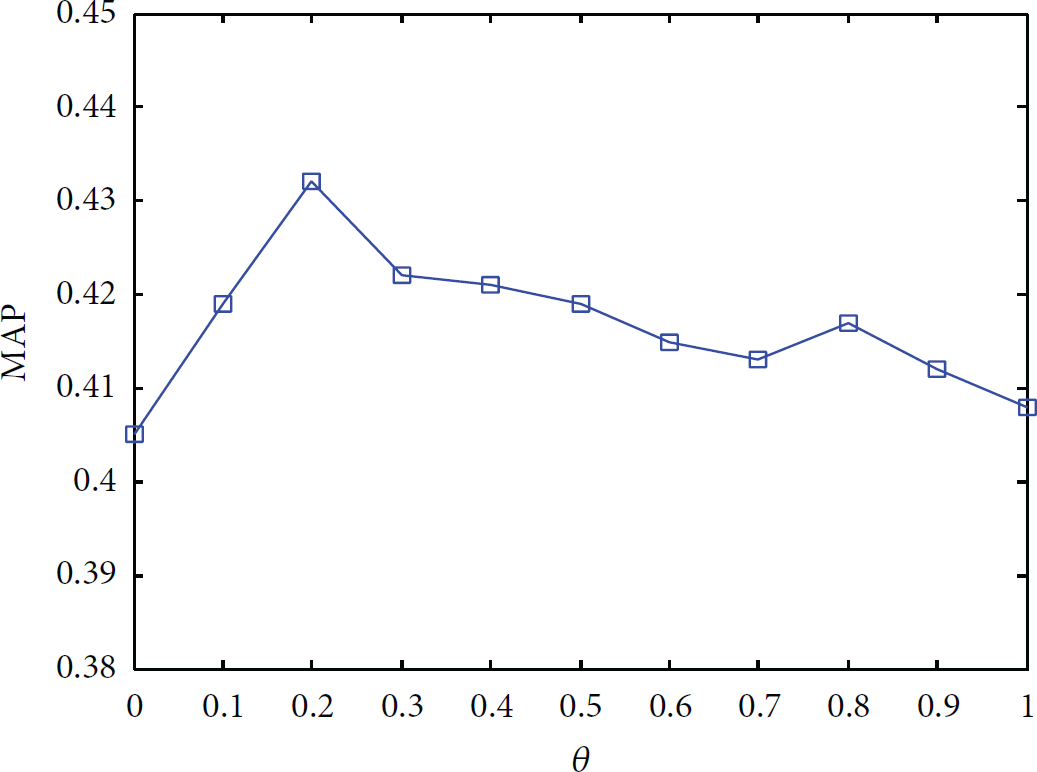
Impact of θ on MAP@3.
In Figure 4,
After the parameters of the item similarity network (formula (7)) have been determined, the parameters of user similarity network (formula (4)) need to be trained. Because
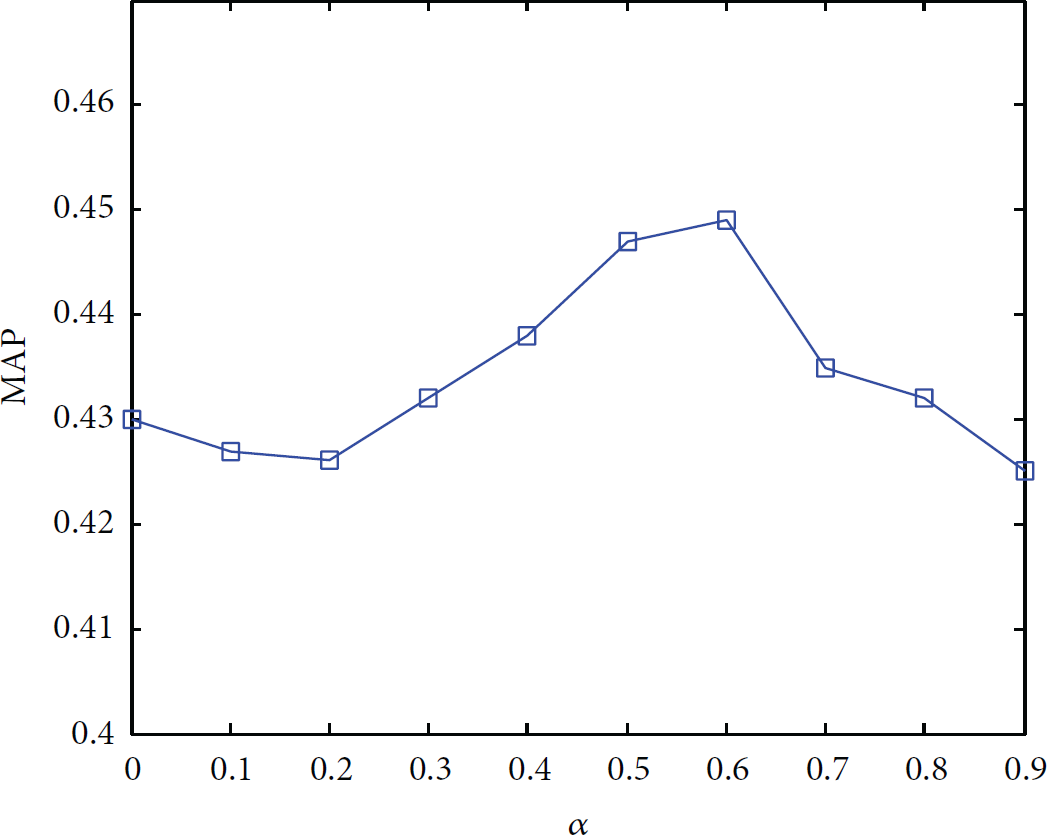
Impact of α on MAP@3.
In Figure 5,

Impact of β on MAP@3.
It can be seen from Figure 6 that the peaks of average accuracy in both cases were between 0.0 and 0.2. And in this interval, the curve
We get these different results of MAP@3 through Step 7 and compare them to the user-based CFA, Item-based CFA, and RMRA in Table 1.
Comparison of these models.

Table 1 shows that, after combining three networks, the recommendation effect using RMRA has been significantly improved. User tags similarity and user SNS relationship solve a part of data sparsity and cold-start problem.
6. Conclusion
In this paper, first a three-tier network Architecture, which includes user relationship network, item similarity network, and user-item relationship network, is constructed using comprehensive data among the user-item matrix and the social networks. Then, based on these networks, the RMRA was established to calculate the correlation score between the test user and test item. The correlation score is used to predict the test user preference for the test item. The experimental result indicates that our algorithm performs superior than the traditional CFA.
In our future work, we will focus on improving the performance of the recommendation system using a variety of information combination methods. Since the size of raw data sets processed by a recommendation system is very large, parallel algorithms in recommendation system should be used in our future research.
Footnotes
Competing Interests
The authors declare that they have no competing interests.
Acknowledgments
This work is supported by the National Natural Science Foundation of China (no. 61371177 and no. 61170262).