
Abstract
The Smart Grid represents a revolution especially at distribution and customer levels, bringing monitoring and control capabilities, traditionally available up to the primary substations, down to the secondary substations, and beyond. Machine-to-Machine (M2M) communications networks are key to enable managing the huge number of sensors and actuators distributed all over the low voltage and medium voltage networks. Such M2M communications networks must meet demanding requirements from the technical perspective (e.g., low latency, high availability), since eventually the stability of the grid may rely on them, and from the economic perspective (e.g., low deployment and operational costs), due to the huge volume of devices to be monitored and controlled. Thus, Power Line Communications (PLC) technologies are winning momentum in these scenarios because they represent a great trade-off between both perspectives. However, electrical networks also represent a harsh communications medium, mainly because they are not designed for data communications, but for power transmission. Consequently, although much research has been carried out on this topic recently, PLC networks still present technological problems and challenges. This paper highlights some of the most relevant challenges in this area and presents a set of cutting-edge software tools which are being developed to overcome them, facilitating the planning, deployment, and operation of this kind of networks.
1. Introduction
The Smart Grid represents a revolution, especially at the distribution and customer domains, due to the following reasons:
First, the most radical changes are introduced at the medium voltage (MV) and low voltage (LV) networks, for example, Distributed Generation (DG) based on renewables, Electric Vehicle (EV), or Residential Demand Response (RDR). Second, the management of the electrical grid has traditionally been focused on the bulk generation and transmission domains, based on the so-called Supervisory Control and Data Acquisition (SCADA) systems, which were deployed down to the primary substations, responsible for transforming high voltage into medium voltage levels. However, the Smart Grid gets deep into the MV and LV networks, with the remarkable increase on the number of devices to be monitored and controlled that such a new approach entails.
Thus, Machine-to-Machine (M2M) communications networks are especially important in the Smart Grid in that they are key to enable effectively managing the aforementioned huge number of sensors and actuators distributed all over the MV and LV networks. As a result, such M2M communications networks must meet demanding requirements from the technical perspective (e.g., low latency, high availability) [1], since eventually the stability of the electrical grid may rely on them, and from the economic perspective (e.g., low deployment and operational costs) [2], due to the huge volume of devices to be monitored and controlled. As a matter of fact, Power Line Communications (PLC) technologies are winning momentum in these scenarios, notably because they represent a great trade-off between both perspectives.
First, Narrowband-PLC (NB-PLC) technologies are being widely used—especially in Europe—to enable the communication between smart meters and data concentrators (typically located at the secondary substation (SS)) in currently deployed Advanced Metering Infrastructures (AMI) [3] (it should be noted that a smart meter itself represents a sensor and an actuator, so no additional monitoring and control network needs to be deployed to collect data on the status of the electrical infrastructure, e.g., to detect overvoltage/undervoltage situations). PoweRline Intelligent Metering Evolution (PRIME) stands as a promising NB-PLC technology out of the available ones. The specification of this technology has been driven by market leaders such as Iberdrola and Texas Instruments and it has recently become an international standard (ITU-T G.9904) [4]. It is currently being deployed in countries like Spain, Portugal, United Kingdom, Poland, Brazil, or Australia, being officially more than 5 M PRIME-compliant smart meters already in the field. Furthermore, by 2018 there will be around 15 M PRIME-compliant smart meters deployed only in Spain (due to the Spanish directive IET/290/2012), and the new version of the standard (v1.4) expands its focus worldwide, including frequency bands for the American and Asia Pacific markets.
Second, Broadband over Medium Voltage Power Lines (MV-BPL) cells (a cell is a group of secondary substations connected by means of medium voltage cables that communicate using them in a given frequency band up to the so-called gateway) are also of special interest to Distribution System Operators (DSOs) because they present advantages such as keeping the communications infrastructure largely under their control or reducing the number of required backhaul connections [5]. As a result, DSOs are using more and more such MV-BPL cells instead of alternative solutions (e.g., cellular technologies) for teleoperation and distribution automation applications and for the aggregation of AMI data [6]. The main two standards that specify this kind of communications are IEEE 1901 and ITU-T G.hn [7]. Although such specifications are different, different equipment compliant to any of these standards can, theoretically, interoperate in the same cell.
Despite using the electrical infrastructure as communications medium brings many benefits to DSO (e.g., cables are already there, so deployment costs are reduced dramatically), it also represents a harsh communications medium, mainly because it was not designed for data communications, but for power transmission. Hence, although much research has been carried out on this topic recently, PLC networks still present technological problems and challenges. Currently, some of the most relevant challenges on this area are along the following lines:
Traffic analysis tools that allow remotely monitoring and diagnosing communications problems in operational PLC networks, thus reducing troubleshooting time and associated costs. Simulation tools that facilitate the planning, evaluation, and deployment of PLC networks, minimizing risks, time, and cost.
This paper addresses both issues, presenting a set of cutting-edge software tools that have been developed for these purposes.
The remainder of the paper is structured as follows. Section 2 provides an overview of both NB-PLC and Broadband over Power Lines (BPL) technologies, paying special attention to PRIME and to the IEEE 1901 Access System specification (MV-BPL), due to their relevance in the part of the industry which falls under the scope of the paper. Section 3 describes the implementation details of the aforementioned set of software tools, which are indeed focused on PRIME and on MV-BPL. Section 4 outlines the main results obtained using such tools so far. Section 5 compares the tools presented in this paper with related work and discusses how such tools can provide added value using them either separately or jointly. Finally, Section 6 summarizes the paper and draws conclusions.
2. Overview of PLC Technologies
2.1. NB-PLC
Several studies [8–11] and pilot projects developed by major DSOs [12] point to NB-PLC as the most suitable technology to implement Smart Grids (and Smart Metering) on the interface between the data concentrator and the smart meters. That is the reason why this section focuses on available NB-PLC technologies. Thus, while Section 2.1.1 provides an overview and technical comparison of the most accepted NB-PLC standards in agreement with [3], Section 2.1.2 describes PRIME in detail, due to its relevance in both the industry, in general, and this paper, in particular.
2.1.1. Overview of NB-PLC Technologies
Next, the most relevant NB-PLC standards available in the market are described briefly:
Meters and More is a nonprofit international association led by the ENEL group. The association aims to boost and promote the communication protocol with the same name, which has also been standardized by the IEC. The solution consists of a narrow-band Binary Phase Shift Keying (BPSK) modulation over PLC able to reach up to 4.8 kbps. Encryption and authentication is also implemented via a 128-bit Advanced Encryption Standard (AES) key. One of the strongest points of Meters and More is that ENEL has already deployed this technology in 100% of the smart meters in Italy. Endesa is also using it in large pilot projects in Malaga and Barcelona (Spain), as well as in the rest of Spain, in the massive deployment dictated by Spanish directive IET/290/2012. Open Smart Grid Protocol (OSGP) is promoted by Echelon, although its lower layers are being also standardized by the IEC. This protocol presents its highest penetration rates in the Nordic countries and Russia. CX1 is promoted by Siemens, although its lower layers are also being addressed by the IEC. This technology is mainly deployed in Austria. PRIME is the definition of the lower layers of an Orthogonal Frequency-Division Multiplexing- (OFDM-) based NB-PLC system that operates in either the CENELEC A (9–95 kHz) or FCC (3–500 kHz) band, depending on the standard version. A standard has recently been published by the ITU-T (G.9904) [4]. PRIME specification is promoted by the PRIME Alliance, led by the Spanish DSO Iberdrola and Unión Fenosa. However, as it has already been mentioned in Section 1, it is not being deployed only in Spain, but also in other countries like Portugal, United Kingdom, Poland, Brazil, or Australia. G3-PLC is a standard developed by EDF and Maxim. Similar to PRIME, it uses OFDM to allow a more efficient use of the spectrum. In contrast with PRIME, G3-PLC is more focused on increasing the robustness in the communication thanks to an outer layer of channel coding. This increase in performance comes at the cost of a lower transmission speed (up to 34 kbps when using CENELEC A band). This technology is widely used in countries where EDF operates, like France. G.hnem specification is detailed in the ITU-T G.9902 recommendation for NB-PLC below 500 kHz [13]. As a matter of fact, it represents an effort from the ITU-T to homogenize the available NB-PLC technologies (especially, PRIME and G3-PLC). The PHY transceiver design counts with several configurations to be used depending on the band-plan available for communication (i.e., CENELEC A/B/C/D or FCC). In any case, all configurations use an OFDM-based modulation with different numbers of carriers and pilots. In terms of robustness, G.hnem outperforms G3-PLC, since it includes several interleaver structures specially designed to mitigate AC-synchronous impulsive noise. However, G.hnem is computationally heavier than PRIME and G3-PLC. The IEEE 1901.2 is the recent proposal made by the IEEE in order to design a NB-PLC transceiver. Due to its later appearance, some parts are based on both PRIME and G3-PLC designs. In addition, it provides mechanisms for the coexistence with these two solutions by dynamically changing the frequencies that will be used as data subcarriers. IEEE P1901.2 uses OFDM in the
Table 1 summarizes the main differences and similarities between the NB-PLC technologies with higher market share. It should be noted that single-carrier technologies such as OSGP or M&M transmit at theoretically lower data rates but are more robust to the effects of, for example, noise. However, they may be also more sensitive to jamming attacks.
Comparison between main NB-PLC technologies.

2.1.2. PRIME
As it has been already mentioned, PRIME is a second-generation NB-PLC technology whose development was initially led by the PRIME Alliance, although version 1.3.6 of the specifications of the PHY, MAC, and Convergence layers was also accepted as standard by the ITU-T in 2012 [4]. Version 1.4 expands the frequency spectrum and includes some features to increase the robustness of the communication at physical (PHY) and Media Access Control (MAC) levels.
From a PHY perspective, PRIME operates in the 41–89 kHz (v1.3.6) or 3–500 kHz (v1.4) bands using OFDM modulation in order to make a more efficient use of the spectrum. Carriers may use Digital Binary Phase Shift Keying (DBPSK), Differential Quaternary Phase Shift Keying (DQPSK), or Differential 8-Phase Shift Keying (D8PSK). Prior to modulation, data might also be interleaved and coded in order to increase robustness in the transmission (the inclusion of both the interleaver and the coder is commonly known as Forward Error Correction (FEC)). At PHY level, PRIME transmission speed can go from 5.4 kbps to 1028.8 kbps, depending on the FEC and digital modulation combination (also known as communication mode).
At MAC level, two different kinds of nodes are defined: Base Node and Service Node. Only one Base Node is allowed per PRIME network since it acts as coordinator. In common AMI terminology, the Base Node is known as data concentrator or just concentrator. Although Service Nodes are generally smart meters, depending on the network needs, they may also promote to switches. The main goal of switches is to increase signal range in the cable via a relying mechanism, thus mitigating the effects of attenuation and noise. Thus, the physical topology of this kind of networks is a bus, whereas the logical topology is typically tree-wise. An aspect to consider is that the position of these switches may influence the performance of the network (nevertheless, no indication is given in the standard on the promotion criteria), as discussed in [14].
Regarding MAC mechanisms, although the standard defines both a Shared Contention Period (SCP) and a Contention Free Period (CFP), currently only the SCP, which is based on Carrier Sense Multiple Access with Collision Avoidance (CSMA/CA), is implemented by manufacturers. Nevertheless, research is being carried out on the potential benefits of using the CFP to support new Smart Grid services [15].
The Logical Link Control (LLC) level, belonging to the Convergence layer, is responsible for handling the logical connections. It identifies each transaction with an identification number and performs the flow control processes. Flow control is implemented in PRIME by setting a Maximum Transmission Unit (MTU) and by using a sliding window procedure. MTU is hard-coded in each meter and defines the length in bytes of the longest MAC Service Data Unit (MSDU) to be transmitted. In case the application tries to send a longer data payload, the LLC layer fragments it in several MSDU each one no longer than the MTU. Each one of these fragments is labeled with an identifier so that the receiving party can reassemble them. With respect to the sliding window procedure, PRIME sets different allowed values for the window size (WS). These values are device-specific but, as it will be shown later on, play an important role in the performance of the network in terms of latency. Furthermore, PRIME devices may or may not implement Automatic Repeat Request (ARQ) capabilities to ensure the correct reception of all messages. Since ARQ parameters are negotiated at the connection phase, this process works end-to-end (i.e., between final transmitter and receiver).
At application layer, Device Language Message specification/COmpanion Specification for Energy Metering (DLMS/COSEM) is commonly used over PRIME. More precisely, COSEM (IEC 62056-61/62) is a profile of the application protocol DLMS (IEC 62056-53) specially designed for energy metering [16, 17]. As such, DLMS/COSEM includes data models to represent common energy-related parameters together with a communication protocol designed to transmit this kind of information.
2.2. BPL
BPL refers to the PLC technologies that allow relatively high-speed data transmission over power lines. It can be used in LV and MV scenarios, typically enabling home network multimedia communications in the first case and distribution automation/telecontrol in the latter.
As it has already been mentioned, the main standards providing specifications for BPL communications over MV distribution infrastructures are IEEE 1901 (notably the Access System specification) and ITU-T G.9960 (also known as G.hn) [7]. IEEE 1901 is currently widely used in operational medium voltage networks of Iberdrola; it is being tested by Unión Fenosa in several pilot schemes and so has been selected as reference for one of the simulation tools presented later on. As a result, Section 2.2.1 briefly compares both standards, whereas Section 2.2.2 describes the IEEE 1901 Access System specification (MV-BPL) in detail, with the aim of facilitating the understanding of the remainder of the paper.
2.2.1. Overview of BPL Technologies
IEEE 1901 standard considers two different PHY/MAC specifications: one based on Fast Fourier Transform (FFT) and another one based on Wavelet. Furthermore, it describes both indoor broadband communications over LV lines and broadband communications over MV lines [18] (the MV-BPL cell simulation tool described later in this paper implements the PHY/MAC specification based on FFT for MV distribution infrastructures).
G.hn standard features very similar technical specifications compared to IEEE 1901, as shown in Table 2, which allows interoperability in equipment implementing either standard. G.hn describes broadband communications not only over power lines, but also over telephone wiring and coaxial cables [19].
IEEE 1901 versus G.hn features [25].

Another well-known BPL technology is HomePlug AV, specified by the industry association HomePlug Alliance. HomePlug AV-compliant products are fully interoperable with IEEE 1901-compliant products, HomePlug technology having been included in the baseline IEEE 1901 standard (2008). Standing out among the multiple specifications of the HomePlug Alliance is HomePlug Green PHY. HomePlug Green PHY targets applications related to the so-called Internet of Things (IoT) such as home automation and control, home energy management systems, or even EV charging, so consumption, cost, and data rates are reduced compared to HomePlug AV.
2.2.2. IEEE 1901 Access System: MV-BPL
In the PHY layer, IEEE 1901 uses OFDM as modulation technique. The frequency band considered in the standard ranges from 2 to 30 MHz, but actual implementations use a subset of this range organized in two operational frequency bands. The first frequency band (the so-called Mode 1) ranges from 2 to 7 MHz, whereas the second frequency band (the so-called Mode 2) ranges from 8 to 18 MHz [5]. Hence, Mode 2 allows for higher data rates than Mode 1, but it is also more sensitive to attenuation.
Data rates in a given MV link are in principle asymmetric, since the background noise power may differ in the two SSs at the edges of the link. The performance requirement currently fixed for MV networks is the ability to transmit a minimum of 100 kbps of real-time simultaneous bidirectional application throughput (i.e., goodput) for all the deployed SSs. However, broadly speaking, raw data rates of around tens of Mbps can be achieved in practice [6], although this heavily depends on parameters such as the cable type or the distance between SSs. As a rule-of-thumb, older Paper-Insulated Lead Cable (PILC) cables support acceptable goodputs on cable lengths up to 450 m, whereas newer PolyEthylene insulated cables do so on cable lengths up to 900 m [5]. In addition, overhead and underground cables also present different frequency responses in terms of attenuation [20]. For instance, assuming Mode 1 and a new high-quality underground MV link, 1,000 meters would be the maximum distance limit [6].
IEEE 1901 defines three different kinds of nodes, namely, the Head End (HE), the Repeating Stations (RSs), and the Network Termination Units (NTUs). Although the underlying physical topology of MV networks fits a ringed-mesh topology, the communications overlay on top of it forms a tree-wise logical topology. As defined in the standard, such a tree can be different for signaling and data traffic, as more robust modulations are used for the former while faster data rates are sought for the latter [21]. However, in practice, the topology is defined manually.
Coming back to the nodes defined in IEEE 1901, NTUs represent the leaves of such a tree-wise topology and work as gateways to networks placed at lower levels of the hierarchical power distribution infrastructure (LV networks in this case). RSs work as communications relays and the HE coordinates the communications inside the cell and also works as a backhaul communications gateway.
However, in practice, the role of the HE is split into two nodes: the master, which coordinates the communications within the cell, and the gateway, which provides such a backhaul communications capability. This division is due to the fact that different criteria are used in practice to select the master and the gateway. In principle, the node that presents the lowest mean distance to all the other nodes in the cell is the perfect candidate for the master role in order to minimize losses, whereas the selection of the gateway tightly depends on the communication equipment installed in the SSs. Nevertheless, it may happen that the master and the gateway roles are assigned to the same SS, as specified in the standard.
At MAC level, two periods are defined: a Contention Period (CP), where CSMA/CA is used as multiple access method, and a CFP, where Time Division Multiple Access (TDMA) is used as multiple access technique. The CFP is employed for data transmission and three TDMA variants are considered [21]: (1) Centralized TDMA, where the master allocates time slots for every path between a given node and the gateway (the IEEE 1901 simulation tool presented later in this paper implements this TDMA flavour, since it is the one currently being used in MV-BPL deployments in Spain); (2) Dynamic TDMA Polling, where the master fixes the slots at the beginning of each transmission period based on the result of polling all the nodes in the cell; and (3) Distributed TDMA, where the master only assigns slots to its neighbors and delegates to them the responsibility of allocating time slots to their corresponding neighbors.
TDMA is also used for MV-BPL network planning by defining TDMA domains working in one of the aforementioned frequency bands which are able to coexist with adjacent TDMA domains working in a different frequency band [6]. Frequency bands can be reused further away, analogously to cellular communications systems, if guard distance over MV cable is appropriately provisioned to avoid interferences. Alternatively, smart notching techniques can be also applied to mitigate the effect of interferences, at the expense of penalizing data rates [22].
3. Description of the Set of Tools
This section describes the technical details of the set of cutting-edge software tools mentioned in Section 1, which aim to facilitate the planning, deployment, and operation of PRIME and MV-BPL networks for power distribution monitoring and control applications. Section 3.1 is focused on remote and automatic traffic analysis in PRIME networks; Section 3.2 provides implementation details of a PRIME network simulation tool; and Section 3.3 provides implementation details of a MV-BPL cell simulation tool.
3.1. PRIME Traffic Analysis and Diagnosis Tool
The tool presented in this section allows automatically processing some PRIME-network-related information recorded by the concentrator which can be retrieved remotely. To be more precise, in the specific case addressed throughout this paper, such data is gathered from the Grid Integration Laboratory (LINTER) of Unión Fenosa Distribución [23]. This laboratory is equipped with smart meters and concentrators from the main manufacturers of the market, as well as with microgeneration installations and EV charging spots.
Figure 1 shows the smart metering testbed available in the LINTER. It should be noted that it is equipped with attenuators to emulate longer distances, although in the test considered in this work they are not used.

LINTER testbed topology. CNTR stands for concentrator. Att stands for attenuation.
The analysis of the scenario considered in this work is based on the following files:
“S11 Report”: standard report obtained from the concentrator in Extensible Markup Language (XML) format that includes information about the network topology. “Results”: Comma Separated Value (CSV) file obtained from the concentrator including information about smart meter manufacturers as well as about the smart meters that were successfully read and the smart meters that were not. “Traffic trace”: Log provided by Circutor concentrator that includes CSV for PRIME layer and hexadecimal representation of DLMS/COSEM.
Prior to analyzing the data exchanged by the network elements, it is important to extract and process the information related to the topology. Manufacturer information is also useful to see the influence of the different implementations in the communications parameters.
“S11 Report” contains information related to the network topology, such as the total number of nodes that are registered in the network, the number of nodes acting as switches, or the nodes that make use of those switches. This information can be obtained from the Switching ID (SID), Local Node ID (LNID), and Local Switch ID (LSID), included in the “S11 Report.” By processing this standard report, it is obtained that the PRIME network under study is composed of 88 smart meters, 3 of them working as switches, with 4, 3, and 2 nodes acting as leaves in the logical tree, respectively.
Manufacturer information is extracted from the “Results” file. Using this file, the vendor can be obtained from the “MeterID” field. The chipset manufacturer is extracted from the MAC address using a MAC address vendor look-up service [24].
As we can see in Table 3, the data under analysis belong to a very heterogeneous testbed in terms of smart meter vendors, with 9 different manufacturers. The reasons why some chipsets have not been identified may be that they are using locally administered MAC addresses.
Distribution of vendors and chipset manufacturers for the smart meters of the PRIME network under study.

The presented analysis and diagnosis tool is based on the traffic traces provided by Circutor concentrators, which include CSV for PRIME layer and hexadecimal representation of DLMS/COSEM application layer. Data from the traffic traces are extracted using regular expressions, which provide a fast and simple way to identify patterns and extract the target parameters. Some interesting parameters that can be obtained from the traffic traces are as follows:
High level indicators of the quality of the communications, such as the time required to retrieve consumption information from each meter (TTRi) (unlike other technologies like 802.11 or 802.3, where optimizations aim to reach a trade-off between throughput and consumption, in AMI, DSOs are not so concerned about the consumption of the smart meters themselves, but about latency). Parameters related to the MAC and upper layers, such as the MSDU length and the effective window size (it should be noted that these parameters are not specified in the datasheets of the devices. In the concentrator, this kind of parameters may be set by accessing it remotely (e.g., via telnet). In smart meters, however, they are set in firmware). Parameters related to the PHY layer, such as the Signal to Noise Ratio (SNR) values from each of the meters to the concentrator or the modulation in use.
Figure 2 shows the typical traffic exchange between the concentrator and the smart meters for a meter reading, the left side of the figure focusing on DLMS/COSEM and the right side focusing on PRIME fragmentation.

Example of the messages involved on a meter reading request/response. CNTR stands for concentrator. SM stands for smart meter.
The time to read a 24-hour consumption report (referred to as Time To Read (TTR) throughout this paper) is the metric chosen in this paper to evaluate the network performance. Regarding this, the file that contains the hourly meter reads for a given day is commonly known as “S02 Report” and it can be retrieved from the concentrator. This report is selected to carry out this analysis for two reasons: (1) because it is widely used by DSOs in current operation; (2) because it is large enough as to ensure message fragmentation. The TTR is calculated as the time between the first
To obtain the MSDU length, the PRIME layer frame size is extracted from all the PRIME frames starting a DLMS/COSEM
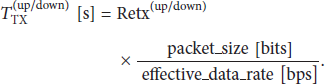
Effective WS is calculated as the number of PRIME frames sent without being acknowledged. Although there is a “windows size” parameter in the PRIME standard, the constraints that determine the effective WS are (see (1)) the following:
The PRIME flag “flush” that, if present, forces each individual frame to be acknowledged. The DLMS/COSEM parameter “nsegs,” which indicates the number of PRIME segments to be sent per DLMS/COSEM response block:
where 
3.2. PRIME Network Simulation Tool
The tool presented in this section represents an extension of the PRIME network simulator presented in [26]. This simulation tool combines both MATLAB and OMNeT++ in order to model the PHY and upper layer effects, which, in the case of PRIME, are the MAC, LLC, and Application. Figure 3 shows a scheme of the PRIME network simulator architecture. The figure illustrates the typical protocol stack for AMI: PRIME implements PHY, MAC, and LLC layer, whereas at the application, DLMS/COSEM is commonly used.
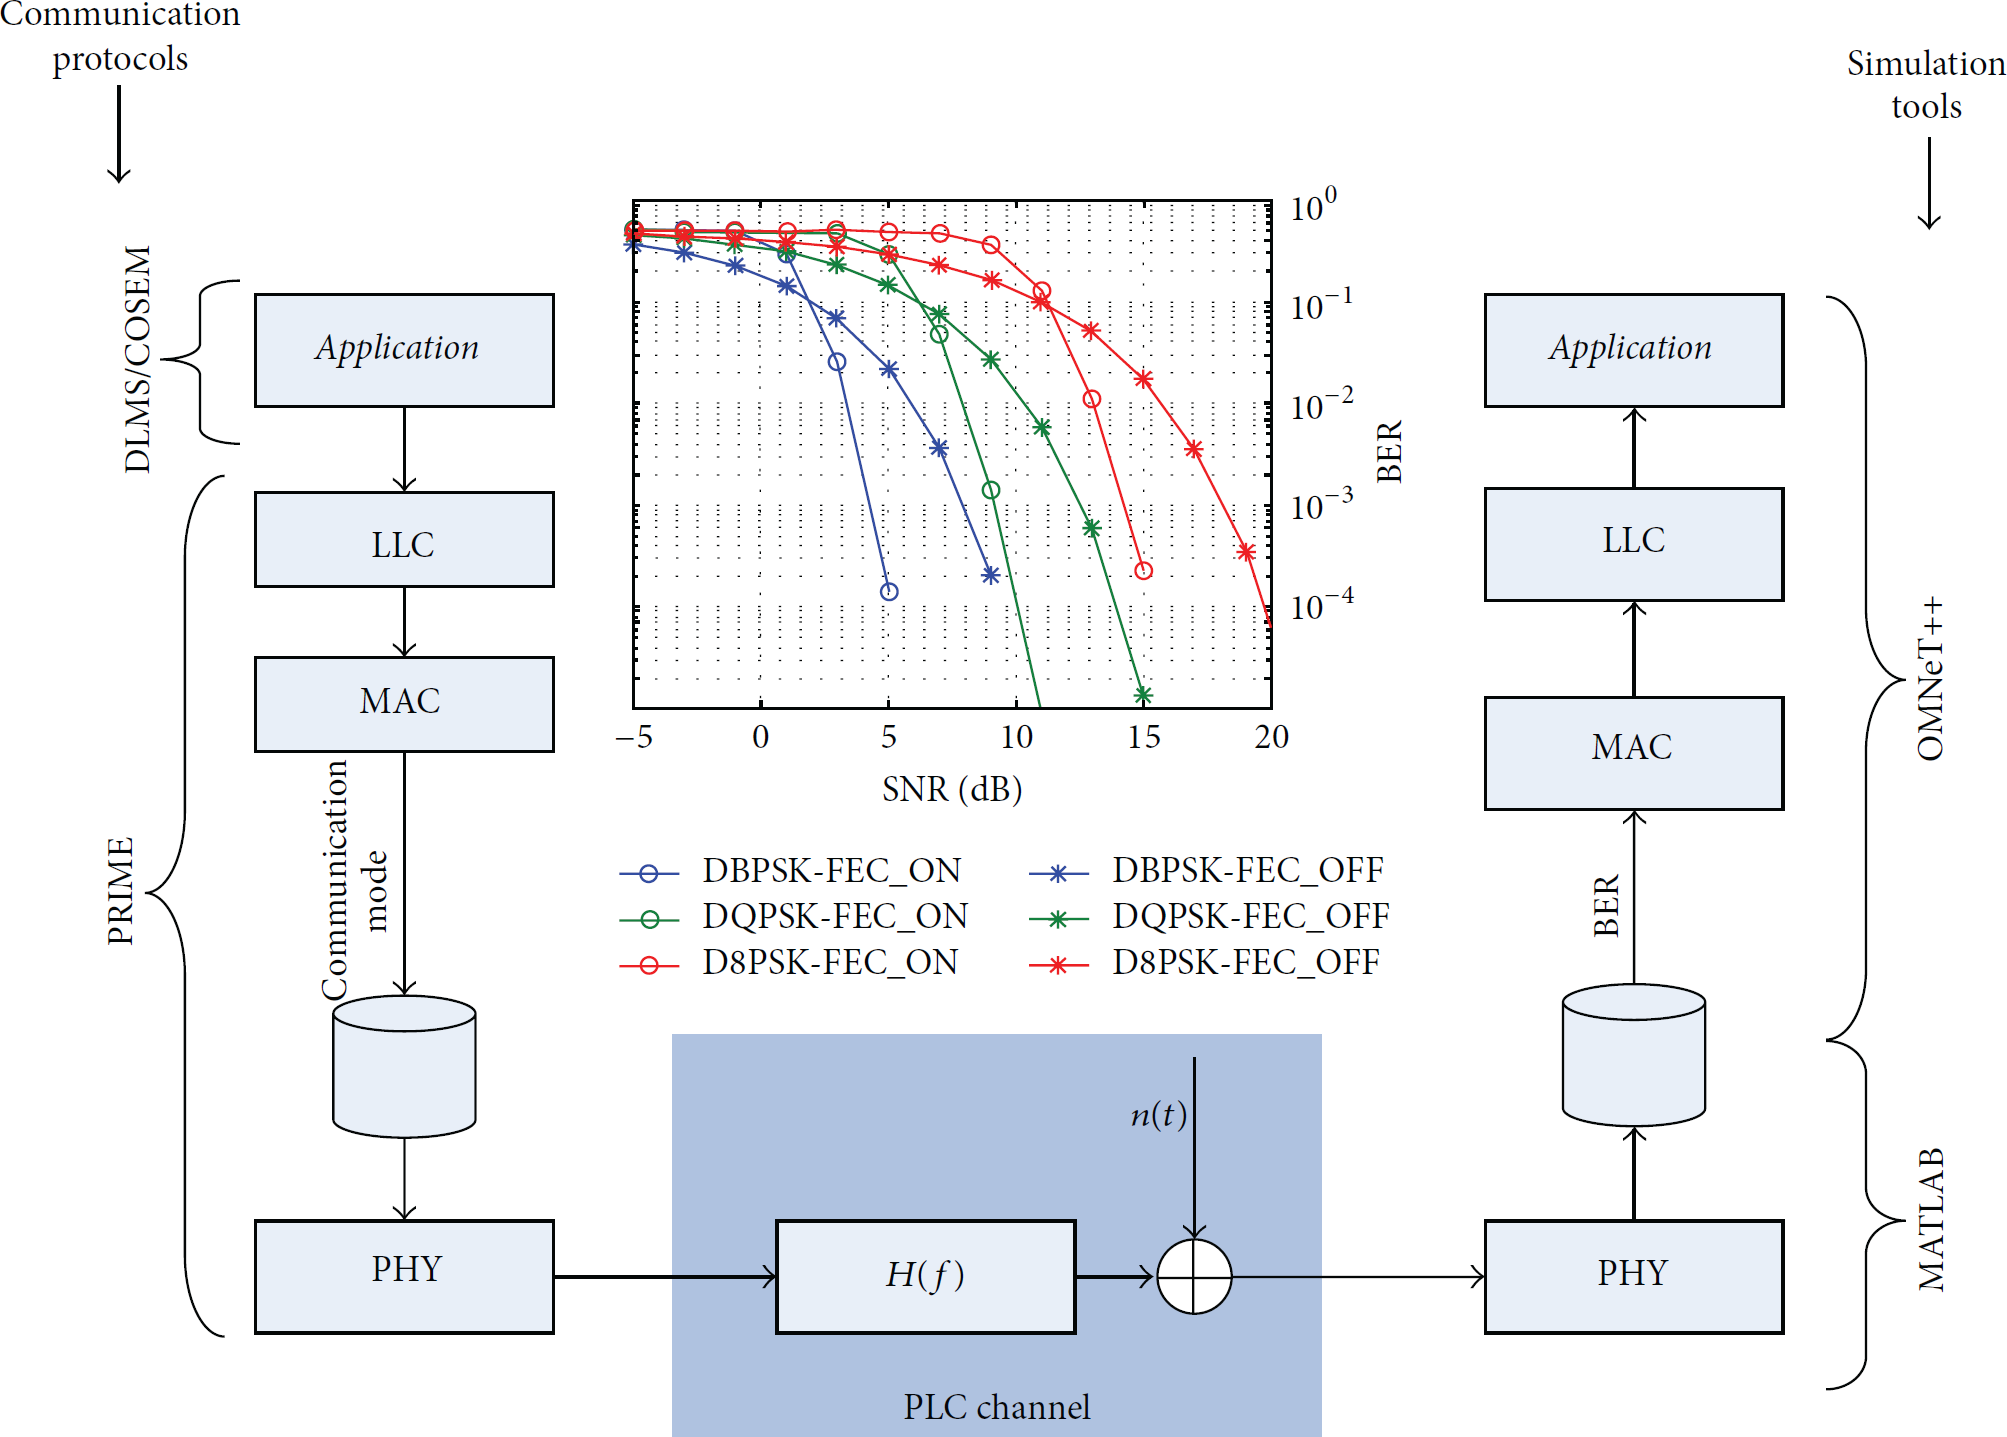
Architecture for the PRIME network simulation tool.
With respect to the PRIME network simulator architecture, the MATLAB-OMNeT++ integration is not performed “online.” The model developed in MATLAB is responsible for computing the attenuation between each pair of nodes and obtaining the communication performances in terms of Bit Error Rate (BER) versus SNR curves (i.e., emulating the PHY layer).
Since the position of nodes is known before and does not vary, attenuation is precomputed for each pair of nodes in the network and stored in a static file. This computation is done via Transmission Matrix Theory. However, for the sake of brevity, no details are given in this paper regarding this procedure. The interested reader is invited to review the explanations provided in [26] with respect to this matter.
Together with the attenuation file, the MATLAB model also provides another file with the simulated performance of all the communication modes defined in PRIME (as discussed in Section 2.1). This performance is measured with the BER as a function of the SNR, as it is also illustrated in Figure 3.
These two files are used by OMNeT++ to decide whether a message was received with or without errors. In order to obtain corresponding BER value, all packets are assumed to be transmitted using the maximum power allowed by the standard. In addition, the background noise power is computed using Hooijen's model [27]. These two values are used in conjunction with the attenuation to compute the corresponding SNR for all pairs of the nodes following:

Another key feature of this tool is the development of an algorithm able to select the most appropriate Service Node to promote to switch. The selection criteria for switches are not defined in PRIME standard. However, the position of the switches in the network is directly related to its performance in terms of latency. Switches too close to the Base Node will communicate using a slower communication mode with the rest of the network, since they will need a more robust mode to compensate for the higher attenuation. On the contrary, switches placed too far from the Base Node will communicate slowly with it following the same elaboration as before. Therefore an optimal selection of the positions of the switches is fundamental to increase network performance (e.g., as low latency as possible).
The original version of the PRIME network simulator [26] has been extended allowing, for instance, the simulation of specific topologies. Such topologies are specified by means of the aforementioned standard file “S11 Report,” provided by the concentrator. In addition, the original PRIME network simulator has been also extended to allow fixing BER depending on the different logical levels in the network, deriving the attenuation values from such BER values (see (2)).
3.3. MV-BPL Cell Simulation Tool
The tool presented in this section calculates the Round Trip Time (RTT) between each node of a given MV-BPL cell and the gateway based on certain input parameters.
OMNeT++ was initially considered for the development of this tool, since the involved research groups are experienced with this network simulator and there were already similar works available in the state of the art [28]. However, this option was finally ruled out due to the following reasons: (1) there is high complexity of accurately implementing Centralized TDMA (e.g., [28] implements it as a token passing mechanism); (2) TDMA actually makes data communications deterministic; (3) handling OMNeT++ requires a learning curve which hampers the use of a tool based on it in operational environments. Although MATLAB and Excel were considered, finally, MATLAB was selected due to the following reasons: (1) MATLAB is optimized for working with matrices; (2) MATLAB allows generating an executable file which abstracts the complexity behind the tool and facilitates its use in any operating-system-compatible machine through the user friendly Graphical User Interface (GUI) shown in Figure 4.

Graphical User Interface of the MV-BPL cell simulation tool.
Figure 4 also shows the input parameters considered by the MV-BPL cell simulation tool. Cell represents the current MV-BPL cell under study. This parameter includes, in turn, the following:
ID: a vector with the actual IDs of all the nodes of the MV-BPL cell. D: gw_with_two_bpl_interfaces: a Boolean parameter to explicitly indicate whether the gateway uses two MV-BPL communications interfaces (if “1”) or not (if “0”). This is important to calculate the power transmission since, if a node uses two MV-BPL interfaces, the power transmission is equally split into both. The nodes that use only one MV-BPL interface represent either the leaves or the root (i.e., the master) of the tree-wise logical topology. The leaves and the root (if it is not also the gateway) are identified in D because the columns associated with them are “0.” If the master is also the gateway, this condition does not hold for the root. However, the gateway is identified in D because the row associated with it is “0.” So, if the master is also the gateway, not only the former condition but also the latter condition needs to be considered when computing transmission powers.

MV-BPL cells considered in the paper. Numbers outside the boxes represent distance in meters. Both cells are deployed in the field. (a) represents a small MV-BPL cell where the same node works both as master and as gateway. (b) represents a larger MV-BPL cell that illustrates how in practice the functionality of master and gateway can be split into different nodes.
Frequency band allows selecting either Mode 1 or Mode 2 that have already been explained in Section 2. Background Noise computes the background noise power in the selected band for either the worst case or the best case specified in the Annex F: “Channel and noise analysis and models for BPL systems” of IEEE 1901 specification [29]. The background noise power can be also entered manually through the GUI (in dBm). The developed tool considers three different sources of attenuation:
Cable: attenuation due to the MV cable itself (in dB/m). If “0,” the mean channel attenuation is calculated using (3) [7], where f is the frequency in MHz and D is the distance in meters. In the current version of the tool, f takes the central value of the frequency band:
Splices: attenuation due to splices, which may represent almost no transmission loss or rather high loss (>10 dB) [5]. In the current version of the tool, if a value is entered for this parameter, a splice is assumed in each node. Couplers: attenuation introduced by the method used to couple the BPL communications equipment with the MV cable. Different coupling methods imply different attenuations [30]. In addition, depending on whether inductive coupling or capacitive coupling is used, changes in the switch state of the MV network may entail signal attenuations up to ±20 dB [5].

If active, Smart Notching is used to mitigate the effects of potential interferences. This mechanism implies a penalization of the
Constellation depends on the selected frequency band and allows choosing the modulation and associated data rate (in bps) calculated based on “13.4 PPDU structure and generation” of the IEEE 1901 [29]. Finally, the payload size allows setting the size of the data. In order to calculate the size of the whole packet at PHY layer (packet_size), 64 bytes of headers is added to the payload size, based on Table 6-2 “General FFT MAC Frame Format” of IEEE 1901 [29]. The size of the PHY layer packet is indeed needed to calculate the transmission time, since the computed data rates are also referred to the PHY layer.
Based on such input parameters, the RTT between each node of the MV-BPL cell and the gateway is computed as follows:
First, the transmission power matrices for the upward communications (i.e., from the nodes to the gateway), Second, the received power matrices for the upward and downward communications ( Next, the background noise power matrix At this point, the SNR matrices for the upward and downward communications (namely, Combining Based on Based on The upward and downward transmission time matrices (namely, The Finally, the RTT between each node of the considered MV-BPL cell and the gateway is an


4. Overview of Obtained Results
The main goal of this section is to illustrate the value that the set of software tools may provide by going through some results obtained using them.
4.1. PRIME Traffic Analysis and Diagnosis Tool
Results from the TTRi analysis are shown in Figure 6. It can be observed that most of the smart meters need the same amount of time to be read (as values are closed to the median). However, outliers are also observed. As a result, based on the histogram of the measured TTR shown in Figure 6, it can be seen that such a random variable may be modeled using an Erlang function (see (9)), where the Maximum Likelihood (ML) estimator of L is 

TTRi versus LNID and histogram.
In terms of MSDU length, Figure 7(a) illustrates the different MSDU length configurations coexisting in the network. These configurations can be clustered in 5 groups with different MSDU length, where most of the smart meters present low values of MSDU length. This proves that manufacturers do not configure the smart meters to the MTU of PRIME (256 bytes), but they establish their own values. Nevertheless, all these values are compliant with the standard, as for being lower than PRIME MTU.

MSDU length and window size corresponding to each node (ordered by its LNID).
The effective window size is represented in Figure 7(b). Similarly to the MSDU length, it also presents 5 different configurations coexisting in the network.
Analyzing the number of different WS/MSDU length configurations, 13 groups are obtained, as shown in Table 4. Comparing groups based on WS/MSDU length configurations in Table 4 with vendors in Table 3, we can conclude that even if these groups do not have a perfect correspondence, this can be due to different firmware versions from either DLMS/COSEM or PRIME firmware layers, as MSDU length depends exclusively on the PRIME layer, whereas the effective WS calculated in this work depends on both PRIME and DLMS/COSEM layers (namely, in a combination of the PRIME flush flag and DLMS/COSEM nsegs, resp.).
Number of different configurations of MSDU length and effective window size in the PRIME network under study.

4.2. PRIME Network Simulation Tool
The validation of the network simulation tool described in Section 3.2 is performed based on a number of simulations carried out taking as a reference a real topology extracted from LINTER. The scenario under study consists of 91 smart meters, 3 of them working as switch (2 with only one node connected to it and 1 with two nodes).
For each one of the simulations, two kinds of parameters are modified: (1) MAC and LLC parameters such as the MSDU length or the sliding WS; and (2) physical parameters such as the attenuation in order to achieve a specific BER between nodes. In addition to this, the communication mode consisting in DBPSK + FEC is used in all nodes, since it is the only one implemented in all devices within the network.
Results are evaluated focusing on the time needed to read all meters (parameter referred to as TTRAll). For this, MSDU length with values
Scenario 1.
Ideal scenario (no transmission errors).
Scenario 2.
Moderate scenario (no transmission errors between meters within the same logical level).
Scenario 3.
Worst case scenario (transmission errors between all nodes).
Simulations are repeated for each combination (MSDU length, WS, Scenario) enough times to be able to compute confidence intervals at 95%. Equation (10) is used in this calculation, where μ stands for the sample mean, σ represents the estimated standard deviation of the sample, and n is the sample size. Consider the following:

In order to illustrate the effects of the considered parameters in the TTRAll, Figure 8 represents the mean of the obtained TTRAll for each specific combination of them.

Analyzing the dependence of the TTRAll with respect to the MSDU length, it can be observed that an increment in MSDU length produces a decrement in TTRAll for Scenario 1 (no transmission errors). This same trend can be observed for Scenario 2. However, in the case of Scenario 3 this trend changes. This can be explained since, in error-free channels, increasing the MSDU length reduces the transmitted overhead, whereas, in channels with errors, increasing the MSDU length also increases the Packet Error Rate (PER), which directly leads to higher latency. For this reason, authors suggest that the MSDU length should be set dynamically depending on channel conditions.
In contrast with previous results, the dependence of the TTRAll with respect to the WS follows the same trend in the three scenarios: an increment in WS produces a reduction in the TTRAll. This is produced since the simulator implements a Simple Rejection Mechanism (as indicated in PRIME specification). With this mechanism, only packets sent after the last acknowledge packet are retransmitted. As a consequence, increasing the WS always leads to a better network performance in terms of latency.
4.3. MV-BPL Cell Simulation Tool
This section aims to illustrate how the MV-BPL cell simulation tool can be used to allow choosing the most appropriate configuration for a new MV-BPL cell deployment while dramatically reducing the time and costs required to make such a decision.
Let one assume that the MV-BPL cell shown in Figure 5(b) is to be deployed and there are no restrictions related to the frequency band of the cell; that is, it can work either in Mode 1 or in Mode 2 (e.g., because there are no adjacent cells deployed). Let one also assume that the background noise has been measured in each of the SSs of the cell and a representative value of the background noise for the whole cell is available (e.g., average value or worst case).
To illustrate how the background noise can affect the optimal design of the cell, the available measurement is assumed to be equal either to the worst case or to the best case specified in the standard. In addition, (3) is used to compute the attenuation related to the cables, whereas the attenuation related to splices and couplers is neglected (if actual measurements were available, they could be easily provided to the tool and considered in the study). It should be also noted that smart notching is not needed (and so disabled) since it is assumed that there are no cells interfering with the new one. A short payload size (32 bytes) and a long payload size (1518 bytes) are also considered to represent traffic associated with teleoperation and AMI data aggregation, respectively.
So the goal of the simulations is to figure out which is the best combination of frequency band and constellation, given a MV-BPL cell and a measured level of background noise. In addition, the RTT between the furthest node of the cell and the gateway is used as the figure of merit of the communications network.
Tables 5 and 6 show the results obtained after simulating all the possible combinations 2000 times. The median of the RTT is chosen as reference as for being more robust against potential outliers than the mean.
Performance results for 32-byte data packets.

Performance results for 1518-byte data packets.
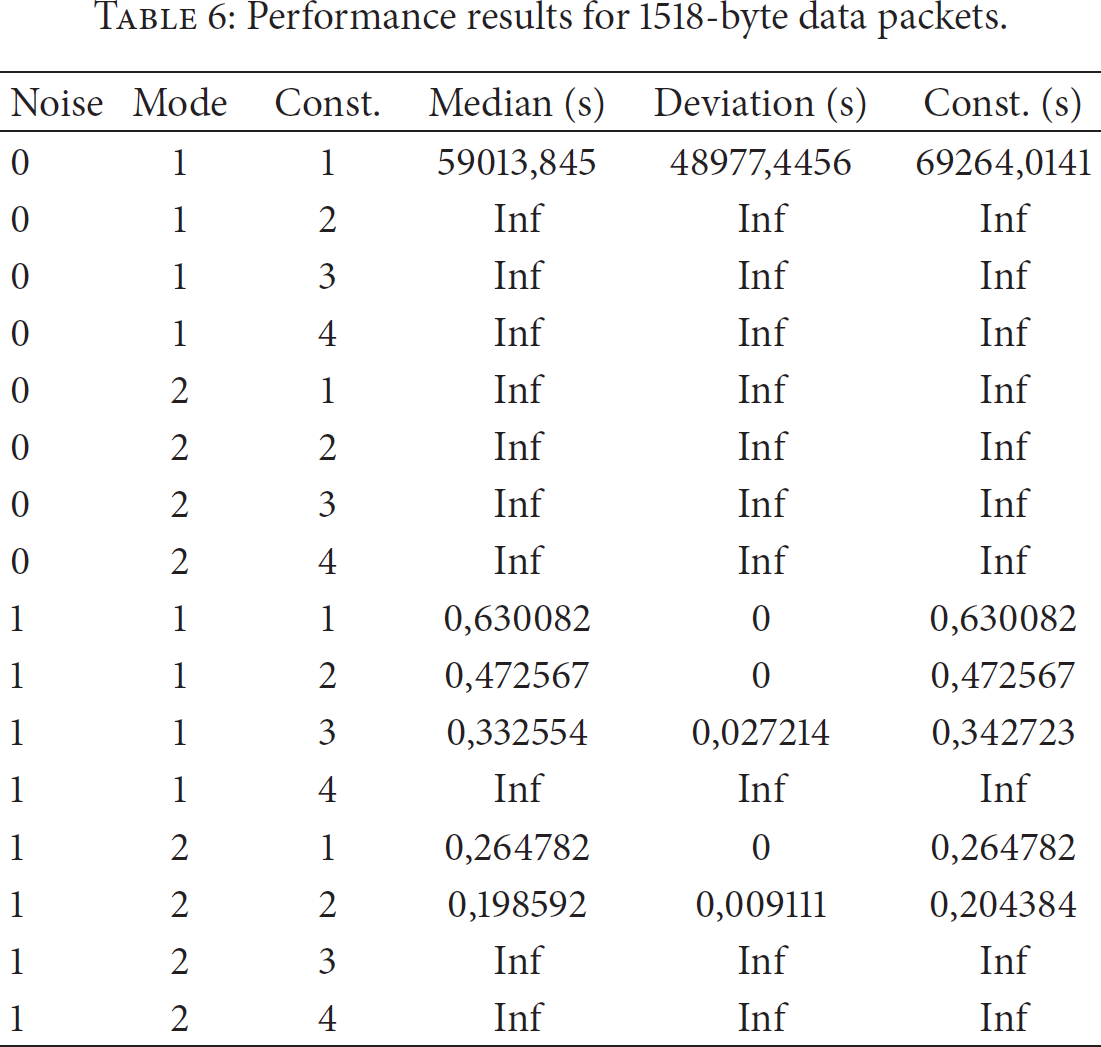
It can be observed that, for the worst level of background noise (“0”), the most conservative configuration (i.e., Mode 1 and 8-QAM) yields the best result (i.e., lowest RTT) in both cases (see Tables 5 and 6). This makes sense since the higher the frequency, the higher the attenuation and thus the lower the SNR (already penalized by the high level of noise) and the higher the BER, so faster constellations may yield worse results due to retransmissions (or they may not even work, as indicated with Inf in Tables 5 and 6). Comparing the results from both tables, it can be also noted that the higher the data payload, the higher the PER, so retransmissions are more likely.
However, for the best level of background noise (“1”), it can be observed that there exists an actual trade-off between all these parameters that make the value of the MV-BPL cell simulator clear. Thus, the best configuration in both cases is now Mode 2 and 16-QAM, instead of Mode 2 and the fastest constellation (4096-QAM), which would be the best configuration if there was no noise.
5. Discussion
Regarding PRIME state of the art, although many devices available in the market (e.g., concentrators, sniffers) allow capturing traffic traces, there is a lack of tools that automatically process them to allow drawing conclusions (as a matter of fact, an important issue that needs to be addressed by the PRIME Alliance is that the format of the traffic traces is not standard, but manufacturer-dependent). However, traffic analysis and diagnosis tools such as the one presented in this paper are of capital importance to DSOs nowadays, since they allow them to identify and solve communications problems they are facing on their day-to-day operation.
Thus, the parameters analyzed in Section 4.1 (i.e., MSDU length and effective WS) can be complemented with PHY parameters, such as SNR, in order to determine, for instance, whether a key device in a PRIME network (e.g., a switch that manages many smart meters) is going down because of the channel conditions or because of firmware issues (it should be noted that in PRIME v1.3 only SNR information related to the uplink of nodes directly connected to the concentrator can by retrieved from the latter; in PRIME v1.4, however, hop-by-hop link-quality information could be retrieved from the trace provided by the concentrator (taking advantage of the new ACK-ed ALIVE mechanism)).
In this regard, the PRIME traffic analysis and diagnosis tool and the PRIME network simulation tool are kind of complementary and can be combined to provide added value to the DSO. Thus, the former can be used to remotely identify a potential problem in an operational PRIME network. Then, the latter can be applied to quickly investigate different solutions and select the most appropriate one, thus dramatically reducing troubleshooting time and associated costs.
In addition, the information gathered by the PRIME traffic analysis and diagnosis tool from actual PRIME networks can be very useful to fine-tune the PRIME network simulation tool. Thus, parameters such as the MSDU length and effective WS can be used to accurately configure the simulation of a real scenario so that the results from the PRIME network simulator can be cross-validated with the results from the field (e.g., based on TTRi). The finding presented in Section 4.1 related to the fact that the TTRi can be modeled using an Erlang distribution is also specially relevant to fine-tune the PRIME network simulator so that its results fit the results from the field more accurately. Thus, the idea of using such a distribution to model those effects that affect PRIME networks that are out of the scope of the PRIME network simulator is currently being investigated.
As a matter of fact, one of the strongest points of the PRIME network simulation tool is that it has been validated in real scenarios. To the best of the authors' knowledge, this approach has barely been addressed in the literature, although it is becoming more and more popular. In [32], an interesting analysis of the available throughput in multihop power lines is conducted. However, no channel noise is added to the transmission, so no errors are modeled in the communication. Additionally, in [33], a method is proposed to abstract the PHY layer from the simulations by means of PER versus SNR curves. However, when computing those curves, a fixed packet length is set, making results not realistic. More recent proposals have also followed a similar approach to the one presented in this paper. One clear example is [34], where an OMNeT++ framework emulating PRIME communications is presented. However, this work does not include an application layer in the protocol stack and merely focuses on error probabilities. This kind of output might be interesting from an electrical engineering point of view, but DSOs are seeking other kinds of parameters, such as the time required to communicate with all devices in a network, which is indeed the parameter the PRIME network simulator presented in the paper is currently focused on.
To close the analysis of the impact of the software tools focused on PRIME networks, an interesting future extension for the PRIME traffic analysis and diagnosis tool is to further develop it to diagnose security attacks [35], which will certainly represent a hot research topic in the coming years.
Regarding MV-BPL cells, one common situation that DSOs have to face when designing communications networks for AMI is to decide whether using MV-BPL up to a gateway equipped with backhaul communications capabilities or an alternative solution (e.g., based on cellular communications) to communicate data concentrators with Meter Data Management System (MDMS). Currently this decision is made based on Cost Benefit Analysis (CBA) with a strong economic component. However, the MV-BPL cell simulation tool may allow seamlessly incorporating technical aspects into such a decision.
Once it is decided to deploy a MV-BPL cell, the design and planning of the cell is not trivial either. Reference [6], for instance, provides guidelines for planning MV-BPL deployments appropriately. However, Section 4.3 illustrates how the MV-BPL cell simulation tool can make such a planning much more flexible and adaptable, dramatically reducing the time required to find optimal configurations.
Regarding related work, to the best of the authors' knowledge there are no similar tools available in the state of the art. Therefore, although the MV-BPL cell simulation tool is still far from being operational, its novelty places it in a privilege position to become a reference tool for the DSOs in the future.
6. Conclusions
This paper provides an overview of PLC technologies, putting special emphasis on PRIME and MV-BPL (i.e., IEEE 1901 Access System specification), and of the most relevant challenges that PLC networks face when being used to monitor and control the power distribution networks of the Smart Grids, presenting also a set of cutting-edge software tools that aim to provide solutions to such challenges.
To be more precise, the paper presents a tool focused on diagnosing problems in operational PRIME networks based on monitoring them and analyzing collected traffic traces. In addition to this, the paper also describes simulation tools for PRIME and MV-BPL networks, whose main goal is to facilitate their planning and performance evaluation.
As it has already been elaborated throughout the paper, authors believe this kind of tools would be of great interest to DSOs since they help in both planning new deployments and troubleshooting existing ones.
Footnotes
Acronyms
Competing Interests
The authors declare that there are no competing interests regarding the publication of this paper.
Acknowledgments
The research leading to these results has been partly funded by the Spanish Ministry of Economy and Competitiveness through the Projects OSIRIS (RTC-2014-1556-3) and REDYD-2050 (ENE2015-70032-REDT).