
Abstract
The study of human crowd density estimation (H-CDE) using radio frequency is limited due to the nature of wireless medium and the advancement of visual-based systems. There were two statistical methods, namely, One-Way Analysis of Variance and Design of Experiment applied in designing the H-CDE system. One-Way Analysis of Variance is used to investigate the difference in signal attenuation between dynamic and static crowds. The Design of Experiment is utilized to identify significant crowd properties that affect wireless signal propagation. The significant factors were later trained into the H-CDE algorithm for the purpose of estimating the human crowd density in a defined sector. A sector comprising three placements of 2.4 GHz ZigBee wireless nodes continuously reported the received signal strength indicator to the main node. The results showed that the H-CDE system was 75.00% and 70.83% accurate in detecting the low and medium human crowd density, respectively. A signal path loss propagation model was also proposed to assist in predicting the human crowd density. The human crowd properties verified by using the statistical approach may offer a new side of understanding and estimating the human crowd density.
1. Introduction
Monitoring and estimating human crowd density using radio frequency (RF) is a field of largely unexplored study due to problems related to the unpredictable wireless medium, improvement of visual-based systems, and the nature of human bodies in wireless medium. Crowd density estimation (CDE) has correlation to the topic of localization due to its technical similarity.
The RF-based localization is the process of estimating the position and movement of a node within a network using various mathematical techniques and algorithms [1, 2]. The localization is able to perform location sensing [3, 4], target tracking [5], or both features at the same time [6–8]. The importance of node localization can be derived from relevant applications ranging from target tracing to safety monitoring.
Crowd control and monitoring are imperative to reduce accidents. A catalogue of crowd-related disasters during Hajj pilgrimage proves that the current systems are still insufficient to cater for the ever-increasing number of pilgrims. The latest mishap during the Hajj pilgrimage killed more than 700 people at Mina [9], despite billions of dollars spent by the Saudi Arabia government on improving the infrastructures. This further stresses the importance of human crowd monitoring to address the issue of safety and disaster prevention.
(1) Human Crowd Density Estimation. Table 1 shows the previous works on RF-based H-CDE. There are two types of techniques that can be implemented in estimating a crowd size which are participatory (device-handling) and nonparticipatory (device-free). The participatory method generally depends on people counting by distributing tags (or devices) to their subjects and detecting them using portable or fixed readers. However, there is an issue of true scalability due to the requirement of dedicated involvement of participants.
Related works on the RF-based H-CDE systems.

Nonparticipatory is a parameter-based estimation where data such as the received signal strength indicator (RSSI) obtained between the transmitter and receiver (T-R) is analyzed. This approach is opted for in this study as it allows better scalability and easier deployment. The implementation of statistical methods may also contribute to the current body of knowledge on H-CDE. The ZigBee chipset with whip antenna was selected as it fits the requirement of the design of a portable, low-powered, and low data rate system.
(2) Human Crowd Properties on Signal Attenuation. Understanding human crowd features such as crowd spread of people, movement, and size provides an insight into the signal fluctuation caused by bodily obstructions. The effects of human crowd distribution and velocity on the signal attenuation have been studied by Xi et al. [15] and Arai et al. [18]. However, these effects can be further investigated to better understand the signal loss caused by different crowd properties and their correlations between one another. Another signal attenuation factor of interest in the WSN deployment is the number of tags. The tags are portable nodes carried by selected agents within the crowd that may register different signal reading based on different spatial obstruction. This effect is also investigated in this study.
Crowd dynamic itself is a complex topic [19] as human beings are proven to be moving based on the projected time to potential future collision instead of using the physical distance between each other [20]. As such, removing the crowd dynamic as a factor would reduce the overall complexity of the statistical analysis, and this attempt is discussed in Section 2.1.
(3) Design of Experiment. Design of Experiment (DOE) is a statistical method that brings several benefits when applied to scientific problems. The benefits are listed below [21, 22]:
A DOE corrects experimental framework. It ensures that the procedure and setup of the experiment are statistically correct before any measurement is made. For example, DOE implements randomness and repetition which addresses the issue of biasness. The DOE validates the findings of the proposed model and the results. It can be used as a validation mechanism when the proposed solution has no equivalent comparison in the literature or from modelling simulation. It allows the verification of all interactions between parameters involved and the degree of their significance. This solves the problem of “one-factor-at-a-time experiments” which is the incomplete conclusion that resulted from the effect of a single parameter measured one at a time.
The objective of this paper is to identify and discuss the significant factors affecting the signal propagation in human crowded vicinity by using statistical methods which are the DOE and One-Way Analysis of Variance (ANOVA). Once the effect of human crowd is understood, the information is integrated into the H-CDE system for classification and modelling.
2. Design and Experimental Framework
2.1. One-Way Analysis of Variance: Eliminating Human Crowd Dynamics
The aim of this step is to remove human crowd movement as a factor in the DOE test studied in Section 2.2 so that the complexity of this study can be reduced. This is done by using One-Way ANOVA to determine whether the static and dynamic crowds (human walking speed) possess similar statistical effects on the signal attenuation. The hypotheses are given as

Figure 1 shows the layout of the experiment where the people and tag handlers stay immobile or move to and fro within the boundaries set. The walking speed was assumed to be around 1.2 m/s [18]. The mechanism for collecting the RSSI from the tags would be similar to the one in the DOE experiment, which will be later explained in Section 2.3.1. The analysis was conducted by using Minitab 16.2.3 software with 5% Tukey's family error rate.

The experimental setup where (a) all elements are static, (b) only the human crowd is moving to and fro within the stipulated area, and (c) both the tag agents and human crowd are moving.
2.2. Design of Experiment: Identifying Significant Factors
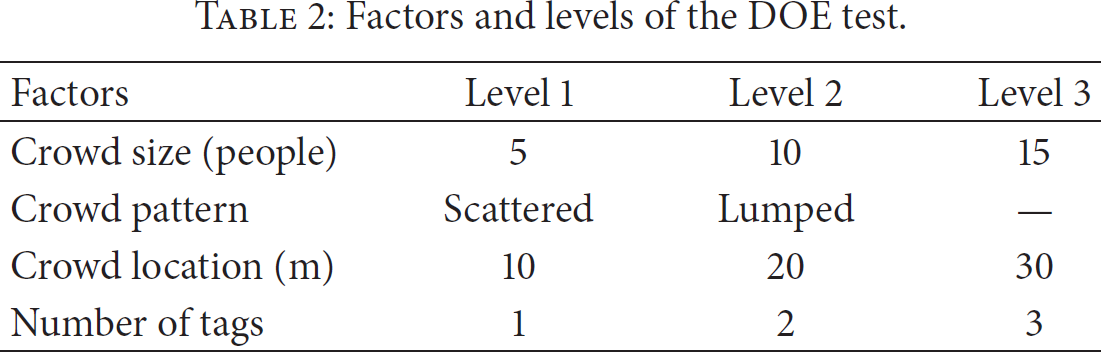
The objective of the DOE test is to identify the crowd properties that have significant effects on the signal attenuation. These effects would influence the H-CDE system and algorithm in Sections 2.3 and 2.4, respectively. The list of factors and their respective levels are tabulated in Table 2 while the arrangement of the DOE is illustrated in Figure 2. The number of people in a crowd is including the tag handlers while the crowd pattern is based on the people crowd density in an area of 1 m2 test. The DOE full factorial template was generated by using Minitab software with two repetitions for a total of 108 experiments and 1080 measurements.
Factors and levels of the DOE test.

Experimental setup of the DOE. The crowd distance is measured from the coordinator while the tag agents are always placed behind the main crowd.
2.3. System Setup for Real-Time Experimentation
2.3.1. Developed Design of Experiment
The coordinator's Application Program Interface (API) collected the RSSI information by using specified ZigBee command programed at the microcontroller. The command issued to each tag and router triggered the nodes to reply with the RSSI of the last hop. The RSSI from tags 1, 2, and 3 and router 1 were collected sequentially with a time delay of 4 s between each sequence to allow for any retransmission to be completed. The average RSSI was calculated from 5 measurements collected from each transmission session. The RSSI from router 1 was used to train the H-CDE system and algorithm in Sections 2.3.2 and 2.4, respectively.
The block diagram of the prototype tag is shown in Figure 3. Each of the H-CDE tags is powered by a 1 W solar cell with a 2000 mAh lithium ion polymer battery as the storage element. The energy harvesting capability and Secure Digital (SD) card-based data logger are available on the tag which are features that have been used in a previous work [23].

The block diagram of the H-CDE tags.
The coordinator and router 1 nodes are made of Arduino and breakout boards connected to laptops. The transmission circuits were set to the maximum power level of 4 with enabled boost mode while the rest was kept on default settings. The RSSI data collected by the coordinator was then forwarded to the H-CDE algorithm for human crowd classification. The tags were attached to the chest of the human body; in a similar way a name tag is worn. The tags were approximately 1.24, 1.33, and 1.40 m above the ground while the coordinator and router 1 were placed 1 m above the ground.
2.3.2. Human Crowd Density Estimation System
A moving node presents a challenging problem for the H-CDE as the node may shift its position arbitrarily in any direction in the future, rendering the instantaneous estimation largely inaccurate. A practical solution to this problem is to fix the behaviour of the tag by setting a predetermined path of its movement or by assigning the tag as a static anchor. The latter approach is implemented in the H-CDE system.
The H-CDE system utilizes three tags anchored within a defined sector as shown in Figure 4. For a complete coverage of the Mataf, 15 sectors are required. The optional tags could be placed to enhance the human crowd density estimation and localization. However, they can cause disruptions to the crowd flow and safety, and thus they are not implemented in this study. The tags are placed 35 m away from the coordinator and the RSSI of the three tags are collected continuously within 1.5 s for every 5 s. The buffer zone is a crowd-free zone that represents the half cross section of the Kaabah.

Proposed tags arrangement for the H-CDE system.
2.3.3. The Scope and Limitations of the Human Crowd Density Research
Modelling an individual body attenuation factor was not pursued as it is assumed that different body parts and body size absorb almost the same amount of energy [15, 17, 18]. The average height and mass of the people forming the crowd are 163.20 cm and 66.28 kg, respectively, and they are pure Asian. The Mataf, the circumambulation and open-air area around Kaabah in Makkah (Mecca) for the Tawaf ritual during Hajj pilgrimage, is a popular target for extreme CDE using simulations [24, 25]. The coverage area of this study was based on a portion of the internal ground level of the New Mataf Extension Project, which covered an area of 70 m diameter. The experiments were conducted outdoors to minimize the RF interference, avoid the complex multipath propagation experienced indoors, and allow the operation of the energy harvesting feature on the tags. The size of the crowd was limited to 15 people based on the sensitivity level of the RF module used and the “always connected” requirement of the statistical analysis. Although guidelines had been given to the participants of the experiments, the freedom of natural human traits such as slight free movements, approximation of proximity, and comfortable standing stance were allowed to imitate the actual human behaviours. Multihop feature was disabled.
2.4. Human Crowd Density Estimation Algorithm
The H-CDE algorithm fed the RSSI data obtained from three tags which were then compared with the DOE main and interaction effects produced from Section 2.2. The concept of the algorithm is shown in Figure 5. The average RSSI was calculated based on the recorded information of all tags and classified into three crowd density categories which are low, medium, and high.

Block diagram of the H-CDE algorithm.
The crowd density classification is given as follows:
Low density (LD):
Medium density (MD):
High density (HD):
where
In addition, the signal path loss propagation model is a useful method for supplementary crowd prediction. The empirical model is given as

3. Results and Discussion
3.1. One-Way Analysis of Variance
Table 3 shows three important pieces of information which are the p value (p), standard deviation (S), and R-squared (R-Sq). As the p value of 0.596 is greater than α (0.05), thus the null hypothesis is not rejected since the differences between the means are not significantly different. The standard deviation is mediocrely high at 7.973 dBm due to the unpredictable and fluctuating signal attenuation caused by the human crowd. The value of R-squared at 8.27% is extremely low indicating that the effect of crowd on signal attenuation cannot be estimated from a specific equation formed by the Minitab software. This assumption is considered true based on the usage of three tags instead of one that contribute to different sets of the RSSI, thus making a single equation-fitting unfeasible.
One-Way ANOVA results from Minitab where the bolded terms highlight the most relevant information of p, S, and R-squared values.

The close values of mean shown in Figure 6 strengthen the assumption that the mean of the three cases is statistically nondifferent. DTD has the lowest mean as the signals from the tags could propagate better between people as a result of the posture and extraspatial requirement of a moving person. S has the highest mean as the signals from the nodes are relatively less fluctuated due to the fixed positions of the tags and human crowd.

Individual value plot of static human crowd and tags (S), dynamic human crowd and static tags (DTS), and dynamic human crowd and tags (DTD).
As a summary from Table 3 and Figure 6, the signal attenuation caused by the effect of moving and stationary tags and human crowd is statistically the same. Thus, the influences of the mobile tag and human crowd can be removed as the factors in the DOE test, therefore effectively reducing the number of factors from seven to four.
3.2. Design of Experiment Analysis
Figure 7 shows three sources which have significant effects on the signal attenuation. The effects are denoted by having p value less than or equal to α (0.05). The main effect is the human crowd size (A), and the interaction effects are crowd size ∗ number of tags (

The p value from the analysis of variance for RSSI (average) using adjusted sum of squares for tests.

Second iteration of ANOVA for the RSSI (average) using adjusted sum of squares for tests.
Figure 9(a) indicates that as the number of the tags increases to two and three, the RSSI values become smaller provided that the crowd size is between 10 and 15 people. Figure 9(b) shows that, on average, a lumped human crowd pattern inflicts 2.57 dBm more signal loss than the scattered pattern. The difference between them is denoted by
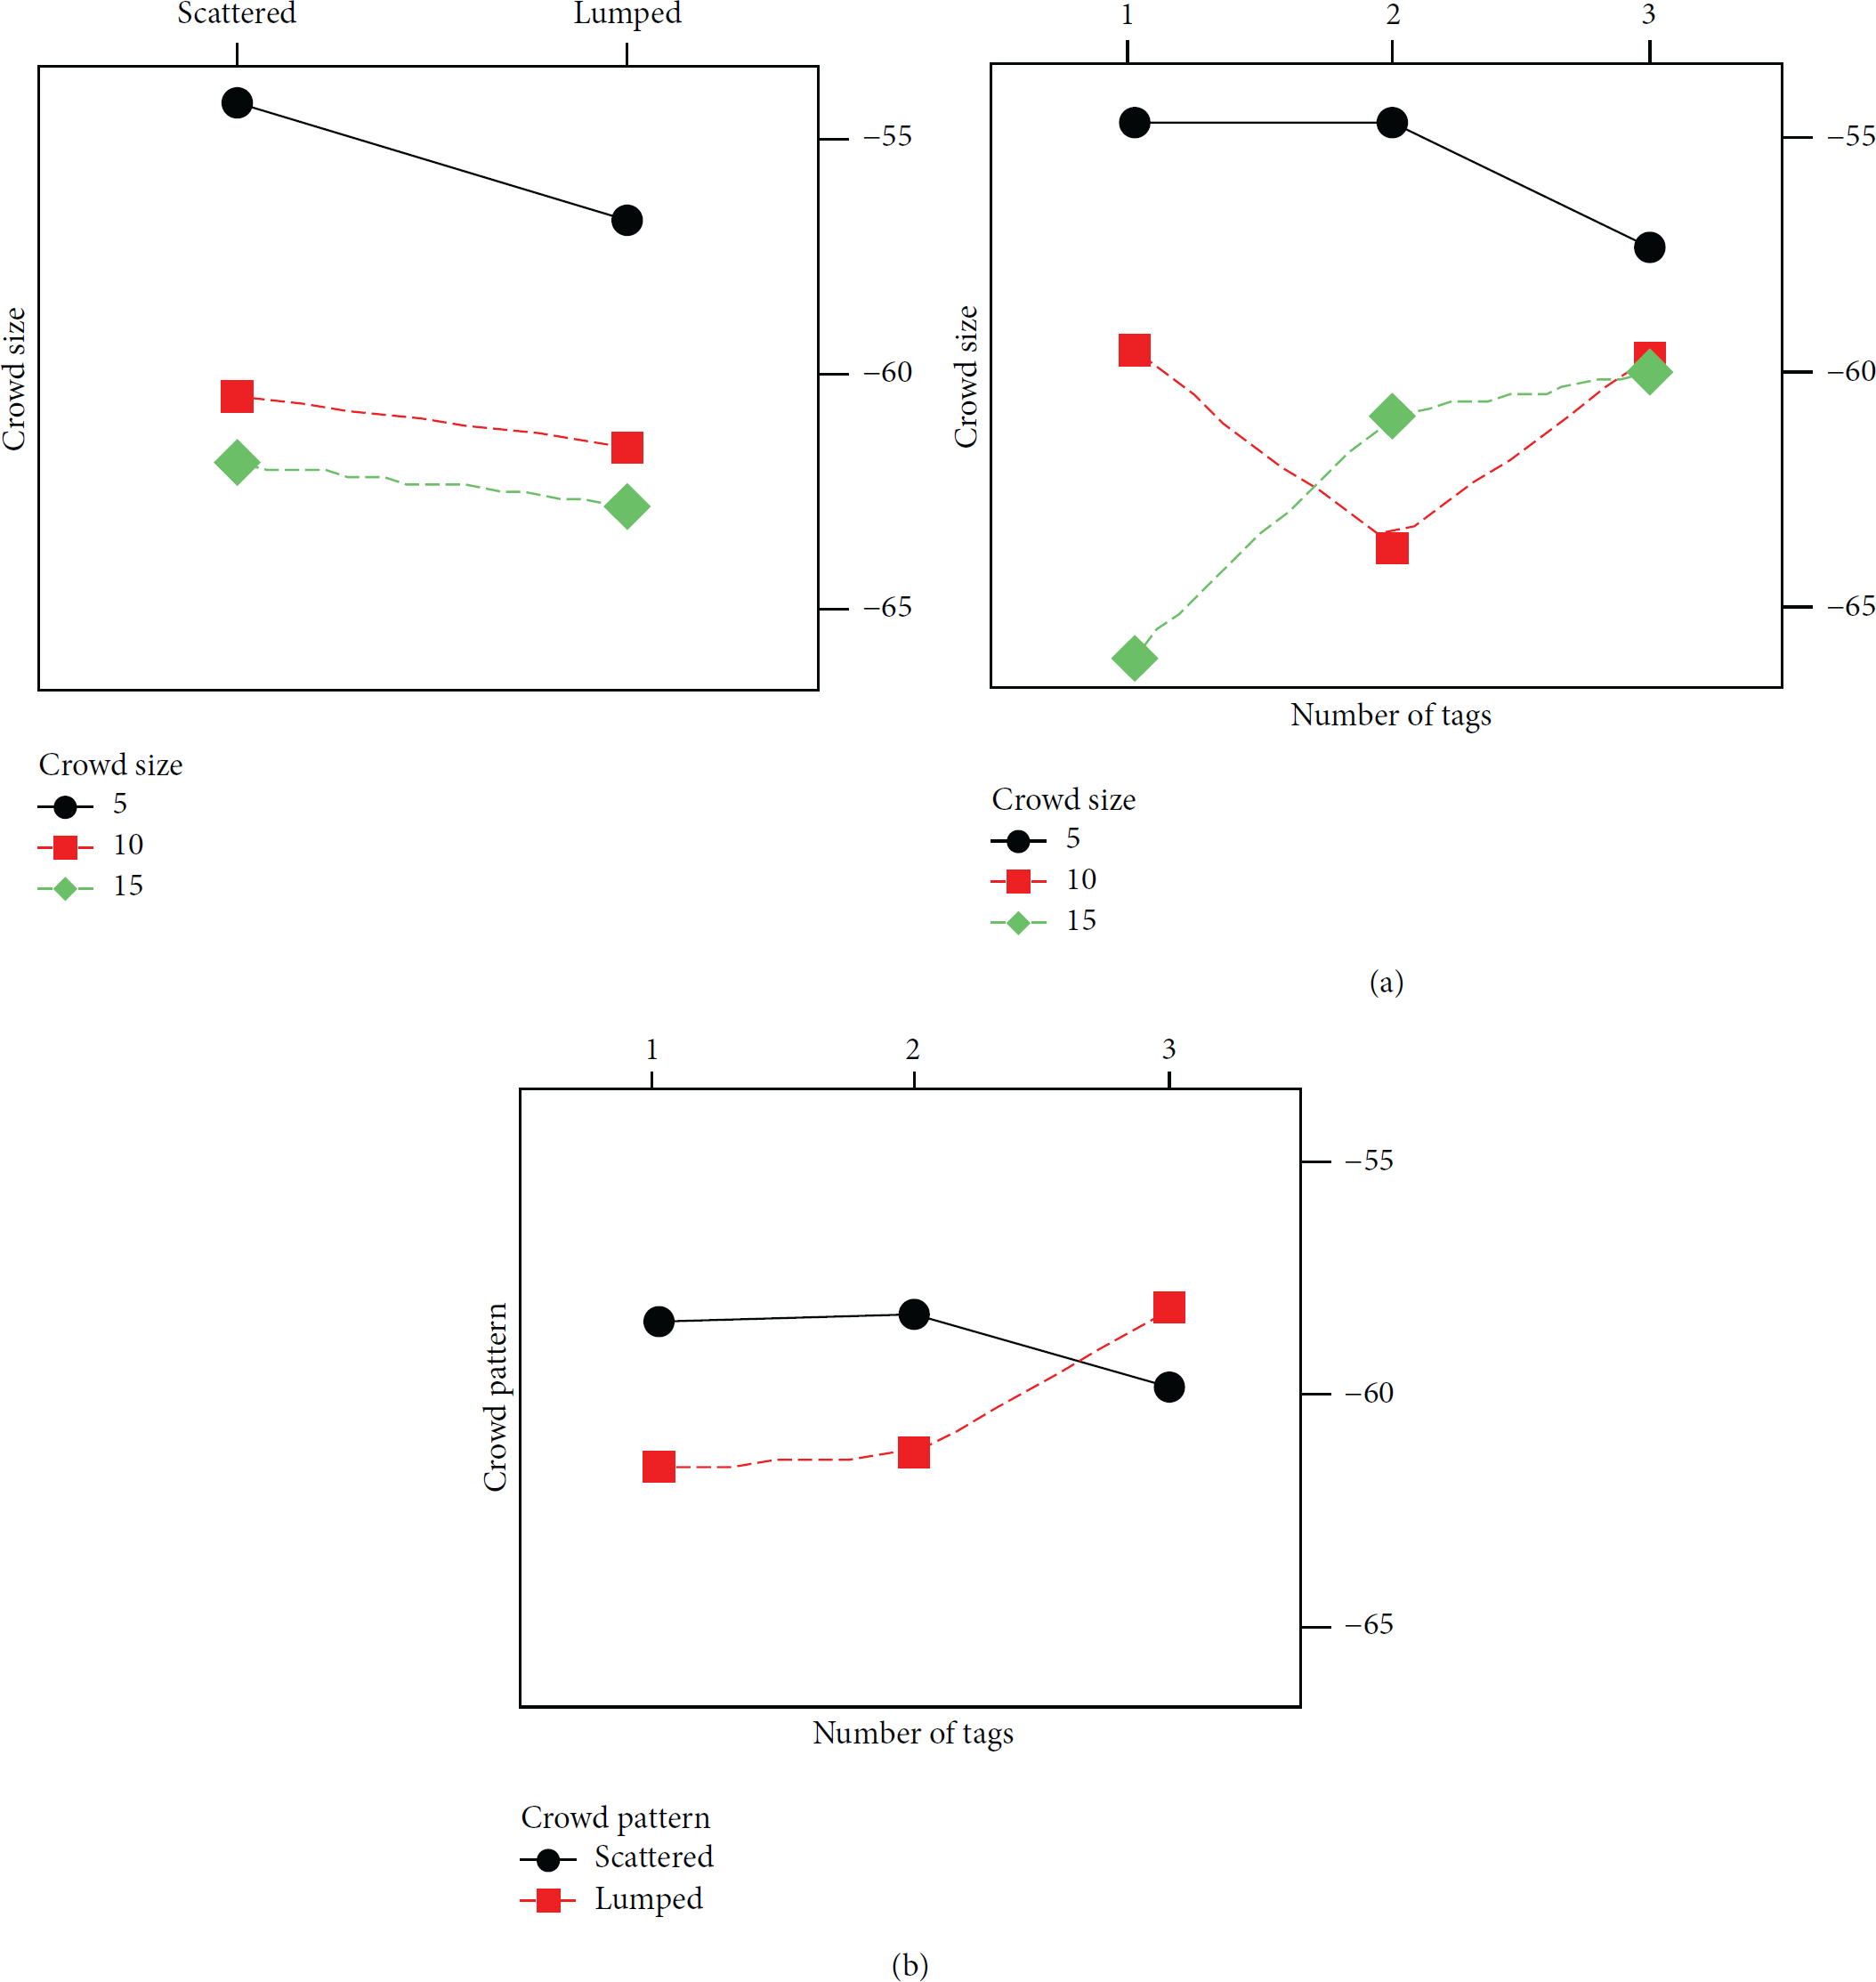
Interaction plot for the RSSI in dBm. (a) A combination of the human crowd size and number of tags and (b) a combination of the human crowd pattern with number of tags.
As a summary, the strongest factor affecting the signal propagation is the human crowd size while two of the strongest interactions are the combinations of human crowd size and crowd pattern with the number of tags. Using higher number of tags allows enhancement in the RSSI measurement due to the variation of the human crowd obstructions.
3.3. Human Crowd Density Estimation Classifications
The DOE data fitted into the H-CDE algorithm is shown in Figure 10. The classification has yielded 75.00% and 70.83% estimation accuracy for LD and MD, respectively. MD has lower estimation accuracy as a number of predictions were wrongly classified as LD, which can be attributed to the irregular gaps between the bodily obstructions, allowing the T-R signal to propagate better.
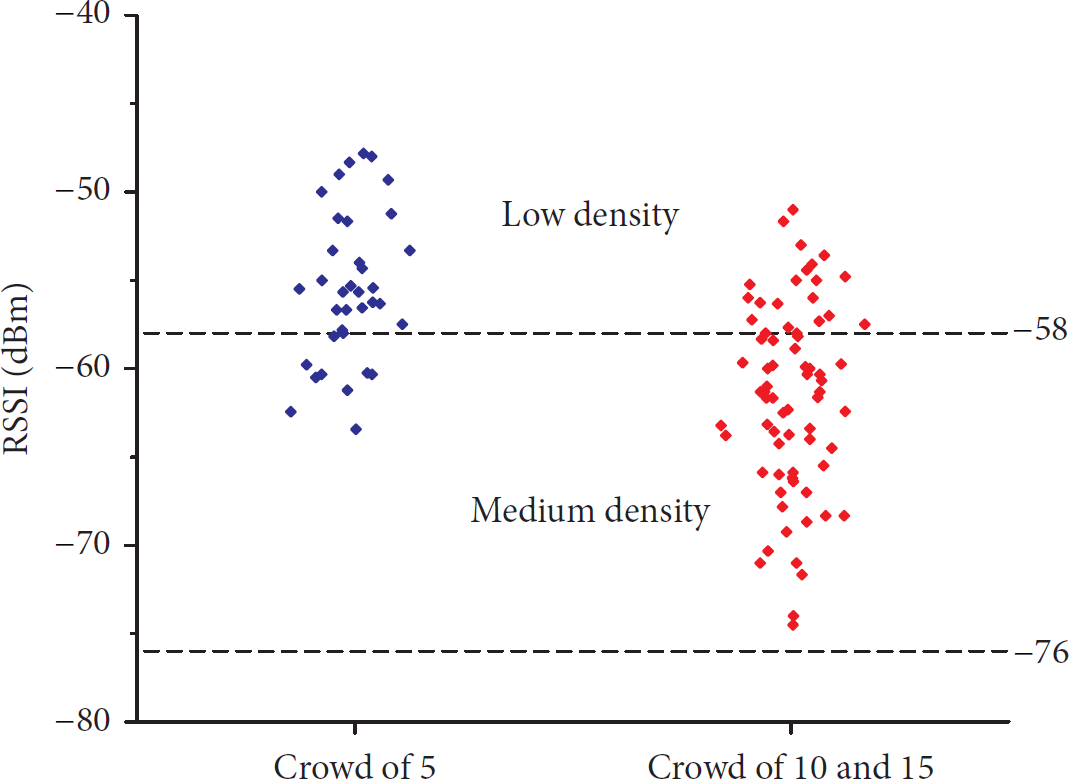
Classifying the density of the experimental data where each rhombus represents the average of 10 RSSI measurements.
From (2), the signal path loss propagation model is fitted as

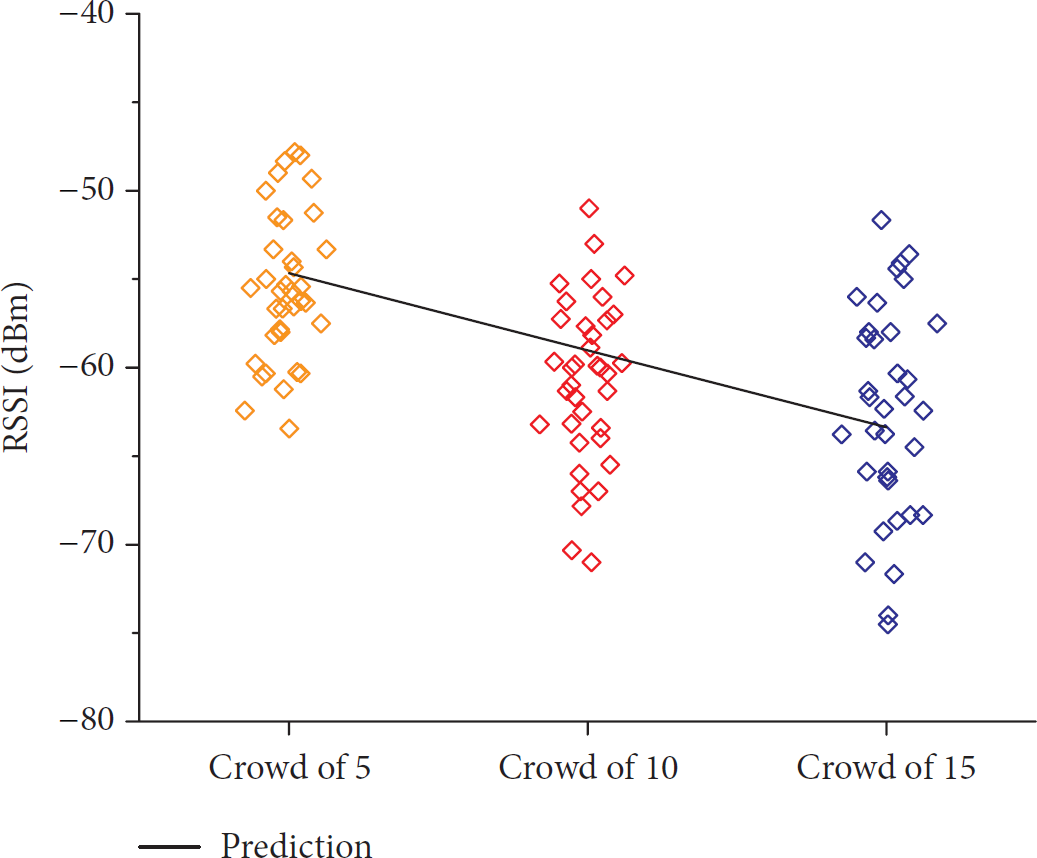
Comparison between the prediction model with the RSSI of different crowd size. Each rhombus represents the average of 10 RSSI measurements.
The empirical model has two assumptions to address its limitations. First, the model assumes that the highest signal loss is at the torso region [27, 28]. Secondly, it is assumed that the most dominant transmitted signal would be from the direct rays reflected, refracted, and diffused from the human body.
4. Conclusion
The One-Way ANOVA test has proven that the dynamic and static crowds statistically incur the same mean of the signal attenuation. The DOE test has identified the human crowd size as the main factor influencing the signal attenuation in the human crowds. It also has recognized two significant interaction effects which are the number of tags in combination with the human crowd size and crowd pattern. The findings of the DOE test used to train the H-CDE system enable the classification of the human crowd density into low, mediocre, or high category. The results of the DOE test fitted into the signal path loss propagation model ease the prediction of the human crowd density and potential simulation. Therefore, the human crowd properties which are verified by using the statistical approach are capable of creating a new approach in understanding and estimating the human crowd density especially for safety monitoring purposes.
Footnotes
Conflict of Interests
The authors declare that there is no conflict of interests regarding the publication of this paper.
Acknowledgments
The authors would like to thank the funding sources for this work, which are Universiti Sains Malaysia and Malaysia Ministry of Higher Education Grant Secretariat for sponsoring the research under FRGS Grant 6071306.