
Abstract
Energy-efficient data aggregation is important for underwater acoustic sensor networks due to its energy constrained character. In this paper, we propose a kind of energy-efficient data aggregation scheme to reduce communication cost and to prolong network lifetime based on distributed compressed sensing theory. First, we introduce a distributed compressed sensing model for a cluster-based underwater acoustic sensor network in which spatial and temporal correlations are both considered. Second, two schemes, namely, BUTM-DCS (block upper triangular matrix DCS) and BDM-DCS (block diagonal matrix DCS), are proposed based on the design of observation matrix with strictly restricted isometric property. Both schemes take multihop underwater acoustic communication cost into account. Finally, a distributed compressed sensing reconstruction algorithm, DCS-SOMP (Simultaneous Orthogonal Matching Pursuit for DCS), is adopted to recover raw sensor readings at the fusion center. We performed simulation experiments on both the synthesized and real sensor readings. The results demonstrate that the new data aggregation schemes can reduce energy cost by more than 95 percent compared with conventional data aggregation schemes when the cluster number is 20.
1. Introduction
Underwater acoustic sensor networks typically include a number of static sensor nodes or vehicles that are deployed over a region of interest to monitor a physical phenomenon. The applications of such networks include oceanographic data collection (e.g., temperature, salinity, and zonal), field monitoring, and disaster prevention [1, 2]. In these monitoring networks, sensor nodes collect readings periodically and transmit them to the data sink. There are three main challenges for the successful function of such networks. First, monitoring sensor networks are typically composed of hundreds to thousands of sensor nodes, which generate a tremendous amount of sensor readings that need to be delivered to data sink. Second, data transmissions are generally accomplished through multihop routing from individual sensor nodes to the data sink due to the limited transmission ability of sensor nodes. Third, compared to terrestrial sensor networks, more transmission power for sensor node is required although battery power is severely limited in underwater acoustic networks. Data aggregation is one of the major research topics for wireless sensor networks due to its promising effect in reducing data traffic and it is particularly important to build an energy-efficient data aggregation scheme which aims to significantly reduce the amount of data that must be transported by underwater acoustic sensor networks.
One kind of energy-efficient framework is a cluster-based underwater acoustic sensor network (CUASN). In this framework, several adjacent sensor nodes make up a cluster and one of the sensor nodes is selected as the cluster head using a cluster head selection algorithm. The cluster heads accomplish data transmissions through multihop routing after they gather sensor readings in their own clusters. Here, we consider a CUASN built on a spatial-temporal field, where sensor nodes are anchored to the bottom of the ocean and organized in a clustering architecture. First, each sensor node transmits its observations of the field to its cluster head, and then the cluster head transmits sensor readings from its cluster to a central node, referred to as the fusion center (FC). Finally, the FC reconstructs the map of the physical field [2]. To prolong the CUASN lifetime without information loss of observed field, we address the following concerns: how to gather and transmit less data and how to reconstruct the resource data from limited transmitted data.
A recently developed signal processing technique, compressed sensing (CS), promises to deliver a full recovery of signals with high probability from far fewer samples than their original dimension as long as the signals are sparse or compressible in some domains [3]. Distributed compressed sensing (DCS) is an extension of CS to the multiple-signal case [4, 5]. In sensor networks, a large number of sensor nodes are spatially distributed over a region of interest. In continuous monitoring applications, sensors report their readings in short intervals. Therefore, the signals they acquire contain both intersignal (spatial) and intrasignal (temporal) correlations, which were exploited by DCS through the concept of joint sparsity as only a few measurements from a jointly sparse signal ensemble contain enough information for reconstruction. From this perspective, DCS is well-suited for data aggregation in sensor network due to its reduced communication costs.
The paper presents an energy-efficient aggregation scheme based on DCS for CUASN. We aim to minimize the total energy consumption while collecting data. The main contributions of this paper can be summarized as follows.
We develop a joint reconstruction model highly consistent with JSM-2 for CUASN. Compared with conventional JSM-2, the model organizes sensor readings from different positions and the same moment as one data group. There are different data groups for different moments and it is easier to get real-time physical phenomenon for the monitoring tasks. We have proposed a kind of data aggregation scheme based on the observation matrix design. The new schemes take multihop underwater acoustic communication cost into account. We have attained a solution that differs from that of a terrestrial cluster-based sensor network, in which there is an optimal value near the cluster number for minimum energy cost. The energy cost increased as cluster size increased despite the decrease in transmission number.
The rest of this paper is organized as follows. Section 2 presents related work on data aggregation in sensor networks. In Section 3, we briefly introduce DCS-based network model used for data aggregation. In Section 4, we describe the new data aggregation scheme, including observation matrix generation and distributed reconstruction algorithm. Section 5 addresses the performance of observation matrix. Section 6 presents evaluation results using synthetic and real field datasets. Finally, Section 7 summarizes this paper.
2. Related Work
Early literature [6] studied how to reduce energy consumption in large-scale sensor networks from an optimal hierarchical organization of sensors in which cluster-based structure is a kind of energy-efficient structure for wireless sensor networks. Reference [7] reviewed the development of data aggregation systematically and introduced a cluster-based approach which mainly focused on local aggregation and processing. Similarly, [8] proposed a cluster-based method for data gathering and compressing, in which the data gathered by the sensors was transmitted to the data processing center through a hierarchy of cluster heads that employed wavelet decomposition to build wavelet coefficients of the data. Similarly, [9] proposed a cluster-based data aggregation technique which involved formation of clusters, election of cluster heads, and data transmission to the sink node for an underwater acoustic sensor network.
The cluster-based structure reduces communication cost by shortening communication distance. In one approach, CS, a data compression technique, is applied in compressive data gathering to reduce energy consumption by decreasing the overall communication load for sensor network [2, 10–17]. Reference [2] proposed a distributed energy-efficient sensor network scheme that relied on Random Access Compressed Sensing (RACS). The proposed scheme was suitable for long-term deployment of large underwater networks in which energy and bandwidth minimization is crucial. The authors of [11] investigated how to generate restricted isometric property while preserving measurements of sensor readings by accounting for multihop communication cost. Reference [13] minimized the number of information sensors by applying CS principles. Missing information due to packet loss could be efficiently recovered using matrix completion theory. Reference [16] proposed an algorithm to gather sensory data based on sensor neighborhoods within networks to minimize energy costs.
CS focuses on the redundancy of single signals. As DCS reduces the redundancy among signal groups from both inter- and intrasignal correlations, a lower quantity of data must be transmitted, reducing energy costs. References [18–21] proposed different DCS-based data gathering strategies for wireless sensor networks. Reference [18] presented a DCS-based data aggregation model and algorithm to reduce the number of transmissions in sensor networks and improve the precision of sensing. To implement this algorithm, the variance of each recover sensing sequence of sensors was estimated using the wavelet transform, and the optimum weighing factor for each sensing was obtained accordingly. Reference [19] applied CS to reduce the transmission data and to lower the entire power consumption for Body Area Networks. Reference [20] presented a centralized algorithm running within the sink of the wireless sensor network to obtain a distributed wavelet basis. On the basis of this algorithm, Wavelet Transform-based Distributed Compressed Sensing (WTDCS) algorithm was proposed to compress and reconstruct sensor observations with spatial correlations.
This body of work shows the widespread application of CS and DCS for terrestrial wireless networks, but not in underwater acoustic sensor networks [2, 9]. Compared with a terrestrial wireless network, the deployment of sensor nodes is sparser and there are fewer nodes in a cluster for underwater acoustic sensor network; thus the spatial correlation is weakened. It is impossible to directly apply the same method as the one developed for a terrestrial wireless network due to the difficulty of finding a transfer basis that can represent sensor readings sparsely. Instead, we propose a global scheme in which the compression is implemented at the cluster heads and reconstruction is achieved by FC. The communication cost is much larger than the cost of receiving and being silent in a sensor node, which decreases the distance between two hops. It is obvious that more hops are needed in order to collect compressive sensor readings for FC and more energy will be required than what is consumed for this process in terrestrial wireless network. In order to save communication energy, the scheme proposed in this paper requires that compressed data collected by FC contains only partial information from sensor readings. Using simulation, we show that the reconstructive precision is equivalent to that obtained using a strategy in which all the sensor reading data is sent as compressed data.
3. Distributed Compressed Sensing Model
A grid network is deployed to monitor a physical phenomenon (e.g., temperature, pressure, and current) over a long period of time, as shown in Figure 1. This kind of long-term monitoring is crucial in climate monitoring or environmental surveillance applications. The network consists of

Sensor network for monitoring a physical phenomenon.
These sensor nodes are denoted as
At sampling time
In [4], three joint sparse models for different applications are defined in the context of wireless sensor networks. We use JSM-2 as our distributed compressing model. In this model, all signals are constructed from the same sparse set of basis vectors but with different coefficient values. In this paper, we can denote this as


There is no difference between the process described above and CS. However, as the sensor readings at a sensor node are generally recorded at short intervals, temporal correlation exists between the elements of vectors

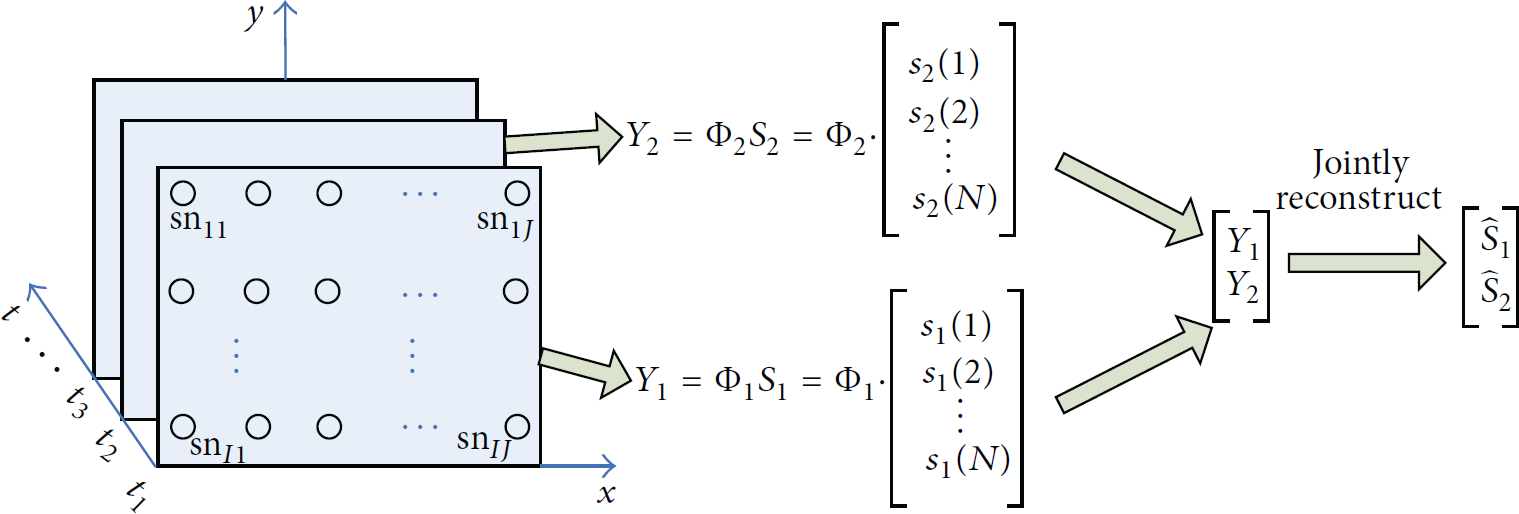
Joint reconstruction model.
In the theory of CS or DCS, the recovery of S from significantly fewer measurements than Y may be accomplished by solving

4. Data Aggregation Scheme
4.1. Design of Observation Matrix
The traditional cluster sampling and transmission system is shown in Figure 3. Each cluster head collects data sensed by sensor nodes within their own cluster, which can be set to be

Traditional cluster sampling and transmission.
Cluster sampling and transmission system based on CS theory aims to receive M observed values that are much smaller than sensor nodes N in FC. These observed values include original data information sensed by all sensor nodes. To achieve this goal, we produce a

After the collection of the original sensing data within clustering by cluster head

Full random observation matrix.
The quantity of data produced by communication among all sensor nodes within each cluster and cluster heads is
Assume that the observation matrix in FC is a block diagonal random Gaussian matrix

After the collection of the original sensing data within clustering by cluster head

Block diagonal observation matrix.
The quantity of data produced by communication among all sensor nodes within each cluster and cluster heads is
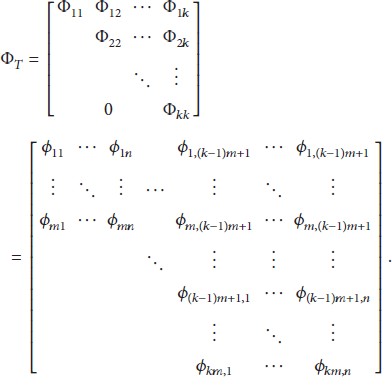
As shown in Figure 6, after the current cluster head
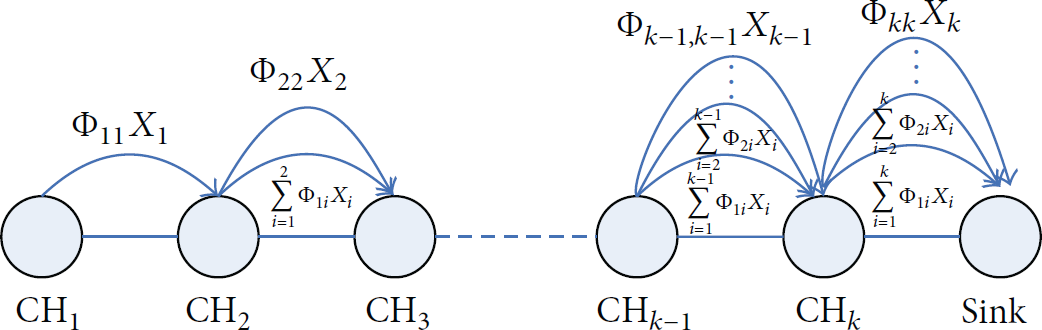
Block upper triangular observation matrix.
For convenience, we refer to this scheme with the block diagonal observation matrix as BDM-DCS and the scheme with the block upper triangular observation matrix as BUTM-DCS. To compare the performance of this model with the DCS and CS models, the CS scheme with block diagonal observation matrix was designated BDM-CS and the CS scheme with block upper triangular observation matrix is referred to as BUTM-CS. We used simulations to compare the four schemes with hybrid CS.
4.2. Joint Reconstruction Algorithm
In [4], DCS-SOMP is used for the JSM-2 signal ensemble model. Here, we used DCS-SOMP as our reconstruction algorithm. The algorithm is described as follows.
Initialization: set the iteration counter Select the dictionary vector that maximizes the sum of magnitudes of the projections for the residual, and add its index to the set of selected indices
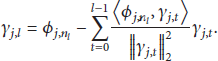
Orthogonalize the selected basis vector against the orthogonalized set of previously selected dictionary vectors
Iteration: update the estimation of the coefficients for the selected vector and residuals
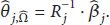
Check convergence: if Deorthogonalization: apply where


5. Demonstration of RIP for Observation Matrix
The key of original signal reconstruction via FC depends on whether the observation matrix can meet the property of RIP. Literature [28] has shown that full random Gaussian matrix

In order to illuminate the property of block diagonal random Gaussian matrix
A previous report showed [29] that there exists


These are equivalent to

For block diagonal matrix

At the same time, each block matrix

Similarly, we can solve

That is, the probability of satisfying the following formula is greater than

From the above formulas, we can conclude that, corresponding to sensor network, the RIP property of block diagonal random Gaussian matrix is better when m increases and k decreases. The more the observed values of each clustering, the less the transitive jumps that will arrive at the sink, and there is increased likelihood of implementing the reconstruction.
Take the columns of the block upper triangular random Gaussian matrix


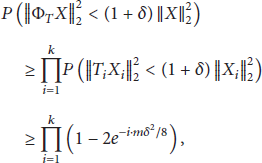


Table 1 shows the probability that RIP character is satisfied under different δ values.
The probability that RIP character is satisfied under different δ values.
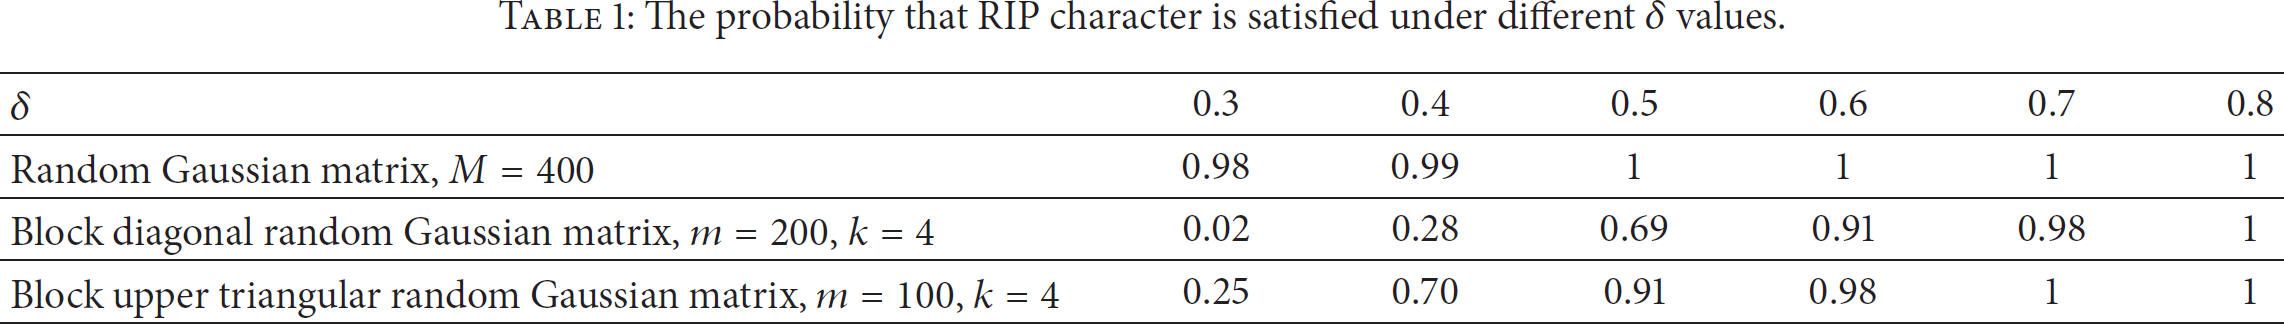
Obviously, compared with the random Gaussian matrix, the RIP character is satisfied under larger δ values for the block diagonal random and block upper triangular random Gaussian matrices. Additionally, the block upper triangular random Gaussian matrix is more easily satisfied with RIP character than is the block diagonal random Gaussian matrix. The simulation and field test results presented in Section 6 test this further.
6. Simulation and Field Test
6.1. Simulation and Discussion
In this section, we evaluate the performance of our schemes in a JSM-2 model in which all signals were constructed from the same sparse set of basis vectors using different coefficient values. We use three metrics to evaluate the performance of the schemes proposed in this paper. The first metric is reconstruction error which is defined as the normalized mean square error as follows:

In all simulations on the regular sensor field, N sensor nodes are uniformly and independently distributed in a rectangle sensor field. In the simulations N is 1200. Several adjacent sensor nodes make up a cluster and one of the sensor nodes is selected as CH. The number of sensor nodes in a cluster is called cluster size. All the CHs are organized as a chain network. The sensor readings are transmitted through multihops by CHs. The sensor readings are the synthetic data which satisfy a standard Gaussian distribution. From Section 4, the size of the observation matrix's row and column is N and M, and we define compressed ratio as the ratio of N and M as follows:

We will show the three metrics in the following simulations, which are averaged over 100 random synthetic data groups.
6.1.1. Reconstruction Error with Different Compressed Ratios
Figure 7 shows the reconstruction error with different compressed ratios and different cluster sizes, 120 in Figure 7(a) with 10 clusters and 1200 sensor nodes and a cluster size of 240 in Figure 7(b) with 5 clusters.

Reconstruction error with different compressed ratios.
As shown in Figure 7, the reconstruction error increases as compressed ratio increases for all schemes regardless of cluster size. Additionally, the BUTM-DCS scheme is superior to the other schemes at the same compressed ratio. The reconstruction error dropped to zero when the compressed ratio is 4.5 in the BUTM-DCS scheme, indicating that the sensor readings can be recovered accurately as long as the CH generates fewer than 30 projections from 120 original sensor readings within its cluster using DCS. The performance of the BUTM-CS scheme that does not include spatial and temporal correlations is considerable in performance to the hybrid CS scheme. The block upper triangular observation matrixes which are used to aggregate data in multihop sensor networks function well, with the performance of the BDM-DCS scheme not as good as the hybrid CS and BUTM-DCS schemes. The result is reasonable because the projection received by FC contains only the data from the original sensor readings within its cluster. Additional projections within a cluster are required to recover sensor readings accurately in the BDM-DCS scheme compared with the BUTM-DCS and hybrid CS schemes. Compared with the performance when the cluster size is 120, the performance is slightly better when the cluster size is 240.
6.1.2. The Number of Transmissions with Different Cluster Size
The previous simulations indicate that the reconstruction error of BUTM-DCS scheme is much lower than that of the hybrid CS scheme at the same compressed ratio, and the performance of BDM-DCS is worse than that of hybrid CS. Here, we present simulations to test this conclusion. Figure 8 shows the number of transmissions using different cluster sizes when the reconstruction error is 0.1. Because the data appears tightly clustered as plotted in Figure 8(a), we changed the y-axis in Figure 8(b) to see the results more clearly.

The number of transmissions of our schemes when reconstruction error is 0.1.
As shown in Figure 8, the transmission numbers of all proposed schemes are significantly less than those of the hybrid CS scheme. The performance of BUTM-DCS scheme was superior. The number of transmissions decreased with increased cluster size for all schemes. The difference between the hybrid CS scheme and other schemes decreased with cluster size because the number of hops decreases. From Section 4, we find that the total number of transmissions is equal in the schemes applying block upper triangular and block diagonal observation matrixes with the same number of projections within a cluster, but both are less than the one in hybrid CS scheme, and the number of transmissions is proportional to the number of hops. There are both fewer projections and reduced transmissions for the same reconstruction error in the BUTM-DCS scheme. The BDM-DCS scheme has fewer transmissions than the hybrid CS, but the number of projections within a cluster is larger at the same reconstruction error.
To determine the degree of performance improvement, Figure 9 shows the reduction ratio of transmissions compared with the hybrid CS scheme. The same pattern is seen at a reconstruction error of 0.1.
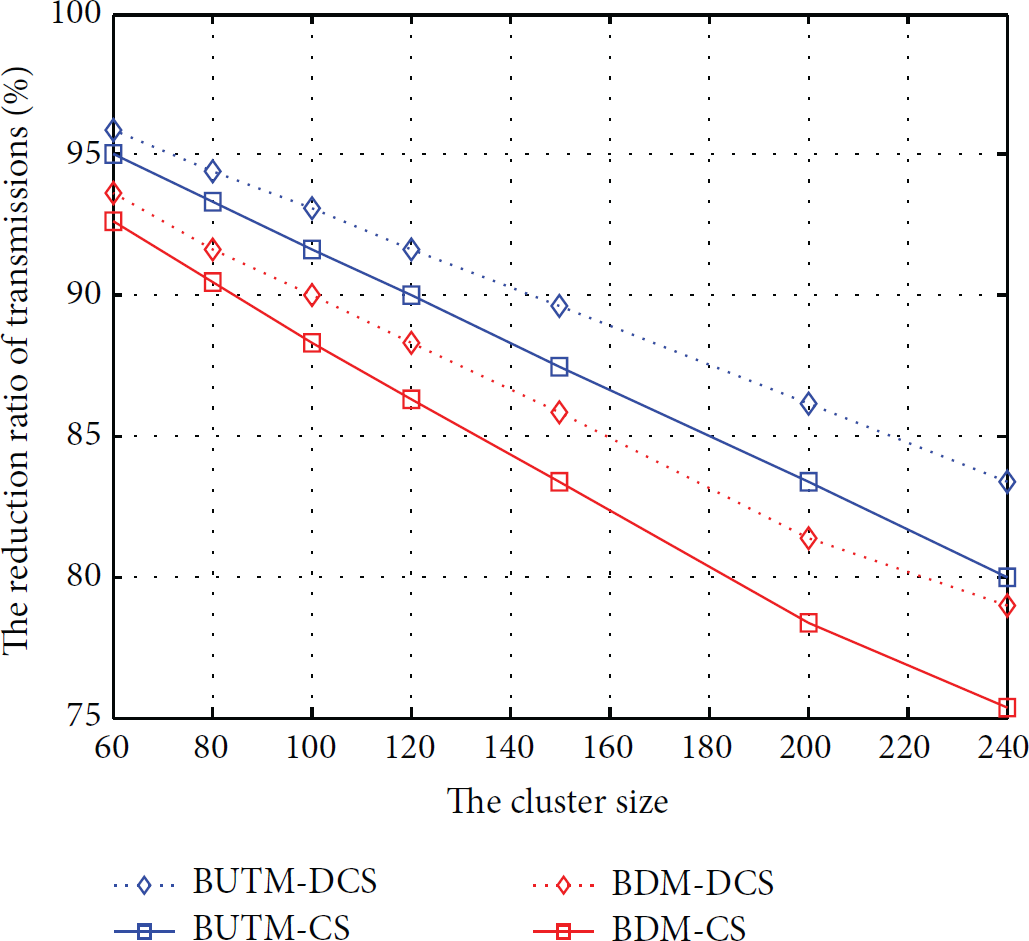
The reduction ratio of transmissions of our schemes compared with hybrid CS scheme.
As shown in Figure 9, the BUTM-DCS scheme reduces the number of transmissions by more than 95 percent compared with hybrid CS when the cluster size is 60. It also reduces the number of transmissions by close to 85 percent when the cluster size is 240, and the number of hops is 5. The performance of the BDM-DCS scheme is less than BUTM-DCS, but compared to hybrid CS, the BDM-DCS scheme reduces the number of transmissions by more than 90 percent (for cluster size of 60) and close to 80 percent (for a cluster size of 240).
6.1.3. Energy Cost with Different Cluster Size
Here, we directly investigate the effectiveness of sensor network in terms of energy cost. As expected the energy cost is proportional to the transmission number. However, the results may differ in multihop wireless sensor networks, especially for underwater acoustic sensor networks given their unique characteristics of the underwater acoustic channel.
Figure 10 shows the energy cost of a single hop with different cluster sizes, assuming that the transmission distance between the farthest CH and the FC is 50 km or 80 km and the communication frequency is 5 kHz or 3 kHz in this chain network.

Energy cost of a single hop in networks with different cluster sizes.
As shown in Figure 10, more energy is required for a longer transmission distance and higher frequency. As distance increases, the energy cost increases exponentially. Thus, as cluster size increases, the number of transmissions decreases, but the energy cost of a single hop increases. How do these opposing effects combine to determine the entire energy cost that is the product of the number of transmissions and the energy cost of single hop? We performed the following simulations to determine the answer to this question.
Figure 11 shows the energy cost of our schemes with different cluster sizes. Again, to see the differences more clearly, the scale is changed in Figure 11(b). The simulations were carried out for a distance of 50 km and communication frequency of 5 kHz.

Energy cost of our schemes with different cluster size.
As shown in Figure 11, the energy costs for our schemes were significantly less than those of the hybrid CS scheme. The BUTM-DCS scheme shows the best performance at the same cluster size. At the same time, the energy cost increased with increased cluster size in all schemes. Obviously, the energy cost of a single hop is the key factor in CUASN in our network scenario. The higher the number of hops, the lower the energy cost.
To determine the degree of performance improvement, Figure 12 shows the reduction ratio of the energy cost compared with hybrid CS scheme.

The reduction ratio of energy cost in our schemes compared with hybrid CS scheme.
As shown in Figure 12, the reduction ratio of the energy cost in our scheme is similar to the performance of the number of transmissions. The BUTM-DCS and BDM-DCS schemes can save energy compared with hybrid CS scheme for all cluster sizes suggesting these methods would be applicable for improved energy efficiency of CUASN.
6.1.4. Reconstruction Error in the Model Highly Consistent with JSM-2
The previous simulations were carried out under the assumption that the DCS model is fully consistent with JSM-2 model. In fact, the groups of sensor readings in a monitoring field are highly consistent with JSM-2 model. That is, many nonzero elements are in the same positions between the two groups of sensor readings while few are in different positions. The field test in Section 6.2 confirms this finding. We next test if the schemes proposed in the paper still show high performance under these altered conditions.
Figure 13 shows the reconstruction error of our schemes in the model that is highly consistent with JSM-2 model. The performance in Figure 13(a) is compared to hybrid CS, and the performance shown in Figure 13(b) is compared when it is identical to the JSM-2 model. The simulations are carried out when the cluster size is 120. There are 20 sparse elements among 100 sparsity elements in different positions.
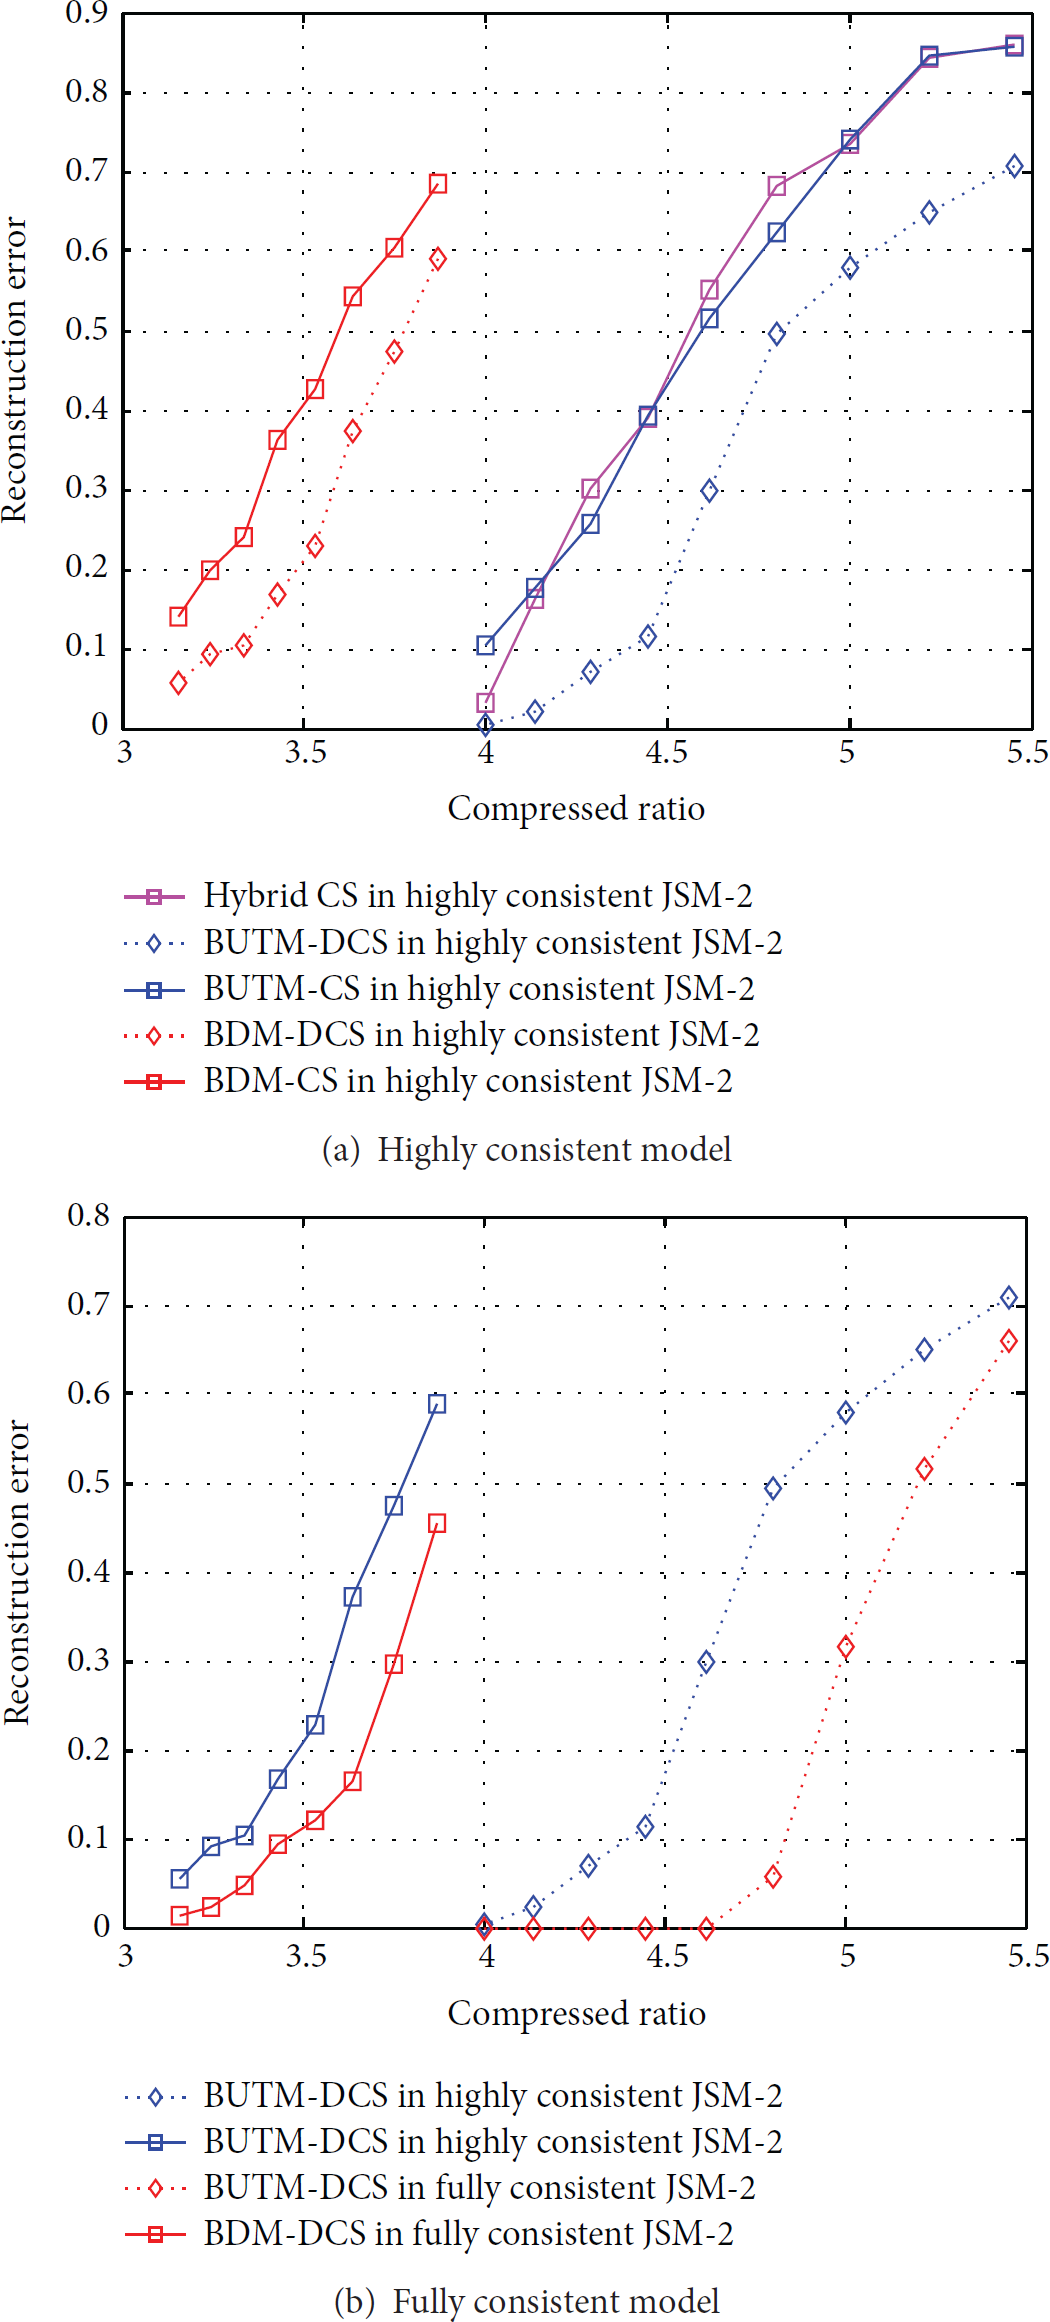
Reconstruction error of our schemes using a model highly or fully consistent (identical) with JSM-2.
As shown in Figure 13(a), the performance is similar to that shown previously. The BUTM-DCS scheme shows the best performance among the schemes. However, in Figure 13(b), we find that performance declines greatly in the model that is only highly consistent with JSM-2. The reconstruction error of the BUTM-DCS scheme does not drop to zero until the compressed ratio is 3. The compressed ratio is 4 in the model that is fully consistent with JSM-2. Additional projections within a cluster are required to get the same reconstruction error.
6.2. Field Test
Real oceanographic data provided by NASA's Ocean Monitoring System such as regional ocean modes (ROMS) can be downloaded from the website: http://ourocean.jpl.nasa.gov/. One thousand and two hundred nodes are distributed in the South Pacific at latitude [32.5, 32.58] and longitude [238.8, 243]. The sensor readings with the same number of sensor nodes were aggregated for a single moment. The groups of sensor readings considered in this paper were taken at 3 o'clock (GMT) and 15 o'clock (GMT) on February 11, 2012, and are denoted by “
Figure 14 shows the signals of

Measured sensor readings of zonal current.
The performance of our schemes was investigated from several aspects in Section 6.1. The schemes which apply block upper triangular observation matrix are applicable in CUASN. We applied BUTM-DCS and BUTM-CS schemes to real sensor readings to illustrate the reconstruction error with different compressed ratios. At the same time, the sensor nodes are divided into 10 clusters, within which there are 120 nodes.
Figure 15 shows the reconstruction error of
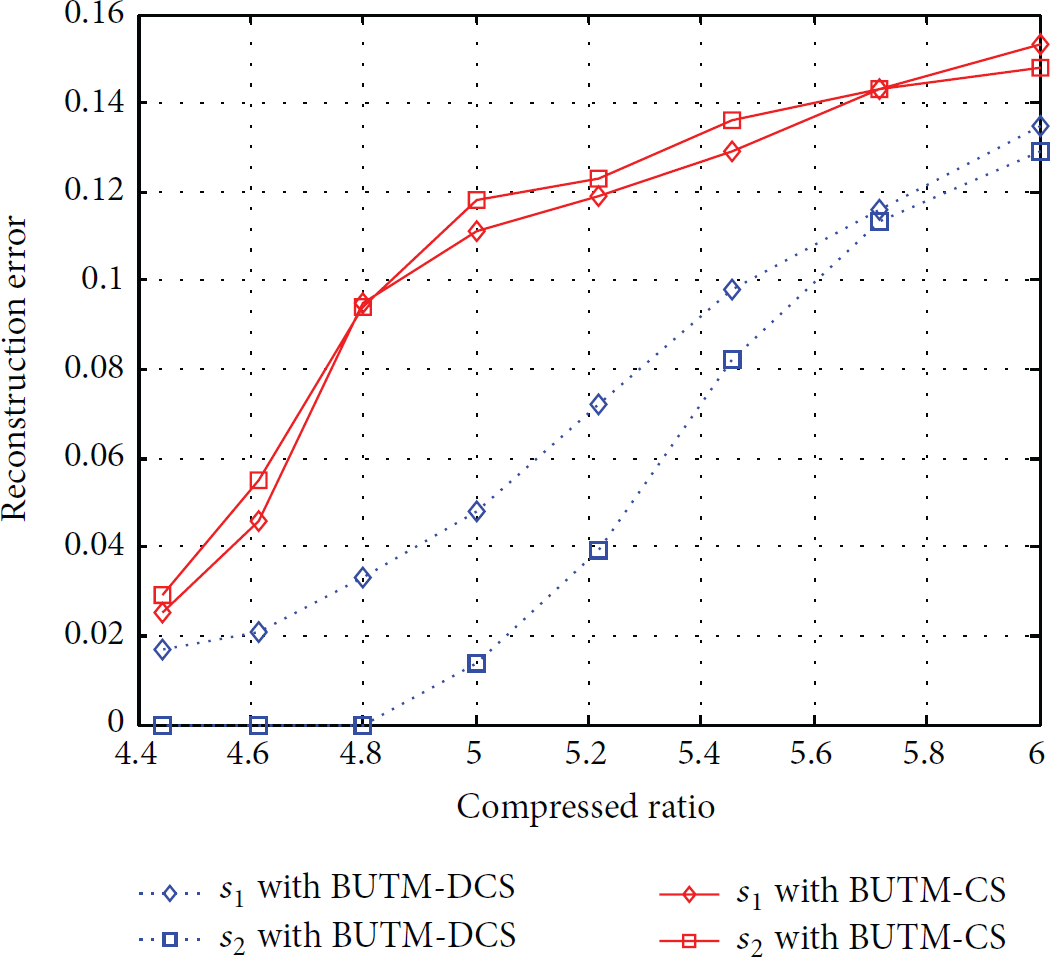
Reconstruction error at different compressed ratios.
Figure 16 shows the temporal amplitude of the original and recovered data with a compressed ratio 5. BUTM-DCS and BUTM-CS schemes are applied.

Reconstruction of actual zonal current with a compressed ratio of 5.
As shown in Figure 16, the original data was recovered accurately by BUTM-DCS scheme.
7. Conclusions
In this paper, we have proposed an energy-efficient data aggregation scheme for cluster-based underwater acoustic sensor network inspired by the theory of DCS. The main approach is to generate RIP-preserving measurements of sensor readings by taking multihop underwater acoustic communication cost into account. The block diagonal matrix and block upper triangular matrix strategies proposed in this paper function well for CUASN. In addition, the two block matrices allow strict RIP by our calculations. Simulation experiments for both the synthesized and real sensor readings were performed and the results demonstrate that the new data aggregation schemes can preserve sensor readings accurately while reducing communication cost greatly.
Footnotes
Conflict of Interests
The authors declare that there is no conflict of interests regarding the publication of this paper.
Acknowledgments
The authors would like to acknowledge the support from the teachers and students from the underwater acoustic communication lab. This work was supported by the National Natural Science Foundation of China (Grants nos. 61301098, 61301097, and 61501386) and the Natural Science Foundation of Fujian Province of China (Grant no. 2013J01253).