
Abstract
Unmanned Aerial Vehicles (UAVs) are envisioned as flexible and fast-deploying communication network for disaster scenarios, where the typical communication infrastructure is likely to be malfunctioning. A few works propose UAVs for building communication links autonomously between rescue team's members in disaster scenarios. The techniques used are usually based on navigation, positioning, and signal strength processing. However, these techniques may not be enough if the objective is to provide communication services to the maximum number of victims and rescuers and not only to a few rescuers. In this situation, dissimilarity metrics, like the Jaccard distance, can provide information about whether the communication service provided to victims is efficient or not (e.g., providing a better distribution of the victims assigned to each UAV acting as service provider). We propose an intelligent strategy that allows UAVs to perform tactical movements in a disaster scenario, combining the Jaccard distance and artificial intelligence algorithms like hill climbing and simulated annealing. Our strategy maximizes the number of victims that are serviced by the UAVs while avoiding network disconnections. Also, a mobility model specifically developed for modelling the victims' movements within the incident site of a disaster scenario is proposed.
1. Introduction
UAVs are envisioned to be used in tactical missions, of either rescue or military nature, that typically involve search for victims or other targets [1–4]. Specifically, in disaster scenarios, emergency crew members that arrive first at the disaster area, also known as first responders, perform rescue tasks against the clock. The reason is that the first 12–24 hours after the disaster occurs is the most critical [5] and consequently a rapid and efficient rescue mission could save an important number of lives or reduce damage. When a group of UAVs is used as a communication network, it usually receives the name of Flying Ad Hoc Networks (FANET) [6] or Aerial Ad Hoc Network (AANET) [2] or simply UAV networks [7].
Several works present mobility models for victims and first responders in disaster areas [8, 9]. These works not only model the incident site, which is the region where the disaster actually occurred. They also model other regions such as patient's treatment area, transport area, and others. These mobility models are focused mainly on the transport of patients from the incident site to other regions but do not model in detail the incident site. Victims' movements within the incident site usually are modelled by using the random waypoint mobility model [10, 11]. We propose a more complete and detailed victims' mobility model for the incident site, which is composed of different elements found in urban disaster scenarios, such as roads, buildings, wreckage, and others. The proposed victims' mobility model in this paper specifically focuses on urban scenarios. The proposed mobility model for victims will serve us for simulating a FANET self-deployment based on the Jaccard distance and artificial intelligence algorithms.
In disaster scenarios and specifically in the incident site, UAVs networks can be of paramount help for victims and crew members involved in rescue operations. FANET could provide different types of services to victims and first responders. One possible service is to perform search and discovery tasks to collect information about the victims' locations, the scenario features after the disaster, and the potential risks that may arise during the rescue missions [12–14]. This information is very important for the first responders to plan the rescue missions and to select the tactical movements to follow. Another service that UAVs may provide is to deploy communication links between emergency crew members [15]. In this situation, the UAVs play the role of a flexible and rapidly deployed communication infrastructure, which becomes crucial as the normal communications infrastructures may be damaged and nonworking because of the disaster.
In order to provide these services, the UAVs composing FANET are usually equipped with hardware and software elements that make them capable of sensing and acting autonomously. It is also possible for the UAVs to include some artificial intelligence algorithms to plan an intelligent strategy about the best actions to be taken at each time. Often, these actions are related to decide whether an UAV should hover at its current position or to calculate a better location to fly to for providing a better service.
The most common technologies that UAVs are equipped with are navigation and positioning systems, signal processing, and computer vision. Navigation and positioning systems are extensively used for defining the UAVs positions [2, 16, 17]. For example, it is possible to force the UAVs to maintain a specific Euclidean distance between each other, thus covering a regular area. Although navigation and positioning systems are a must for any standard UAV application, working only on the basis of the UAVs positions and the Euclidean distance might not be very efficient. The main reason is that disaster scenario features may change rapidly over time (in many cases victims are moving continuously) and the only consideration of positioning techniques does not provide an adaptive response to this situation.
Signal strength processing combined with positioning techniques might yield good results when used in UAVs self-deployment problems [3]. This technique could allow the UAVs to adapt to some scenario conditions and other UAVs proximity, adapting their position to the place where the signal strength is maximized. However, by using only this technique it is not possible to infer information about whether some UAVs are servicing the same victims of the scenario and if other UAVs positions would be allowed to reach a better distribution of victims serviced per drones, thus maximizing the total number of victims serviced.
Imaging and computer vision techniques are usually very accurate for analyzing different types of scenarios and their features [18, 19]. These techniques can be suitable for analyzing the victims' presence and their movements in disaster scenarios; however computer vision techniques usually are resource-consuming (both hardware and software) and might affect considerably the flying autonomy of small UAVs.
We propose an innovative approach to accomplish the self-deployment of a group of UAVs by using the Jaccard dissimilarity metric [20] and artificial intelligence algorithms. The Jaccard distance between two UAVs is calculated from the number of victims that they share, and it is proposed in this paper as a useful parameter to consider when calculating the tactical movements of the UAVs in a FANET. As a difference from other methods based only on the Euclidean distance, the Jaccard distance contains updated information about the scenario and the victims' movements. Depending on its value, two UAVs can make decisions about approaching or moving away from each other, and these decisions may vary over time as victims are also changing their position. For instance, the FANET may detect whether its UAVs are sharing a large number of victims and whether there are other positions that they could occupy to service the maximum number of victims while maintaining their connectivity. However, it is not easy to set a specific value for the Jaccard distance for the UAVs to decide about the best movement to make.
Selecting only one value as the target Jaccard distance to be used for the UAVs at the beginning of a simulation is not efficient at all. Moreover, with the changing conditions of the scenario, the optimal Jaccard value could be varying. For this reason we implement artificial intelligence algorithms to provide an autonomous selection of the target Jaccard distance to be used for the tactical movement of the UAVs along the entire simulation. The objectives of the proposed approach are twofold: (i) to service the largest number of victims being adaptive to the victims' movements and (ii) to maintain the network connectivity.
The main contributions of this paper are
a more realistic mobility model for victims' movements within the incident site of an urban disaster scenario, Jaccard-based movement rules to define the UAVs best positions for providing the best communication service to the victims, a comparison among several local search computational intelligence algorithms implemented such as simulated annealing, hill climbing, and random walk for deciding the best tactical UAV movements.
This paper is organized as follows. Section 2 reviews the related work victims' mobility models for disaster scenarios and on Flying Ad Hoc Networks. Section 3 presents the proposed victims' mobility model simulating the incident site of a disaster area scenario. Section 4 describes the tactical movement rules that allow the UAVs self-deployment based on the Jaccard distance and artificial intelligence algorithms. Section 5 describes the artificial intelligence algorithms implemented in the software simulator tool developed. Section 6 describes the simulation settings and the main results obtained. Finally, Section 7 concludes the paper.
2. Related Work
2.1. Modelling Victims' Mobility in Disaster Scenarios
Mobility models for disaster scenarios have been a common research topic in the last decade. There are several works focusing on mobility models to simulate the victims and rescue teams movements in disaster scenarios [8, 9, 21].
The authors in [8] model the disaster scenarios dividing the simulation area according to several sites, namely, the incident site or incident location (where the catastrophe actually occurred and the victims should be rescued), the treatment area (where victims receive first aid care), transport zone (including ambulance parking point and helicopter landing site), and hospital zone. The focus in [8] is put on civil protection units and therefore it presents a mobility model reproducing their movements in search of victims operations. Two types of nodes are modelled, pedestrians and transport nodes. Regarding the incident site, the mobility model proposed in [8] considers only the presence of transport nodes. The reason is that it is only modelling the behavior of a transport vehicle picking up a patient from the incident location and carrying him or her to another area of the model called patients waiting for treatment area. In fact, the locations to which transport nodes pick up patients within the incident location are selected randomly. Thus, there is not a real mobility model representing the victims' behavior within the incident site.
BonnMotion [21] is a software tool for generating and analyzing mobility models. BonnMotion allows the generation of disaster scenarios, under the name of Disaster Area Model, mobility models according to the description provided in [8]. In this model, the incident site is modelled by following either the random waypoint model, which was first introduced in [22], or a slight variation of it.
The authors in [9] present the Human Behavior for Disaster Areas (HBDA) mobility model. HBDA simulates the behavior of rescue teams performing search-for-victims operations. This behavior is represented by a set of algorithms that mimics the operation of a group of people scouting unexplored areas, spreading out over the scenario but maintaining the line of sight with other members involved in the search operation.
The Composite Mobility Model (CoM) is presented in [23] as a mobility model for disaster scenarios that consists of the combination of more basic mobility models. Its main characteristic is the possibility of representing group mobility by using the Reference Point Group Mobility Model [24]. Also, it replaces the random waypoint mobility model by the Levy-Walk model proposed in [25] for obtaining more realistic simulations without the nodes concentration usually showed by the random waypoint model. Although more realistic than other mobility models, the CoM bases its behavior on the fact of knowing the scenario characteristics in advance, which may be available in some situations but not in disaster areas where the presence of building wreckage and debris might be present.
Although there are several mobility models for disaster scenarios, it is clear that they mainly focus on modelling the mobility of the rescue workers; they do not model the victims' movements within the incident site in a detailed manner. In the works that also include the victims' mobility, they model it in a very simple way, such as the Disaster Area Model [8], where the victims' mobility is represented by one squared area (the incident site) where victims move using the random waypoint mobility model. Moreover, in those works in which victims' mobility is simulated within the incident location, the models used are the random waypoint model or the Levy-Walk model, which provide a distribution of victims all over the incident location (more distributed in the case of the Levy-Walk model).
Current research trends on modelling generic human mobility are based on analyzing real traces of human movements in order to infer new mobility models [26]. Other research efforts are put in validating existing mobility models through the usage of such real mobility traces [27, 28]. These trends are both promising research approaches for designing and analyzing new mobility models representing normal mobility situations (e.g., the mobility of persons during a normal working day and a normal weekend day) and also for studying the routing protocols performance with these mobility models [29, 30]. However, it is important to notice that there are neither other works nor information about real movements of victims in a disaster-like situation. It is unfeasible to make preparations to record the mobility of humans in a disaster scenario because it is not possible to predict in advance when and where a disaster will occur. Also, some of the techniques used for acquiring data of human movements' real traces may not function in a disaster scenario, due to damage in the technologies used and the corresponding infrastructure, making the real traces more difficult to gather.
The focus of this paper is the area defined as the incident site in [15], because this is the area where the UAVs are going to be deployed for providing communication services to victims. Therefore, a victim's mobility model more complete than the ones previously mentioned is needed. For this reason, a mobility model for victims within the incident site of an urban disaster scenario will be first proposed.
2.2. UAVs Applications in Disaster Scenarios
Regarding UAVs, there are several works in the area which presents results and applications that are directly or indirectly applicable to disaster scenarios.
UAVNet [3] proposes a mesh network using UAVs with the aim of providing communication services between two ground nodes which are not able to communicate by themselves. Although it is not presented for disaster scenarios it could be applicable to some emergency scenarios. The algorithm developed for UAVNet firstly makes the UAVs localize the first end system position of the entities that want to communicate; then it searches the second end system and calculates the best position for the UAV to be located in order to communicate the end systems. The algorithm bases the best position calculation on Euclidean distance and signal strength processing. It also presents the possibility to use more than one UAV, with some of them playing the role of relaying nodes in the communication bridge between the two end systems. Despite the UAVs having a search operation mode, UAVNet works on the basis that the UAVs know in advance one of the end systems positions, and usually the first end system provides the position of the second end system to the UAVs. This approach addresses the problem of building one communication link with UAVs between two end systems. Therefore, the problem of maximizing the number of victims that are provided with communication services is not addressed.
AirShield [17] proposes an aerial network, consisting of a swarm of micro-UAVs (MUAVs), to establish a communication network in situations of emergencies of gases, explosions, and chemical clouds. AirShield is provided with components that act as an intelligent agent; these are a Decision Support System that measures the chemical cloud trend values and a cloud propagation simulation on which the UAVs based the calculation of their next positions to occupy. Although the AirShield application presented is on chemical clouds, the evaluation focus of the authors in [17] is on the performance of several wireless access technologies implemented on the MUAVs network (mainly evaluating the Round Trip Time of messages exchanged). The solution proposed by AirShield is applicable to disaster scenarios but is mainly focused on tropospheric telemetry for providing this information to the mission control center, which is located on the ground. Providing communication services to the victims on the ground that might be affected by the catastrophe is not addressed.
The authors in [15] propose a swarm of microair vehicles, called SMAVNET, for creating a communication network on a disaster area. The SMAVNET uses fixed-wing UAVs (not quadcopters-like UAVs) which must be moving constantly; therefore, rather than calculating the best positions to serve as a communication network, the UAVs have to calculate flying routes. The technology used in SMAVNET for steering the UAVs only uses communication hardware (WiFi or radio modules) and magnetic compass instead of GPS-like positioning systems. The fixed-wing UAVs in SMAVNET are launched at regular intervals and self-organize themselves to search for other rescuers positions. Rescuers send “hello” messages at a given rate and, when the UAVs detect the reception of these messages at a rate close to the one used by the rescuer, the discovery of a new rescuer is finished. Then the UAVs maintain the communication links between the rescuers by creating a chain between the rescuers' positions. Two artificial intelligence algorithms were implemented on SMAVNET simulation, an artificial evolution controller and a second one based on ant colony foraging and pheromone trails. The approach described in [15] uses artificial intelligence for the self-organization of a FANET on a disaster area providing communication links between rescuers. However, the presence of many victims in this approach is not considered and mainly the SMAVNET has been simulated only with a few rescuers.
Search-for-target missions have been found in the literature together with the use of artificial intelligence techniques for controlling the UAVs behavior [13, 14]. In [13] an agent-based simulation tool is developed for collaborative search task of a group of UAVs. The search controller is based on a controller mixing central control and pheromone-based techniques. The scenario is divided into cells on which the UAVs leave pheromones when they visited them or are marked as “visited” by the central controller when the cells are under the coverage of the UAVs. The aim is to perform a search task of a target, not to provide coverage to it. In [14], two types of controllers are designed for a nonhelicopters model of UAV groups. The mission for the UAVs is to navigate through an unknown environment, reach a target, and detonate it. The first controller proposed uses a neural network consisting of 7 input neurons (1 encoding for the distance to the target, 3 for the angle, and 3 for the distance to the closest obstacle); additionally, 15 neurons are forming the neural network core, and 2 output neurons are used. The second controller implements a genetic algorithm using a fitness formula depending on the target position and movement. Both controllers implement a multiagent system for four UAVs that collaborate in the search and destroy mission.
Although the use of UAVs and FANET has been proposed recently in the literature, there are no other works addressing the problem of providing communication services to victims during the rescue mission, but only to rescue crew members. Moreover, there are no other works following the approach of using dissimilarity metrics, such as the Jaccard distance, and artificial intelligence algorithms for the calculation of UAVs tactical movements. Then we propose intelligent strategy based on the Jaccard distance and artificial intelligence algorithms for enabling the UAVs self-deployment on a disaster scenario. The main objectives sought with the strategy proposed are (i) to maximize the number of victims and rescue workers that are serviced by the UAVs and (ii) to maintain the network always connected.
3. Disaster Scenario and Victims Mobility Model
This paper is focused on the incident site within an urban disaster scenario [8]. The victims' movements within an incident site can be very heterogeneous and difficult to categorize. Random movements are very likely to be found on victims within the incident site. However, architectural features of the disaster area affect the victims' movements. As an example, victims could move along a road trying to escape from the danger but they cannot jump over a building or they might find a blocked street due to building wreckage.
There is not much information in the literature about victims' movement traces within the incident site. Previous works on disaster mobility models are mainly focusing on rescue workers mobility [8, 9, 21, 23]. The few of them modelling victims' mobility, as, for example, [8], describe the incident site as a squared scenario in which victims moved all over the space following the random waypoint mobility model. We propose a more detailed and complete urban disaster scenario model, with more features than previous models. The victims' mobility model proposed in this paper has the following main features:
The disaster scenario modelled has two dimensions (2D) and is composed of different regions. We defined several regions types, each of these representing typical elements that are found in common urban scenarios, such as roads and building blocks. Each region type is characterized by specific constraints associated with its shape and the movement that the victims are allowed to perform within the region. The main region types are (i) streets, (ii) building blocks, (iii) open areas such as parks, and (iv) prohibited areas, in which the victims movement is not allowed due to structural features (e.g., fences and walls) or dangers (e.g., fires and wreckage). Other specific regions typical of disaster scenarios are defined in the next bullet. Building wreckage or debris usually appears in disaster scenarios. Thus, we define other regions such as (i) blocked roads and (ii) buildings traps. Blocked roads are roads with specific points in which victims only have two possible movements, to stop at that point or to move away from it in the opposite direction. Buildings traps are buildings or other architectural structures that keep some victims trapped and they cannot escape from them without the help of rescue teams. Victims may move randomly, changing their speed and direction at any time, but only within a region. The mobility model used to model victims movements is based on the random waypoint mobility model improved with some movement constraints that are associated with each region defined (e.g., victims move in a street region using only a linear movement). Victims' speed varies between 0.5 ms−1 and 3 ms−1. Also, victims may be static during a specific time frame, that is, not moving at all. The highest speed represents victims running around, looking for help, escaping from a potential danger, or acting under the influence of nervous breakdown. Static victims and those moving at the lowest speeds represent victims that might have difficulties to move, probably because of the injuries suffered during the disaster. Sudden changes are also likely to occur in disaster scenarios, such as a building collapse or an explosion. We have modelled these types of changes on the scenario by making some victims groups disappear from the disaster area.
In the proposed mobility model, victims are moving within the aforementioned regions according to the following considerations:
An example of the disaster scenario proposed with the different regions (marked with the colored rectangles) is depicted in Figure 1. The different regions defined before are described in Figure 1 legend. This is the urban disaster scenario model that we have used for running our simulations. The situation of several victims groups disappearing from the disaster scenario is shown in Figure 2.
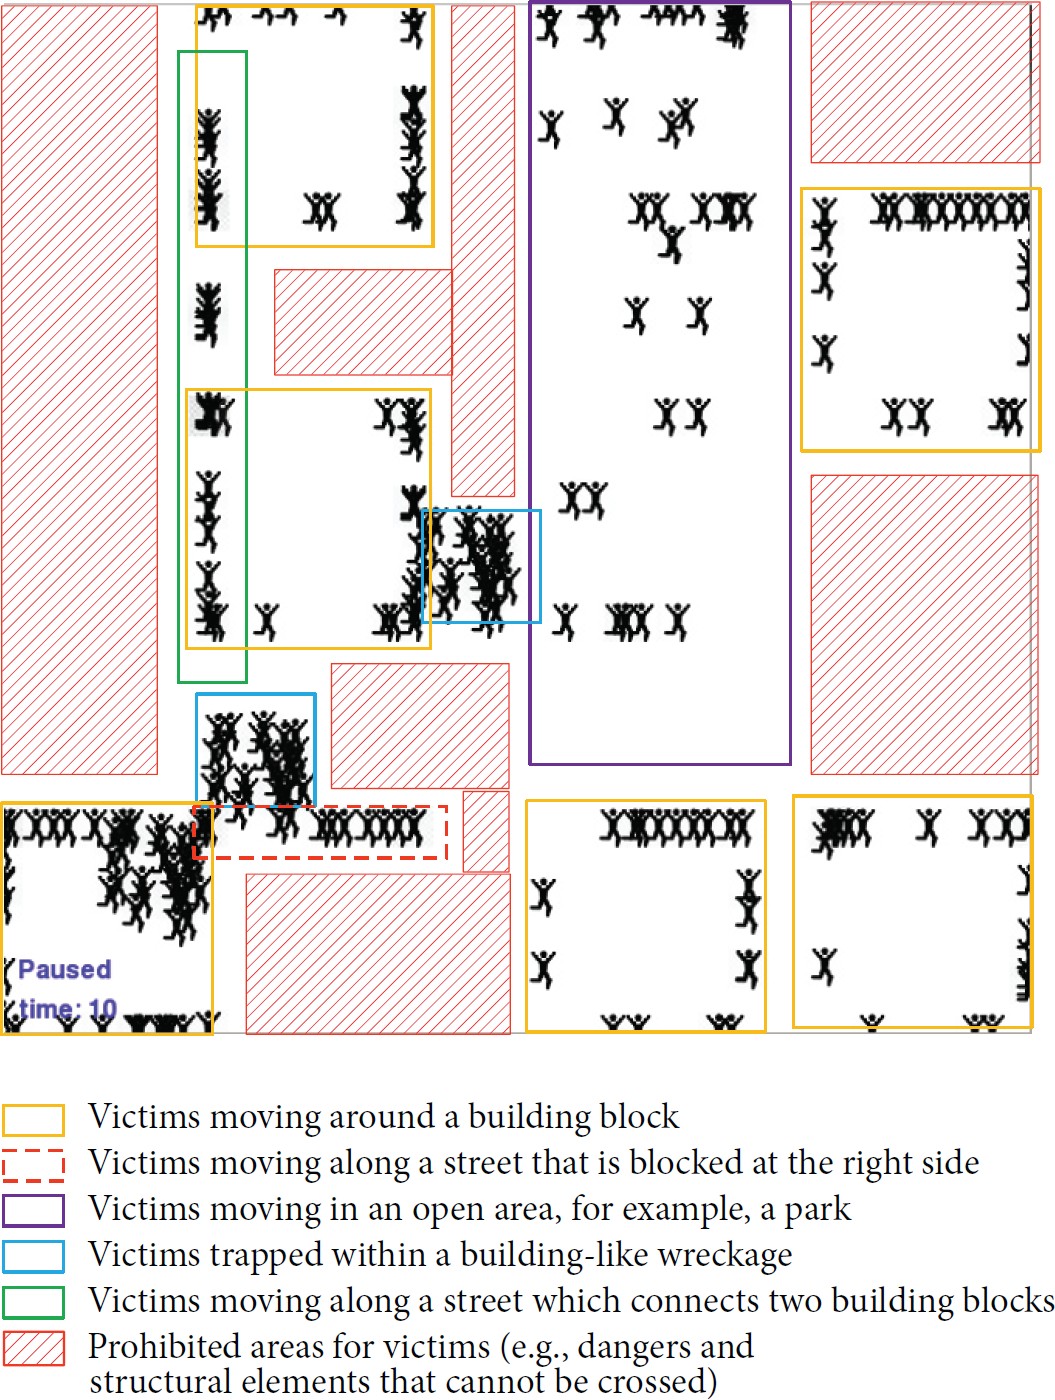
Victims moving on the disaster scenario model proposed and regions descriptions.

Disaster scenario: (a) before a sudden change and (b) after the change that occurred.
We present in Figure 3 the urban disaster scenario proposed in this paper against a digital map picture of a real city (Madrid, Spain; coordinates: 40.39, −3.69). In Figure 3 we can appreciate that though both are not exactly equal, there are important similarities between the model proposed and a real city scenario.

(a) Disaster scenario model proposed against (b) a real city urban scenario with the layout of our disaster scenario model on top.
4. UAVs Self-Deployment
The UAVs self-deployment is given by two main elements: (i) the tactical movement generation rules based on the Jaccard distance and (ii) artificial intelligence algorithms that maximize the number of serviced victims without losing network connectivity. Also, being adaptive to scenario variable conditions, that is, the movement of victims, is considered a goal.
4.1. Main Assumptions
In the proposed approach the following assumptions have been done:
We consider helicopter-like UAVs that can hover over a specific position the time that is needed for providing communication services to the victims that are located within their range. We consider two types of wireless links: (i) UAV-UAV when the wireless link is stablished between two UAVs and (ii) UAV-victim when the wireless links are set between an UAV and a victim. The UAVs composing the FANET are able to detect the victims and other UAVs within their range by using any wireless access technologies. Potential candidates for these technologies could be anyone allowing ad hoc communications mode such as the common 802.11b/g/n or 802.11p which is used in Vehicular Ad Hoc Networks (VANETs). We have developed our work assuming that the UAVs of the FANET are equipped with these technologies. However the proposed approach is not limited to them and could be adapted to others. Several works present potential solutions that could be used to know the victims that are within range [3, 15]. Also, Mobile Ad Hoc Networks approaches as the ones proposed in [31–33] could be used among the UAVs and the victims so the UAVs could “sense” the victims' mobile phones. It is assumed that the UAVs are aware of the victims that are located within their range because of the usage of any of these network techniques. The UAVs are ideally flying at a specific height that allows them to service the victims that are located within a communication range of 250 m (centered in the UAV). The coverage area of each UAV is considered to be circular as it has been usually modelled in other works, as it is mentioned in [34]. The UAVs maximum speed is selected at 10 ms−1. This is a value which highly depends on the type of the UAV and its flying equipment and for this reason has been set to the average speed of a standard UAV. The UAVs dynamics has been simplified and is supposed to move only in a 2-dimensional plane. This consideration has been done in order to avoid complexities (such as UAV's acceleration, attitude, twists, and vertical oscillations) which may overload the software simulator developed. Each UAV shares a list of the victims that are within range with its UAVs neighbors in a distributed manner, so the entire FANET is aware of the serviced victims.
For the sake of clarity, other considerations have been made in order to reduce the number of variables affecting the problem modelled. With these considerations we reduce complexity but not validity of the solution proposed:
4.2. Jaccard-Based Tactical Movement Rules
The Jaccard-based tactical movement rules are an innovative approach for generating UAVs' movements that takes as inputs the current situation on the scenario, that is, the victims' locations and the current positions of the UAVs. As previously mentioned, it is assumed that the UAVs are aware of the victims that are on range through the usage of any wireless technology working on ad hoc mode.
Although the Jaccard distance and the Euclidean distance are different concepts, it has been shown that there exists a correlation between the two of them [20]. The main reason for selecting the Jaccard distance as a parameter to generate mobility is that it provides information not only about the physical proximity of a pair of UAVs, but also about whether a pair of UAVs have many victims located on the region where their coverage areas overlap; that is, they are sharing many victims. Two UAVs that service almost the same victims are not a desired solution as there might be other areas and victims unattended. This is likely to occur in the case of a FANET that decides the UAVs positions only based on positioning systems, that is, only using the Euclidean distance between the UAVs. This situation is depicted in Figure 4, where the group of victims on the left of the figure could not be serviced if the UAVs are configured to maintain a fixed Euclidean distance between them. By using the Jaccard-based tactical movement rules proposed in our work, we make the UAVs notice when they are sharing many victims with other UAVs, and thus they calculate new positions to service more victims, share fewer, and maintain connectivity.

Jaccard distance between two UAVs.
4.2.1. Jaccard Distance
The Jaccard distance is a metric which measures the dissimilarity between sample sets. In the Jaccard-based movement rules proposed, each pair of UAVs has a Jaccard distance based on the distribution of victims under them. We define the Jaccard coefficient for a pair of UAVs as the number of victims located within the region where the UAVs coverage areas overlap, divided by the number of victims within the range provided by both of them.
Based on the situation depicted in Figure 2, the Jaccard coefficient (represented by
Based on the previous definition of the Jaccard coefficient, the Jaccard distance (represented also by


4.2.2. Movement Rules
We describe in this section the UAVs movements calculations based on a given Jaccard distance value that the UAVs should maintain among them. This Jaccard distance value, which we name after target Jaccard, is given by artificial intelligence algorithms. The algorithm implementing these movement rules calculates the difference between the existing Jaccard distances of each pair of UAVs and the target Jaccard and decides for each pair of UAVs if these should move with respect to each other as follows:
In the case where two UAVs have at a specific time a Jaccard distance between them which is bigger than the target Jaccard, they are affected by an attraction force; thus they will move closer to each other. In the case where two UAVs have a Jaccard distance smaller than the target Jaccard, they are affected by a repulsion force; thus they will move away from each other.
The terms “attraction” and “repulsion forces” are used to represent the influence of one UAV on others. These forces are equivalent to velocity vectors that will be applied in the next movement to be performed by each UAV.
The intensity of these attraction and repulsion forces is given by a relationship between the Jaccard distance and the speed at which the UAVs will perform the next move. This relationship is shown in Figure 5, where

Relationship between the Jaccard distance of two UAVs and the speed of their next move.
As shown in Figure 5, a specific Jaccard-speed function is defined in our algorithm for each value of the target Jaccard. The red and green lines are examples to represent the cases when the target Jaccard is close to its minimum or maximum value; in these cases the relationship between the Jaccard distances and the speed is modulated by a factor in order to diminish the maximum speed at which the UAVs could move. This avoids having the UAVs move with high speed when they are too close to each other or too far.
When a pair of UAVs has a Jaccard distance of a specific value (
The movement direction of a pair of UAVs will be determined by a virtual line that connects their positions. In the case of a network with more than two UAVs, every UAV creates attraction or repulsion forces on the rest of the UAVs. As an example, in a network with 5 UAVs, each UAV will be influenced by 4 forces from the rest of the UAVs, that is, 4 velocity vectors. Consequently, the velocity vector resulting from the addition of all the velocity vectors affecting UAV will determine its next movement.
This situation is depicted in Figure 6 for 3 UAVs and a target Jaccard of 0.5. In this example, the UAVs

Velocity vectors addition: the effect of several UAVs Jaccard distances.
The movement rules as they have been described so far will not allow the UAVs to spread enough during the self-deployment. The reason is that each UAV has an attraction or repulsion force from every UAV of the network (except by itself). Then, any UAV will have lower Jaccard distances with closer UAVs and higher ones with further UAVs. This will create a set of repulsion forces (from the closer UAVs) and other sets of attraction forces (from the further UAVs), then resulting in velocity vectors cancelation and thus a network that does not spread enough. This situation is depicted in Figure 7.

Attraction and repulsion velocities vectors cancelation.
Velocity vectors cancelation is an undesired effect. In order to overcome this limitation we add another parameter to our movement rules. We define the term Jaccard neighbors for each UAV of the network. The Jaccard neighbors of UAV are the UAVs on the network that have the lowest Jaccard distances with respect to it. This is a parameter that can be set to one value at the beginning of the simulation and remains constant for the entire simulation. As an example, for a simulation with Jaccard neighbors set to the value 2, each UAV will be only affected by the forces created by the 2 UAVs that have the lowest Jaccard distances with respect to it. Consequently, each UAV will have a couple of Jaccard neighbors. We can consider the Jaccard neighbors parameter a similar concept to the degree of the nodes of the network, so in our example if the Jaccard neighbors parameter is set to 2, every UAV in the network will have degree 2.
As a result of this new consideration each UAV will focus on the most similar UAVs to it (equivalent to the UAVs with the lowest Jaccard distances) to calculate its attraction or repulsion forces. This will allow the FANET to spread more and provide communication services to more victims. This situation is depicted in Figure 8.

UAV
As the last addition to the movement rules, we include a disconnection avoidance procedure. We consider that the UAVs network is disconnected when the network is split in two or more groups of UAVs that have no wireless connectivity among them. Examples of connected and disconnected UAVs networks are provided in Figure 9, where the blue lines represent the wireless connections between two UAVs. We define the disconnection security distance as the distance (in meters) from the coverage area perimeter of each UAV and measured towards the center of the coverage area. The disconnection security distance then defines a ring area for each UAV, which is shown in Figure 10.

Examples of a connected network (a) and a disconnected network (b).

Disconnection security distance and attraction vector for UAVs
When one UAV has one of its Jaccard neighbors within the security distance ring area, then this Jaccard neighbor is considered to be at risk of disconnection in the next movement. For this reason, a UAV at risk of disconnection is affected by additional attraction force towards its Jaccard neighbors, which keeps them away from being disconnected in the next movement. In Figure 10 we can notice that with the absence of the velocity vector
5. Artificial Intelligence Algorithms for Optimizing the Number of Serviced Victims
5.1. Algorithm Execution Procedure
A disaster scenario has a dynamic and varying nature. One of the main components of the changing nature of disaster scenarios is that victims are not motionless. Victims may move following very different trajectories, at different speeds, may hold still for a few seconds, and then resume their movements, and so on. We represented some of these features in the proposed scenario of Section 3.
Then the Jaccard-based movement rules that we propose for the UAVs have to be adaptive to those scenario dynamics. For this reason, we implement several artificial intelligence algorithms in our model. The algorithms implemented are simulated annealing and hill climbing. We also implemented an algorithm based on the random walk concept for comparison purposes.
The aim of the artificial intelligence algorithms is to maximize the number of victims serviced by the UAVs and then calculate the target Jaccard and the target UAVs positions associated with this optimal behavior. The algorithms are not executed continuously but periodically. As an example, for a simulation with a period for the algorithms of 30 seconds, an entire execution of the algorithms is carried out every 30 seconds. During the time when the artificial intelligence algorithms are not being executed, the UAVs keep moving to the target positions calculated by the algorithms. This procedure is shown in Figure 11.
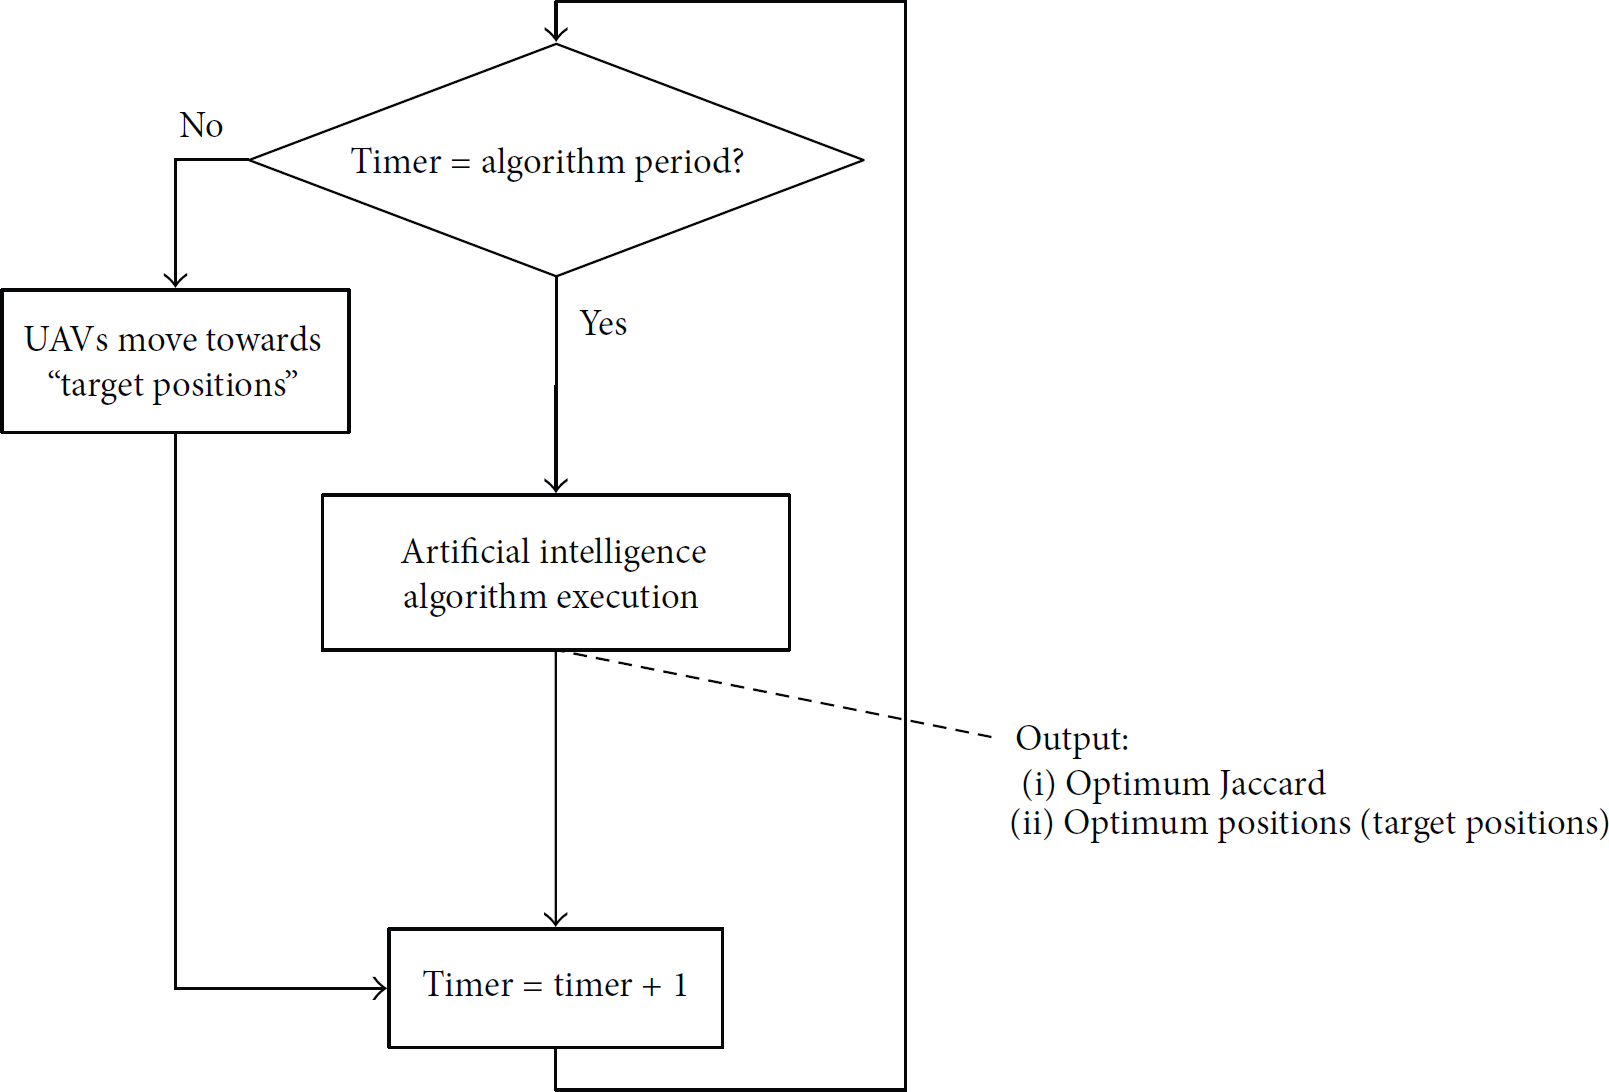
Computational intelligence algorithms execution procedure.
One reason for following this procedure is that during the time when the artificial intelligence algorithms are not executed, the UAVs have time to share information about the victims they are servicing and thus calculate their Jaccard distances for the next execution of the artificial intelligence algorithms.
These algorithms may be time-consuming; however, we have implemented them with a maximum number of cycles or iterations in order to avoid excessive computation or time demands. A number of 10 cycles were shown to be a valid value for the algorithms convergence as shown in Figure 12.

Simulated annealing and hill climbing convergence.
5.2. Fitness Function
The same fitness function has been used for both the simulated annealing and the hill climbing algorithms. The main objectives of our movement rules are to service the maximum number of victims and to avoid the network disconnection. These objectives are represented in the fitness function as parameters. A simplified definition of the fitness function proposed is represented by the following expression:
Serviced: it is the number of victims that are serviced (i.e., that are under the coverage area) by the entire UAVs network at any time step. Each victim is counted only once in this parameter. Distance_to_Jaccard_neighbors: each UAV on the network should be connected to its Jaccard neighbors; however, at some point when the network is not spread enough, they may be close to other UAVs as well. This is not a desired situation as we aim to maximize the fact of the UAVs spreading over the disaster area. This parameter measures the difference between the Jaccard neighbors that a UAV should have and the number of UAVs that are actually within connection range. As a result, this parameter penalizes when the network is not spread enough. It also penalizes the cases when a UAV is disconnected to all of its Jaccard neighbors. Disconnected: flag is activated on the software when a disconnection is detected on the FANET and the network is split into several groups. A generic connected components algorithm has been implemented to measure network disconnections.
The fitness function defined in expression (3) maximizes the number of victims serviced by the UAVs network with a weight of the 80% of the total weight of the function. We penalize the possible solutions that do not comply with the connectivity of each UAV with its Jaccard neighbors with the second term, which is weighted to the 20% of the total weight of the function. As an addition we strongly penalize the solutions that present the FANET network with disconnections or divided into several groups of UAVs.

The fitness function defined in (3) does not have the target Jaccard value (
If we define the Jaccard-based movement rules as a mathematical function


Jaccard-based movement rules as a mathematical formula (
5.3. Random Walk
Random walk algorithms are based on a selection of random steps consecutively. Although they can be considered as a complete method in the area of local search algorithms, they do not put any pressure on maximizing a fitness function so their efficiency is compromised [35]. We have implemented an algorithm with a random walk behavior in order to demonstrate that other algorithms perform better than this.
Our random walk implementation shown in Figure 14 randomly selects a value for the target Jaccard that it is then used in the Jaccard-based movement rules described in Section 4.2. The movement rules provide then a position for each UAV in the scenario. This is considered as the target position, and thus the UAVs will move towards these positions during the time before the next execution of the algorithm starts. As previously mentioned in Section 5.1, this algorithm is executed periodically. The same procedure is applied to all the algorithms in order to compare them afterwards.

Random walk-based algorithm.
5.4. Hill Climbing
Hill climbing algorithm is a simple local search algorithm guided towards finding one of the maximum values of a fitness function. The initial value of hill climbing is selected randomly at the beginning of the algorithm. Then hill climbing evaluates the fitness function in every possible direction and accepts the one that maximizes it (in its uphill version). This procedure is repeated either a fixed number of iterations or until the evaluation of the fitness function does not provide better values, that is, new optima values.
The problem with hill climbing algorithm is that its final result, that is, the maximum value found, could be a local maximum and not a global maximum. Also, this algorithm could get stuck in flat regions. For this reason, hill climbing is not considered a complete optimization problem [35] as it cannot reach the global maximum always.
For each algorithm execution, the algorithm randomly generates an initial value that is considered as the target Jaccard. In the first iteration, this value is provided as an input for the Jaccard-based movement rules, which calculates the UAVs next positions on the basis of the target Jaccard. The output of the Jaccard-based movement rules is then considered the initial accepted solution. Then, in the next iterations, two possible values for the target Jaccard are generated, the previous accepted target Jaccard plus 0.1 and minus 0.1. Both values are evaluated in the Jaccard-based movement rules and their fitness function values are compared. The target Jaccard that produces the bigger fitness function value is selected as the accepted solution. Then, the next iteration starts. A simplified algorithm implementation is depicted in Figure 15.

Hill climbing algorithm implementation.
In Figure 15 we use the terms target_Jaccard_plus and target_Jaccard_minus to represent the two potential solutions evaluated. Target_Jaccard_plus stores the value of the previously accepted target Jaccard (current target Jaccard) plus 0.1 and target_Jaccard_minus stores the value of the previously accepted target Jaccard (current target Jaccard) minus 0.1.
5.5. Simulated Annealing
Simulated annealing is an artificial intelligence algorithm that can be classified as a local search algorithm with probabilistic features [35]. This algorithm was first formulated in 1953 and known as the Metropolis algorithm [36], which mimics the annealing of solids. In the metallurgy industry, the annealing process decreases the temperature of a metallic material gradually, keeping the material on each temperature for specific amount of time to allow the material's atoms to reach the lowest energy states possible for each temperature. When used as an artificial intelligence algorithm, simulated annealing is an algorithm that finds a global optimum from a cost function or fitness function.
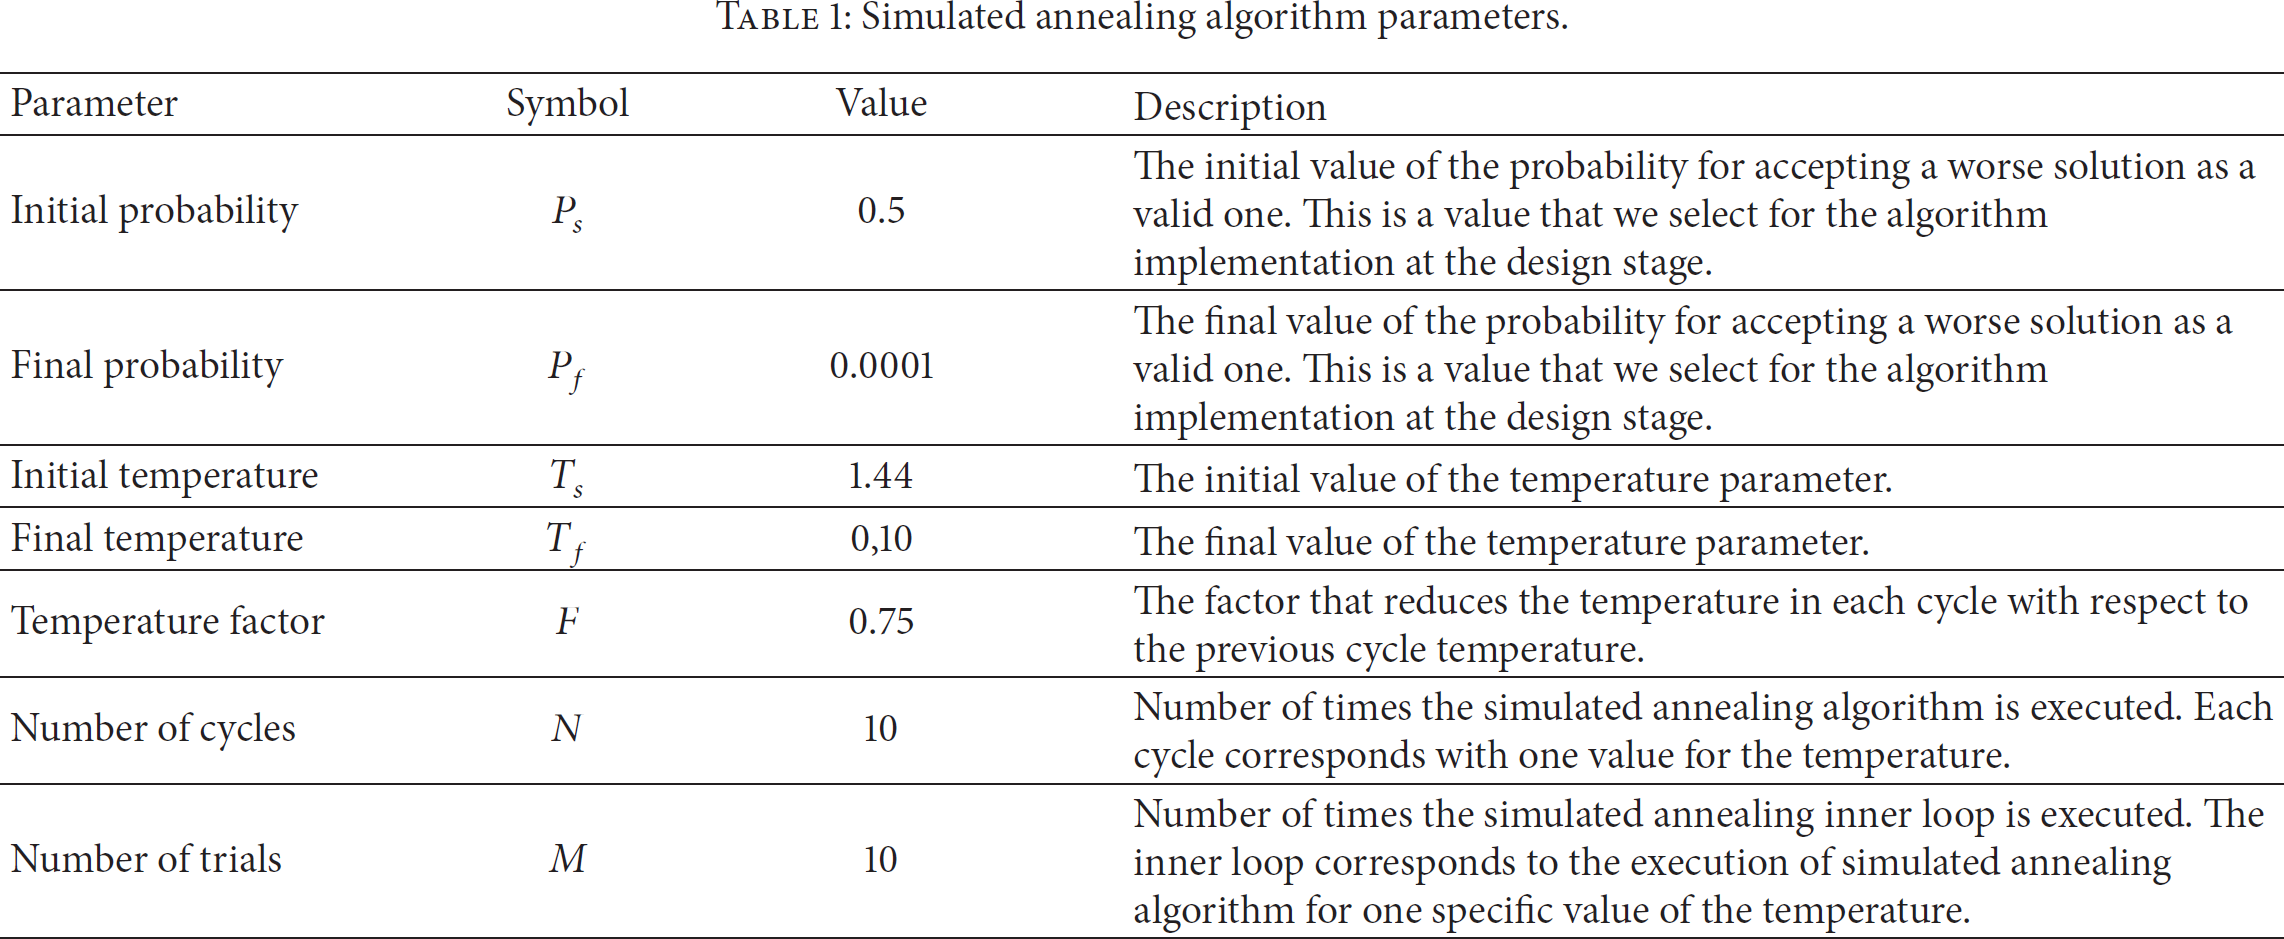
Simulated annealing uses several parameters according to [37]. These parameters are shown in Table 1 together with the values selected for our implementation. The reason for selecting these values is later explained in this section.
Simulated annealing algorithm parameters.
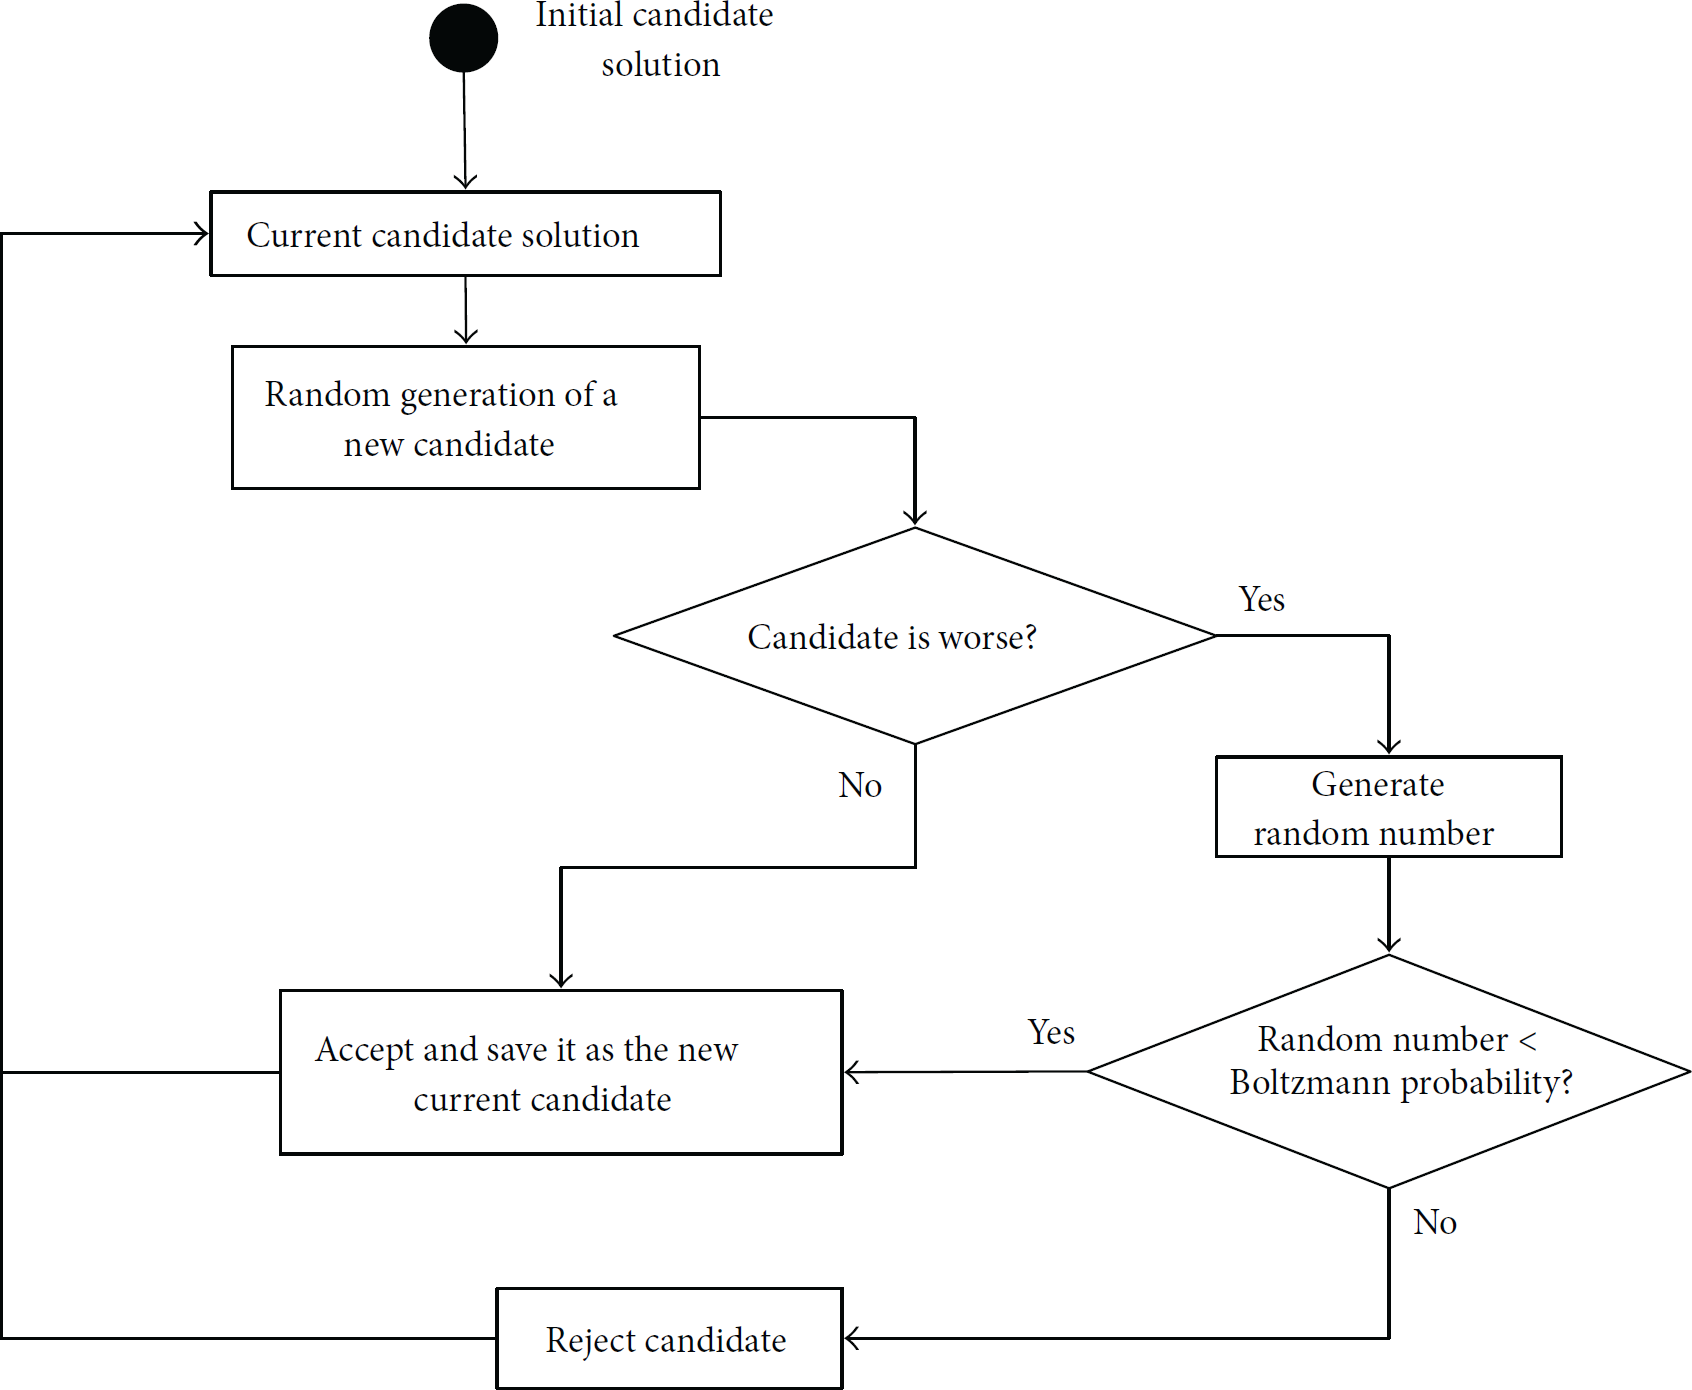
The main idea behind simulated annealing is that it generates randomly possible candidate solutions. If the candidate is better than the previous accepted solution, then the new candidate replaces the accepted solution. If the candidate is worse, a random number is generated. In the case where the random number is smaller than the Boltzmann probability, then the candidate is accepted despite being a worse solution than the previously accepted one; otherwise the candidate is rejected.
The original Boltzmann probability equation for the annealing of solids is used for this algorithm but with slight changes. The Boltzmann probability for the simulated annealing algorithm is defined by the following expression:
T: it represents the temperature. Initial and final temperature values are selected as design parameters. The effect of the temperature on the algorithm is that with every cycle of the algorithm the temperature decreases and thus is more difficult to have worse solutions accepted as candidates.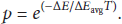
The simulated annealing implementation developed consists of two loops. The outer loop represents the cycles or iterations of the algorithm; there is only one value of temperature per each cycle and the temperature is decreased between cycles by multiplying the current cycle temperature by the temperature factor shown in Table 1. The inner loop follows the procedure shown in Figure 16 with the specific temperature value of the cycle. This inner loop represents the behavior of the solid's atoms when moving towards the lowest energy state for a specific temperature value. In our implementation, this represents the search for the best UAVs positions for a specific value of the Jaccard.
Simulated annealing algorithm implementation.
For the simulated annealing implementation, values for the initial probability (
6. Simulation Results
We present in this section the settings used for the simulations of the UAVs self-deployment over the disaster scenario. Also, we provide the results obtained by the different algorithms related to the number of victims serviced and the network connectivity. Finally we present some images showing the UAVs positions on the disaster scenario at different simulation time steps.
6.1. Environment Settings
In this section we present several details about the settings we have used for running the simulations of the proposed UAVs self-deployment over the disaster scenario. We have set the disaster scenario according to the following considerations:
The simulated incident site consists of a square shaped area with sides equal to 1000 m, with 295 victims located in different regions. There are two groups of victims that disappear from the scenario suddenly, at The victims' mobility model works with a discrete time basis. The minimum time step for the simulation of victims' movements is set to 1 second. For generating the disaster scenarios models we have used the tool BonnMotion [17]. The mobility models used for generating different scenario regions are the random waypoint model [8], the Manhattan Grid model [29], and the Disaster Area Model [6]. We have created our own software tools based on Java and Python programming languages in order to combine the regions and generate the disaster scenario and the victims' mobility as a whole. The UAVs initial positions are distributed over a virtual small region centered in the disaster area center. This initial distribution positions the UAVs uniformly keeping them at the same distance of their closer UAVs. We have run simulations with Jaccard neighbors values equal to 2 and 1. When each UAV has a couple of Jaccard neighbors the UAVs disconnection from their Jaccard neighbors is more unlikely, as if one UAV suffers from a failure there is another one to keep the connection. When there is only 1 Jaccard neighbor per UAV the FANET spreads out even more but the disconnections are more likely to happen. We have developed a software simulator that takes as inputs (i) the disaster scenario file with the victims mobility traces, (ii) the amount of victims within the disaster area, (iii) the duration of the simulation, (iv) the number of UAVs composing the FANET, and (v) the artificial intelligence algorithm parameters. This software simulates the UAVs self-deployment in the disaster scenario and generates as outputs a text file with the mobility traces of the UAVs and related information about the network conditions such as distance between the UAVs and Jaccard distances. The simulations carried out have a duration of 600 seconds. The problem modelled has a random nature due to the victims' movements. Also the artificial intelligence algorithms implemented are probabilistic heuristics, with random behaviors. Thus, the results presented in this section are averaged from sets of simulations runs.
Regarding the UAVs tactical movement rules, we have made the following considerations:
6.2. Serviced Victims
In Figure 17 the serviced victims during the entire simulation are shown for each of the algorithms described in Section 5. As we can observe, the random walk-based algorithm is the one producing the worst performance. This is obvious as this algorithm does not actually search for the best solution for servicing as many victims as possible.
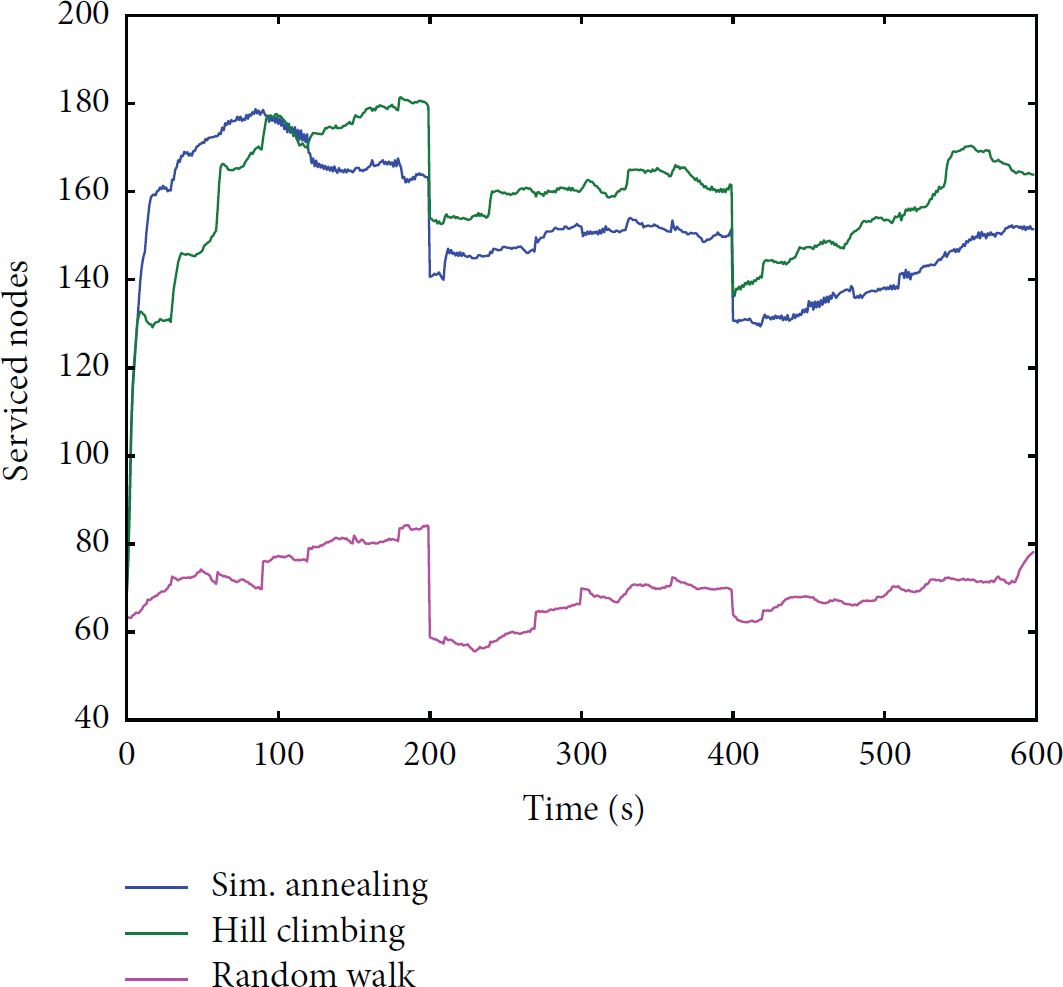
Serviced victims by the different computational intelligence algorithms.
By comparing the simulated annealing and the hill climbing algorithms shown in Figure 17, we can observe that there is a slight difference between both of them (for the particular case shown in the figure). At some points of the simulation, the simulated annealing algorithm shows a better performance than the hill climbing and at some other points the situation is the opposite. Both of them perform similarly with a small difference: the hill climbing algorithm is servicing 10 victims more than the simulated annealing algorithm after the first stage of the simulation. As it is known for the hill climbing algorithm, this could get stuck in local maxima. The behavior shown in the results by the hill climbing algorithm makes us think that there are no local maxima in our fitness function and so the hill climbing algorithm performs similar to the simulated annealing algorithm and slightly better for this particular case. The fact of the simulated annealing algorithm being slightly below the hill climbing algorithm could be due to the fact that the simulated annealing, per definition, accepts worse candidate solutions in order to escape local maxima.
As we can see in Figure 17, the scenario has two sudden changes where groups of victims disappear from the scenario. These changes occur at
There is also a common behavior shown by both the simulated annealing and the hill climbing that is worth mentioning. Both algorithms actually spread out the UAVs network and in this process they present two main behaviors: (i) a tendency for increasing the number of serviced victims and (ii) slight oscillations around some values. We notice that in Figure 17 in the time frame between 0 seconds and 200 seconds there is a clear tendency to increase the serviced nodes, as a result of the FANET initial self-deployment. Within this time frame the network reaches its highest value of serviced nodes which is between 160 and 180 (between 54% and 61% of victims are serviced with respect to the total number of victims in the scenario, which is 295). From the instant of 200 seconds up to the instant of 400 seconds the algorithms have slight oscillations around the numbers of 150–160 serviced nodes (around 56% of victims are serviced, when the total number of victims is 275, after the first 20 victims disappeared from the scenario). Finally, from the instant of 400 seconds up to the end of the simulation there is an increase tendency that ends up in servicing between 150 and 160 victims (around 60% of victims are serviced from a total amount of 255 victims, after the second group of 20 victims disappeared).
As we have described in previous sections, the disaster scenario has a random nature and the artificial intelligence algorithms implemented as well. It is logical then to find oscillations around specific values, which may be due to the fact of victims entering and going out of the UAVs coverage area. Despite these oscillations, the strategy proposed shows that the UAVs network actually spreads out and responds to the scenario changes.
6.3. Network Connectivity
The second objective for the tactical movement rules proposed is to keep the UAVs network always connected. As described in Section 5.2 the fitness function has a component that penalizes the network disconnections by giving this function a value of −1 when there is a network disconnection. In Figure 18 we show the artificial intelligence algorithms together with their respective fitness functions values. As we can observe in Figure 18 at no point of the simulation the fitness function takes the value −1. This is a signal that the UAVs network does not suffer from disconnections.

Computational intelligence algorithms and fitness (blue dashed line).
Although the random walk-based algorithm does not need the fitness function in order to optimize it, we have also evaluated it to see if there are disconnections for this algorithm. There are not disconnections for this algorithm as the disconnection avoidance procedure also applies to it.
6.4. UAVs Locations
In Figures 19, 20, and 21, the UAVs positions are shown for different time steps of the simulation where the dashed red lines represent the UAVs coverage areas. These figures correspond to a specific simulation using the simulated annealing algorithm. In Figure 19, we can see how the UAVs are close to each other at the beginning of the simulation. In Figure 20 we can observe how the network has been spreading out during the first part of the simulation and thus the area covered by the UAVs network is bigger. This corresponds to a larger number of victims serviced by the FANET. Finally, in Figure 21 we can see the UAVs positions at the end of the simulation. We can notice that the changes from Figures 20 and 21 are slighter than the ones observed from Figures 19 and 20. The reason is because when the UAVs are starting to spread out the UAVs move faster and change their positions to the optimal locations in order to service the maximum number of victims while maintaining the network connected. When the UAVs are already spread out, they change their positions more slightly in order to avoid having UAVs disconnections, as they may be located already closer to the limit of their Jaccard neighbor's coverage areas. Although the movements are smaller, we can notice from Figures 20 and 21 that there are changes in the locations of the UAVs black and pink with respect to the scenario layout. We can also see these small changes in the coverage areas of Figure 21, which are displaced towards the lower part of the scenario where the major accumulation of victims is located (the bottom-left corner).
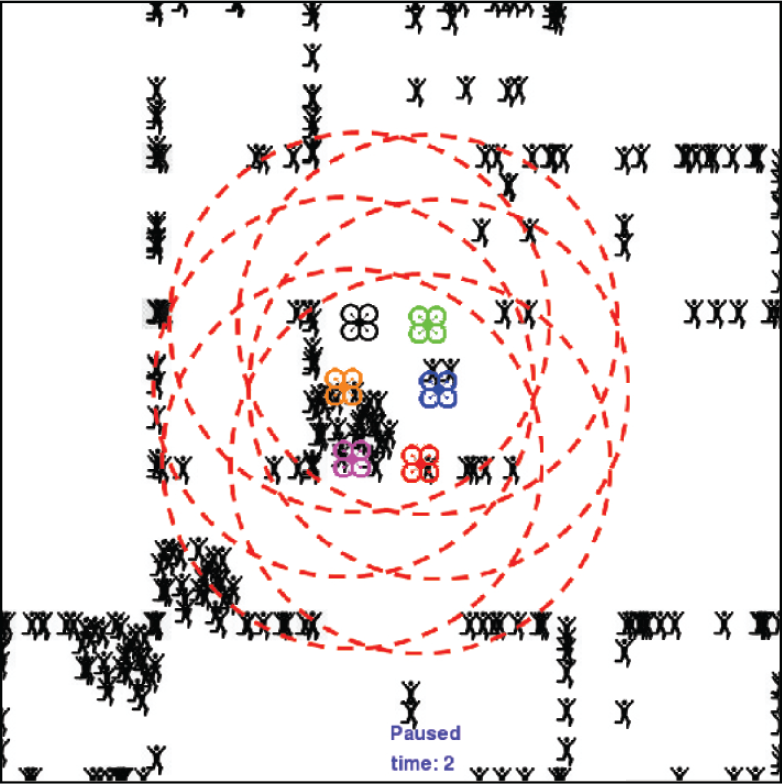
UAVs positions at simulation time equal to 2 seconds.

UAVs positions at simulation time equal to 43 seconds.

UAVs positions at simulation time equal to 589 seconds.
As we can see in Figures 19, 20, and 21, there are victims that have not been discovered during the AANET self-deployment. With this scenario and the selected simulation settings (number of UAVs, coverage area, etc.), it is not feasible to cover the entire scenario area without disconnecting the AANET. As a future work, we plan to include new behaviors to the UAVs in order to allow them to explore unknown areas. This could be implemented as an additional algorithm for selecting periodically some “explorer UAVs” from those flying close to the AANET border. An “explorer UAV” would have the role of periodically leaving the AANET in order to explore unknown areas. This type of UAVs would remember the latest position when they were part of the AANET in order to return to it. These UAVs could bring valuable information to the AANET about new victims discovered and their positions and feed the artificial intelligence algorithms for the self-deployment. Such idea has been used in other works such as exploring behavior of the UAVs described in [38].
7. Conclusions
We have addressed the problem of modelling a UAVs network self-deployment on a disaster scenario. The main aim of the UAVs network is to provide communication services to the victims and rescue workers within the incident site of a disaster area. This is translated in more specific objectives which are to maximize the number of victims serviced by the FANET and maintain the network connectivity. We have proposed an innovative approach to perform the self-deployment calculating the UAVs movements as a basis of the Jaccard distance among the UAVs and artificial intelligence algorithms that optimize the number of victims serviced by the network. As there are no realistic mobility models for representing the victims' movements within the incident site of a disaster area, we have proposed our own model as a combination of regions with different mobility features. The UAVs network self-deployment and the victims' mobility model were simulated jointly on software built specifically for this purpose. We have analyzed the results provided by the different artificial intelligence algorithms implemented, showing that the simulated annealing and hill climbing algorithms really carry out the UAVs self-deployment and aim to maximize the total number of serviced victims. The results obtained showed that for a network of 6 UAVs and 295 victims the percentage of victims serviced is around 60% of the total. As future work, we plan to make improvements in the disaster scenario model by including more detailed urban features and also creating more complex victims' mobility models. Also, we plan to include additional behaviors to the UAVs that allow them to be more efficient in their self-deployment, for example, including an exploring behavior so they are able to discover unknown areas of the scenario.
Footnotes
Conflict of Interests
The authors declare that there is no conflict of interests regarding the publication of this paper.
Acknowledgments
This work was supported in part by the University of Seville under the Ph.D. Grant PIF (Personal Investigador en Formación) of D. G. Reina and by the Junta de Andalucía Contract of J. Sánchez-García under the Project P11-TEP-7555.