
Abstract
In the process of fulfilling k-coverage over target nodes, a large quantity of redundant data may be produced, which will cause network congestion, reduce communication efficiency, impair coverage quality, and exhaust network energy quickly. To solve this problem, the paper proposes an Energy-Efficient k-Coverage Algorithm (EEKCA), which attempts to construct a network coverage model by utilizing the relative positions of nodes. Through analyzing the model, the coverage expectations for nodes in the monitored area and the minimum number of nodes required for full coverage are computed. As for power consumption, the paper presents an energy shifting function between working nodes and neighboring nodes, by use of which the scheduling for low-energy node is completed, balancing the energy consumption over the entire network and optimizing network resources. Finally, simulation results suggest that the proposed algorithm not only can improve the coverage quality of network but also can prevent the rapid depletion of node energy, thus achieving the goal of extending network lifetime.
1. Introduction
Wireless sensor network [1] (WSN) is a new type of ad hoc network architecture consisting of thousands of sensor nodes [2, 3]. Each node can fulfill certain functions such as perceiving [4], computing [5], communicating [6], and storing [7, 8]. By gathering sensory information from physical environment and transmitting them through multihop routing [9], these nodes integrate physical world with information world [10, 11], creating a chain-like network service system which combines data collection, storage, computation, and transmission [12, 13].
Coverage quality and power consumption are two chief indexes to evaluate the performance of WSN [14]. Coverage quality depends on the way that nodes are deployed over a region of interest [15, 16]. Network lifetime, which is closely linked with the energy consumption of nodes, directly affects the quality of service (QoS) of the whole network [4, 17]. Generally, nodes are distributed randomly over a region due to complicated terrain conditions and harsh environment limitations. As precise location information cannot be acquired in advance, one monitoring area may be put under the sensing range of more than one node, causing k-coverage, as is the case in military battlefield shown in Figure 1, or it may become a blind spot where no sensing signals can be received and which calls for additional nodes for coverage. Firstly, when k-coverage exists, a large quantity of redundant data is certainly to be produced during the process of data collection, computation, and transmission, which will make the whole WSN more vulnerable to error and uncertainty. Secondly, the goal of coverage is not to have each point in an area under supervision but to merely focus on a set of targets instead, so an undifferentiated area coverage scheme ignorant of the precise location of targets will cause waste of energy and bring down the system more quickly. Thirdly, in a random distribution scheme, it is inevitable that an area may be packed with an excessive number of nodes, causing bottle-necking effect and information redundancy in communication channel and impairing network expansibility.

Topological graph for coverage in military battlefield.
To address the problems above, the paper proposes an Energy-Efficient k-Coverage Algorithm (EEKCA), which intends to solve the coverage rate and expectation coverage of a sensor node with a sector area formed while mobile sensors are moving across monitoring area. As for power consumption, the paper presents the solution to multipoint transmission and single-point transmission. Provided that a required coverage rate is reached, when a working mobile target node is moving across k-coverage area and its energy consumption is within or above the upper limit of the threshold values, the node will be switched to sleeping mode under self-adaptive switching scheme, while other sensor nodes are using node energy scheduling mechanism to finish the conversion process for sensor node energy in order to improve the network life cycle.
A is the base station. There are five sensor nodes in all in the monitored area. The pentagrams mark target nodes. From Figure 2, it can be seen that the sensor layer includes 5 interconnected sensor nodes, which are ordered to collect different types of data and form several clustering structures by certain rules. Node A is called Sinks layer, the primary function of which is to equip sensor nodes at the layer with more powerful computation, storage, and energy supply capability and to send data collected at the layer to base station. Each node at the sensor layer covers several target nodes, thus forming the correspondence between nodes and target nodes. Node B corresponded to the region between target node 1 and node 2; Node C corresponded to the region between target node 2, node 5, node 6, and node 8; Node D corresponded to the region between target node 7 and node 8; Node E corresponded to the region between target node 2, node 3, and node 5; Node F corresponded to the region between node 3, node 4, node 5, and node 6. Through the correspondence, we can obtain the minimum target set

Topological graph for k-coverage.
When more sensor nodes are added, one target node may be covered by and corresponding to several sensor nodes, a case we call k-coverage. For example, node 2 and node 5 are under k (k = 3)-coverage, and node 6 and node 8 are under k (k = 2)-coverage. When the coverage of a target node exceeds itself, a large number of redundant nodes are to be generated, which will exhaust the energy of the whole network system quickly and shorten the lifetime of the network. In order to avoid the redundancy of nodes, it is necessary to keep each node at different status and to realize shift between different states.
2. Network Model and Coverage Quality
In order to better facilitate the analysis of the coverage problem of WSN, the following hypotheses are proposed [18, 19]:
All the sensor nodes are in isostructure; the sensing radius and transmitting radius are in circular shape. Each sensor node can acquire its location information through GPS. All the sensors have the same initial energy and sensing radius and are time-synchronized. All the sensor nodes are randomly deployed over a square region with l on each side. It is ensured that the sensing radius of nodes is no longer than l, boundary effects being neglected.
2.1. Basic Definition
Definition 1 (full coverage).
Provided that all the nodes in the detected region are covered within the sensing range of at least one sensor, that is to say, the Euclidean distance between the sensor node and target node is less than the sensing radius of sensor node,
Definition 2 (k-coverage).
When any target node in the monitored region is covered by at least k number of sensor nodes, we say that the targets are under k-coverage, and the monitored region is called k-coverage area.
Definition 3 (coverage quality).
The coverage quality equals the ratio of the sum of the sensing areas of all sensor nodes to the area being monitored. It, to some degree, reflects the extent of coverage over target nodes.
Definition 4 (multilevel coverage).
Consider

2.2. Network Model
To analyze the coverage of WSN, a network model with l-meter square monitoring area and a sector coverage area is being built, as shown in Figure 3.
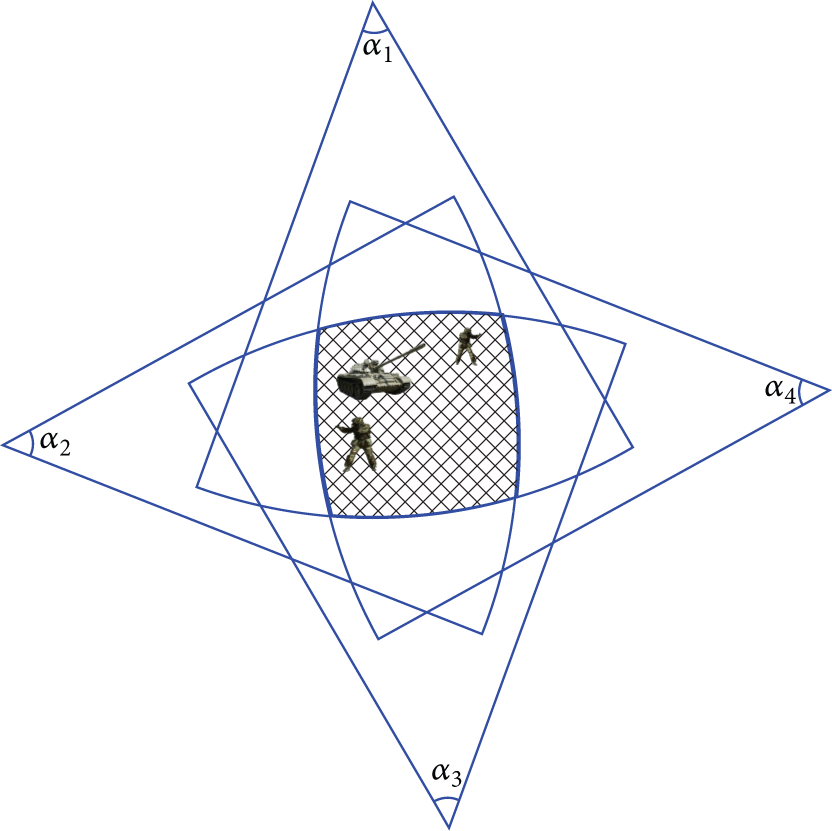
Network model with k-coverage.
In Figure 3, the monitored area is a square with l meter on each side, and the coverage area for a sensor node is a sector. The angles between four sector areas are given in radian measure. Tanks and soldiers (target nodes) are being placed under k-coverage (


When the target nodes remain within the coverage area of sensor nodes, the coverage rate of the entire network is

Theorem 5.
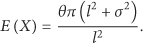
The expectation for a target node to be covered is
Proof.
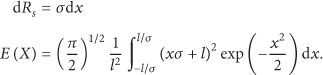
Since sensor nodes distributed randomly over the monitored area follow uniform distribution pattern, the coverage of any sensor node is


Corollary 6.
With a given coverage rate, when one can complete multilevel coverage over the monitored area with a minimum number of sensor nodes, the coverage expectation is
Proof.
All the sensor nodes randomly deployed over the monitored area are independently located. According to Definition 4 and Theorem 5, the expectation for any target node to be covered by at least one node in the coverage set is
If there are n working nodes in the coverage set, the expectation for any target node in the monitored area to be covered by multilevel coverage is

With a given coverage quality, there must be an extremely small number ε, which guarantees that when the expectation for multilevel coverage is smaller than ε, the limit exists; that is,
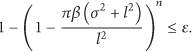
Solve it:

When the monitored area is under effective coverage, the expectation for the monitored area to be covered by a minimum number of sensor nodes is
Theorem 5 and Corollary 6 demonstrate the process to compute the coverage expectation and multilevel coverage expectation. Normally, a sector will be formed when the target nodes are moving under the coverage of sensor nodes. The coverage expectation can be readily computed by probability theory and geometric theory. But how to derive the coverage expectation when mobile targets move into the monitored area for the first time is an issue that needs to be solved; hence we introduce Theorem 7.
Theorem 7.
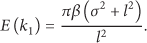
When the mobile target enters the monitored area for the first time, the expectation for the mobile target node to be covered for the first time is
Proof.
Based on the probability theory, let X be the number of times that mobile targets change their position;

From the equation on coverage expectation, we have

Let

2.3. Energy Transfer
The power of operating sensor nodes in the monitored area will inevitably deplete after working for t period of time [20–22]. The energy consumption will result in the reduction of coverage area. Therefore, in order to minimize the power consumption and maximize network lifetime, the paper utilizes a model to analyze the energy consumed by sensor nodes while fulfilling unilateral and multilateral transmission. Neglecting the energy consumed for computation, storage, and controlling, we can obtain the energy consumption model for the transmitting terminal of a node which is

The energy consumption model for the receiving end is

3. Algorithm Descriptions and Analysis
3.1. State Transformation Algorithm
In order to enhance the energy efficiency of nodes, the paper adopts node state scheduling strategy, which allows nodes to work under the following three states: sleeping, waiting, or active. Under sleeping mode, sensor nodes switch off the redundant modules to minimize the waste of energy and nodes are awakened periodically to intercept radio information by cluster head nodes. Under waiting mode, nodes can perceive surrounding targets to detect the arrival of mobile targets, compute their distance, and so forth. Nodes periodically compute their participatory monitoring weight. Under active mode, all nodes are in operation to fulfill a range of tasks, such as detecting the arrival of target nodes and collecting and sending target information. Under this state, nodes are consuming the maximum amount of energy.
Node state switching mode works as follows: When the network is initialized, the cluster head nodes are under active state, while the member nodes are under sleeping state; the sleeping nodes are awakened periodically to detect whether cluster head nodes have sent state scheduling orders. If receiving such order, the sleeping nodes will be switched to waiting state, or else they will continue sleeping. The waiting nodes periodically compute their participatory monitoring weight. If the weight is larger than or equal to its threshold, the node will be switched to active mode to participate in the monitoring of mobile targets; if the waiting node receives information sent from cluster head nodes, it will be switched to sleeping mode. The nodes under active state also periodically compute their participatory monitoring weights. If the weight is smaller than its threshold, the active node will be switched to waiting state, or it will keep its original state. The process through which nodes are switching in different modes is as shown in Figure 4.
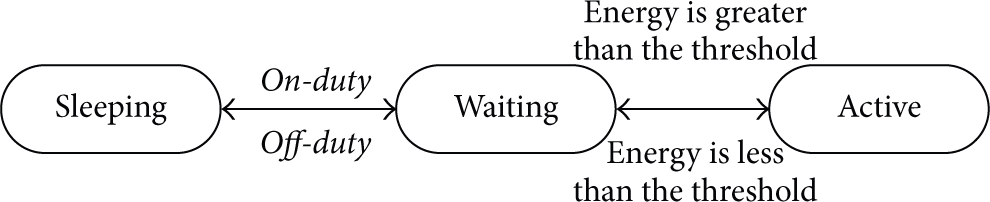
Node energy transition diagram.
3.2. Algorithm Design Idea
In EEKCA algorithm, we establish a set composed of neighboring nodes within the sensing range of sensor nodes and divide all the nodes into several subsets, with the fully powered nodes with comparatively strong capability of computation and communication as managing nodes and other nodes as member nodes. When the network is initialized, a node is chosen as managing node arbitrarily since the attributes of all nodes are the same. Member nodes send a “Coverage” message to managing node, which allots a memory space based on their own characteristics to store the received messages in the chain table CL. “Coverage” message mainly includes the attributes and current status of member nodes, such as energy changes, ID information, and the coverage condition over targets. One or several cycles later, with all the information collected from member nodes, the managing node can rank the member nodes according to their residual energy and expected coverage value and store them in the chain table. Assign weights to the member nodes based on their ranking to make the nodes ranking ahead with heavier weights than those ranking behind. The managing nodes will analyze the coverage condition over target nodes and seek from chain table for most eligible member nodes and mark them. Then a “Notice” message will be sent to these member nodes to schedule other nodes to collaboratively fulfill ideal coverage.
3.3. Algorithm Description
EEKCA algorithm shall be fulfilled in 7 steps.
Step 1.
Firstly calculate the coverage expectation of all member nodes in each set, noted as
Step 2.
The manager node stores all the information collected from member nodes in CL chain table. The “Coverage” message shall include the ID information, energy information, and information about coverage expectation.
Step 3.
One or several cycles later, the managing node can rank the member nodes according to their residual energy and expected coverage and store them in the chain table. Assign weights to the member nodes based on their ranking to make the nodes ranking ahead with heavier weights than those ranking behind.
Step 4.
Check whether member nodes cover target nodes and mark eligible member nodes.
Step 5.
Find member nodes in chain table. When the residual energy of one member node is higher than threshold value
Step 6.
If a target node is being covered by k members of nodes simultaneously, the managing node will browse through the chain table again to seek for eligible member nodes and shut them off.
Step 7.
After the completion of browsing, the managing node will screen the most eligible node by self-adaptive mechanism and start this node to finish coverage, or turn to Step 2.
3.4. Algorithm Code
See Algorithm 1.
( ( ( ( ( ( ( ( ( ( ( ( ( ( ( ( ( ( ( ( ( ( ( ( ( ( ( ( ( (
Algorithm 1
3.5. Complexity Analysis
Theorem 8.
Under optimal condition, the algorithm complexity of EEKCA algorithm is
Proof.
EEKCA fulfills the task switch between member nodes by receiving and sending different types of information and identifies the most eligible node by browsing through chain table. If EEKCA algorithm finishes the coverage over target nodes in one or less than one cycle, then the complexity of the algorithm is
4. Architecture Assessments
In order to validate the effectiveness and stability of the proposed algorithm, the paper takes MATLAB7 as simulation platform and compares it with other four algorithms in [13] (Energy-Efficient Target Coverage Algorithm, ETCA) and [4] (linear programming maximum lifetime coverage with energy harvesting, LP_MLCEH), [14] (Event Probability Driven Mechanism, EPDM), and [17] (Optimization Strategy Coverage Control, OSCC). The experiment environment consists of WIN XP, RAM 2 G, Double-core CPU, 1.7 G. Simulation parameters are listed in Table 1.
Simulation parameters.

Experiment 1.
Give the coverage rate with different k value within a
Figure 5 presents the change curve of sensor nodes and coverage rate under different k value within a

k-coverage change curve.
Experiment 2.
In order to verify the efficiency of the proposed algorithm in extending network lifetime, we compare EEKCA algorithm with ETCA algorithm and LP_MLCEH protocol. The experiment data is the mean value of 200 times of simulation, as shown in Figures 6, 7, and 8.


In the experiment, with different k, we change the number of nodes randomly distributed within the monitored region to change the scale of network. For a small-scale monitored area, 20 nodes are deployed initially. Then more nodes are added gradually. It can be seen from the simulation chart that the lifetime of WSN extends as the number of sensor nodes increases, which is mainly because the member nodes in node set take turns to cover the target nodes under a scheduling scheme. Under the same network environment, EEKCA algorithm extends the network lifetime by 13.71% and 16.52% as compared to ETCA algorithm and LP_MLCEH protocol, respectively. For a large-scale monitored area, 50 nodes are deployed initially and more nodes are added gradually. The lifetime of WSN also extends as the number of sensor nodes increases, though not as distinct as that in small-scale area. Under the same network environment, EEKCA algorithm extends the network lifetime by 15.13% and 17.27% as compared to ETCA algorithm and LP_MLCEH protocol, respectively.
Experiment 3.
A comparison of coverage rate between EEKCA algorithm, EPDM algorithm in [14], and OSCC algorithm in [17] is made. With a


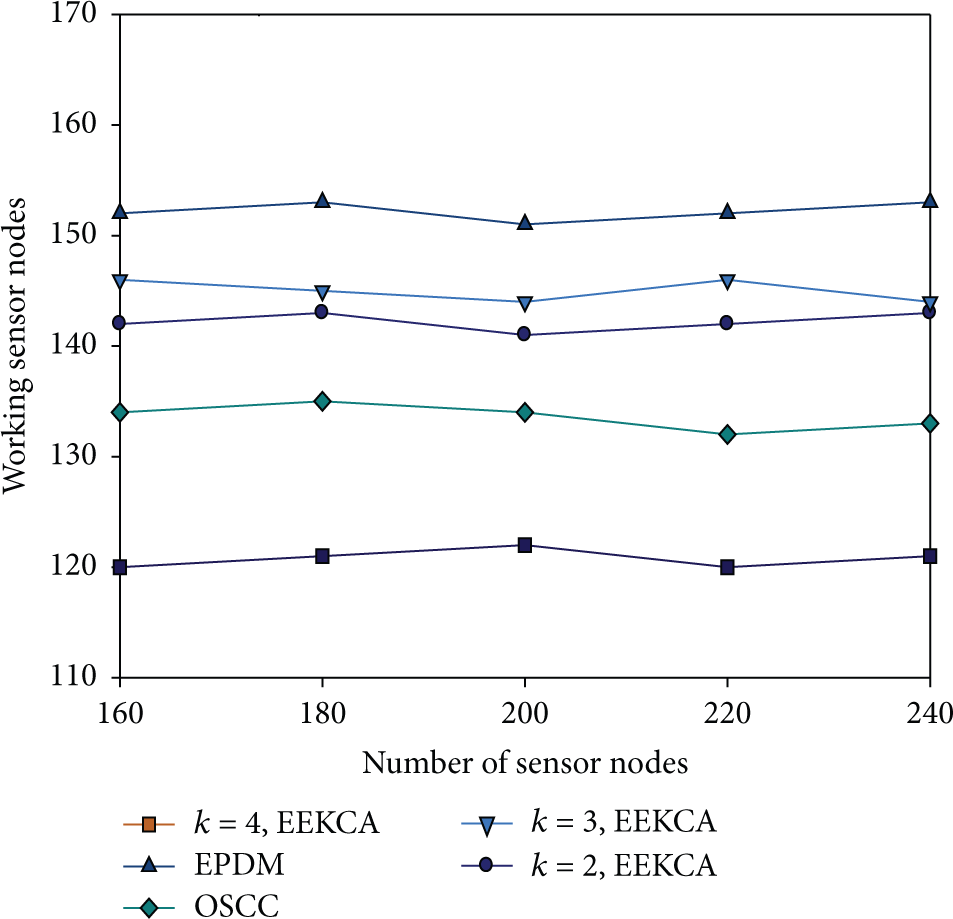
Comparison between number of working sensor nodes and all sensor nodes.
As shown in Figure 9, with the increase of the number of sensor nodes, the coverage rate increases in all three algorithms. With a coverage rate of 99.9%, when
When the number of sensor nodes is kept between 140 and 180, the working nodes in all three algorithms do not change much. When
5. Conclusions
Based on an analysis of the coverage characteristics of WSN, the paper proposes an Energy-Efficient k-Coverage Algorithm (EEKCA). The algorithm proposes a method to calculate the coverage expectation with a sector and gives the process to fulfill the coverage with the minimum number of sensor nodes. In the meantime, the algorithm also gives the way to calculate and deduce the expectation for the first coverage over mobile target nodes. As for power consumption, the paper demonstrates the detailed process to reduce energy and proves through calculation that multilateral transmission consumes less energy than unilateral transmission. Finally, the paper conducts simulation experiments to testify that the proposed algorithm is more effective and stable than LP_MLCEH protocol, EPDM algorithm, and OSCC algorithm in network lifetime and network coverage.
Footnotes
Competing Interests
The authors declare that there are no competing interests regarding the publication of this paper.
Acknowledgments
The authors acknowledge the support from Projects (61503174, U1304603) supported by the National Natural Science Foundation of China, Projects (2014B520099, 2014A510009, and 15A413016) supported by Henan Province Education Department Natural Science Foundation, and Projects (142102210471, 142102210063, 142102210568, 162102210113, and 162102410051) supported by Natural Science and Technology Research of Foundation Project of Henan Province Department of Science. This paper is also supported by the National Scholarship Fund.