
Abstract
We empirically investigate the factors affecting the quality of information obtained by randomly sampling nodes from a network embedded in two-dimensional space. The motivation for this work is that wireless and other physical networks do in fact have embedding of their nodes in space, although analyses of random walks on such networks often only consider the link structure while ignoring node locations. Of independent interest is the measure we propose to evaluate the quality of sampling: the rate of decrease in the area of the largest empty circle remaining.
1. Introduction
Sampling information from nodes of a network is a well-considered and important problem. The problem particularly has many applications to wireless sensor networks where it may sometimes be necessary to monitor the data of the sensor nodes (e.g., temperature sensors dispersed in a forest used to detect forest fires). In very large nonphysical networks such as online social networks random sampling is useful as a mechanism by which the social network application can gather user statistics. In the physical internet, random sampling may also be used to gather network and user statistics, which, among other applications, may help detection of suspicious activities in a subnetwork. The uses and applications of sampling (random or other) from networks (physical or other) are numerous to mention [1–5].
While nonrandom and biased sampling algorithms may perform well under certain conditions, the performance of random sampling from a network, as implemented via a random walk, is indicative of the network related factors that affect the sampling quality and has many advantages due to obliviousness. For example, random walks have no critical points of failure and are completely local, requiring no global information. Moreover, due to the lack of bias in the method, a random walk can be used as a kind of control to test how the network related factors affect the sampling quality and efficiency. The mixing time of a random walk is the analytical measure of the time it takes for a random walk to reach a truly random sample. Technically it is the worst case time taken to reach the stationary distribution from an arbitrary starting node [5,6]. For a given network, the mixing time is a property of the edge connectivity of the network's nodes, has fundamental relationships with the network's resilience and eigenvalues, and has been well-studied for many graph classes. It is well-known, for example, that graphs whose edge relationships are chosen randomly, such as Erdös-Rényi and random regular graphs, exhibit optimal mixing time [7–9] whereas graphs whose edge relationships are determined via local properties, such as grids and random geometric graphs, exhibit bad mixing time [1,2]. Therefore, in general, the randomness of the edge connectivity can be expected to ameliorate the sampling quality whenever the network is defined only via the edge connectivity matrix (called adjacency matrix) and sampling quality is measured relative to sampling of random nodes quickly.
However, many real-world networks are not defined solely by their adjacency matrix of edge connectivity but also by other relevant node-specific information, such as the location of a sensor node in space for a wireless sensor network, or user-specific information for an online social network. The importance of the location of a node should not be undermined, particularly for applications in which a physical quantity must be measured by sensor nodes. For example, if sensor nodes are distributed across a forest for an application in which a forest fire must be detected via temperature and humidity measurements, the location of the nodes from which the measurements are sampled is critical. Less critical instances of the importance of node locations may include sampling opinion data from a social network, as unintentionally ignoring a large contiguous geographic region may yield inaccurate overall predictions.
As many physical networks in general and sensor networks in particular exist on a two-dimensional surface (without loss of generality), in this work we take the location based information into particular relevance. Therefore, for geographic networks, we must reformulate the meaning of sampling quality and efficiency as sampling a node uniformly at random may no longer be the most appropriate indicator of quality sampling of the information residing in the geographic space. Rather, as motivated above, we wish to further ensure that large contiguous regions of space are not ignored as the sampling proceeds. As such, we make the reasonable assumption that there is no point in space which is of zero importance compared to any other point, which is a weaker assumption than all points in space having equal importance for the sampling. As the measure of a finite set of (visited) points is always zero compared to the measure of the space, one must yet specify what kinds of spatial regions we are taking into account in terms of unvisited regions.
Figure1 illustrates different kinds of empty spatial regions that may be defined on the same point set. The image of Figure1(b) illustrates why restricting to convex regions is necessary, as one may always draw a huge but nonconvex space filling curve that avoids any given finite point set otherwise. The image of Figure1(a) further demonstrates why considering empty regions that are similar in both dimensions is important, as it is also otherwise very easy to embed large convex areas that are very long in one dimension but small in another dimension. Therefore, in this work, we propose a natural measure based on circular regions, as illustrated by Figure1(c), due to the convexity and symmetry of the shape in addition to the elegant computability of the related computational geometry problem via the well-studied Delaunay triangulation [10]. We rely on the empty circle property of the Delaunay triangulation: a circle that contains the three vertices of any Delaunay triangle does not contain any other points of the input set in its interior. It is an unexplored region. We take the following as a measure of the quality of the random walk based sample: the rate at which the largest empty circle area diminishes (the LEC is defined only on visited points of the sampling procedure, e.g., visited points of the simple random walk). A Delaunay triangulation with largest empty circle is illustrated in Figure2. Whereas measuring largest empty circles is a well-studied computational geometry problem with applications to meshes, we are the first to our knowledge to apply it to the measurement of sampling quality from geographic networks.

Given the same point set, measurements are (a) wide in one dimension and narrow in another, (b) nonconvex, and (c) possibly representative of unexplored regions.
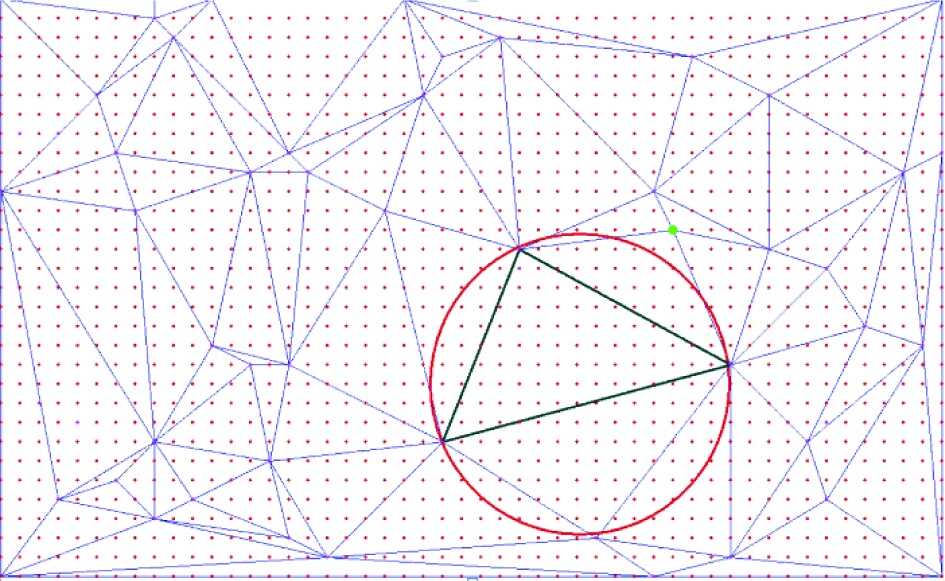
The largest circle is derived from the Delaunay triangulation of a given set of points. The largest circle provides a meaningful way of quantifying the unexplored region of the triangulation.
In addition to proposing a natural new measure of sampling quality relevant to geographically embedded networks in particular, we use our measure to compare what network related factors affect the geographic sampling quality. Although our measure of sampling quality is explicitly geometrically defined, it is also dependent on purely graph-theoretic sampling properties, as the sampling process considered is still network dependent. Therefore, we evaluate the mixing time as measured via eigenvalues, to see how the edge connectivity structure affects the geographic sampling quality. We emphasize, however, that one novel aspect of this work is that we also measure how the node distribution structure affects the geographic sampling quality by performing experiments in which node locations are permuted while keeping edge connectivity the same.
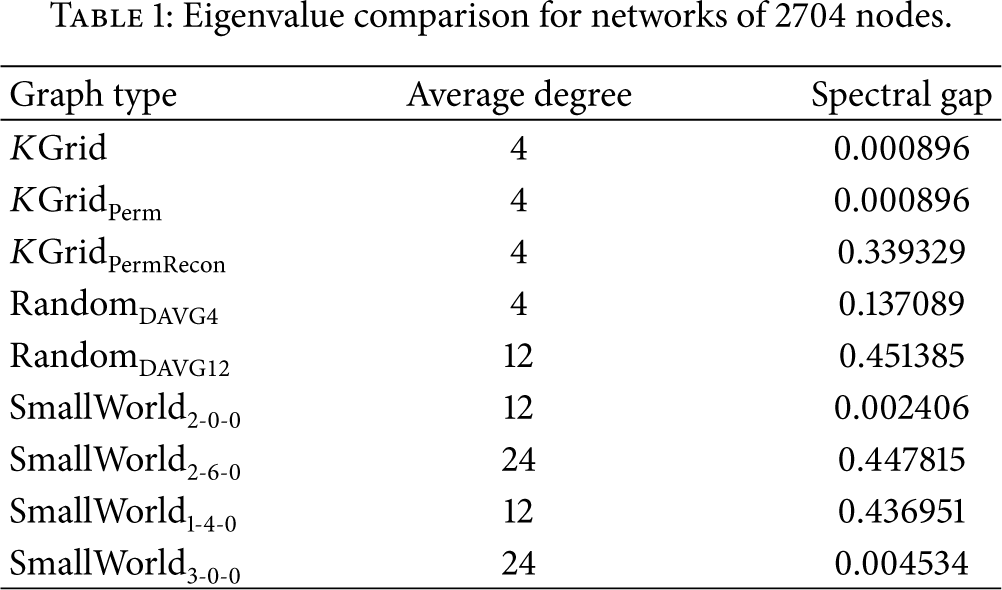
The different network types we consider are parametrized with respect to connectivity and expected mixing times, with eigenvalue measurements also explicitly represented in Table1. Of course, given the desired applicability of our results, we focus on parametrized versions of geometrically defined graphs characteristic of purely wireless or hybrid sensor networks. In particular, we consider classes of K-grid graphs at one extreme, representative of the connectivity structure of purely wireless networks, and random regular graphs at the other extreme, representing randomly wired networks with good mixing properties. For the K-grids, we further consider (i) randomizing (i.e., randomly permuting) the node locations in space while keeping links unchanged and (ii) randomizing the links. We note that permuting node locations of the K-grids in space (i) is for the purpose of measuring the effect of the transformation on the quality of sampling though neither transformation (i) nor transformation (ii) results in a realistic wireless scenario. We finally analyze the quality of sampling for small world networks as described by Kleinberg [11], which are representative of hybrid networks [2,12,13], and consider which parametrization processes of such networks result in the best geographic sampling quality even when controlling for degree.
Eigenvalue comparison for networks of 2704 nodes.
Thus, we are able to determine the relative effect of node distribution versus edge connectivity on the geographic sampling quality. Our results indicate that, as expected, both randomly permuting node locations and randomizing edge connectivity significantly ameliorate the geographic sampling performance even when applied separately. The effect of the random permutation of the node locations for any fixed network was also surprisingly substantial. Regarding the relative effect of the node permutation versus the randomization of edges, a small but consistent effect is seen favoring the edge randomization towards geographic sampling quality for smaller networks. In order to determine how important was the distinction in the relative effects of node distribution versus edge connectivity, we performed the same experiments on much larger networks and found the distinction amplified. These results indicate that whereas randomizing node locations for the same network indeed has a significantly positive effect in geographic sampling quality, nonetheless the edge connectivity remains the most important factor in sampling quality even when restricted to geographical measures and geographical networks.
In this paper we expand greatly on the ideas previously introduced in [14]. Section2 gives definitions and preliminaries on graphs, random walks, and connectivity. Section3 gives details of the experimental setup, and Section4 summarizes the results. Finally, conclusions are presented in Section5.
2. Definitions and Preliminaries
In talking about a network, we are referring to the graph that represents it. A general graph G is defined by its node set, V, and its edge set E, and is usually denoted as
In the case of a geographically embedded network, we may also specify the ordered set of coordinates C subset of
Small world graphs are constructed against a lattice according to a formula with p, q, and α as parameters. The graphs begin as K-grids, with each node having short-range connections to all nodes within p lattice steps. The small world is characterized by the addition of q long-range connections, which are generated randomly, with probability proportional to
2.1. Random Walk and Connectivity Preliminaries
A simple random walk on a graph is a memoryless stochastic process which starts at an arbitrary initial node
Let Markov chain
In such terms, the stationary distribution of 

To define mixing time, we must first introduce the relevant notion of distance over time. Let x be the state at time 


As the stationary distribution π is defined to be such that
Theorem 1.
For an ergodic Markov chain (ergodicity is guaranteed by the chain being finite, connected, and nonbipartite, as we have in this work), the quantity
As we will measure mixing properties via spectral gap, the above relationships are important.
Finally, we must speak of some of the well-known mixing (or nonmixing) properties of some graphs considered in this work: K-grids for any constant and polylogarithmic K are known to exhibit very poor mixing properties and bad spectral gap [1,17,18]. On the other hand, random d-regular graphs are expanders w.h.p. for any
3. Experimental Setup
The experiments were performed on networks of sizes (number of nodes) 2704 and 10404, respectively. For each graph type and node location distribution considered, a random walk was performed on the network, and at every 10 steps the largest empty circle (largest circular unvisited region) was calculated via Delaunay triangulation of the visited nodes. The random walk was continued until all nodes in the network were visited, and the empty circle calculations were plotted for comparisons. The results can be seen in Section4.
The graph types considered were generated as follows. Both
The graphs labeled
4. Results
Table1 compares the eigenvalues of the networks examined. Note that
4.1. K-Grids, Perturbed K-Grids, and Random d-Regular Graphs
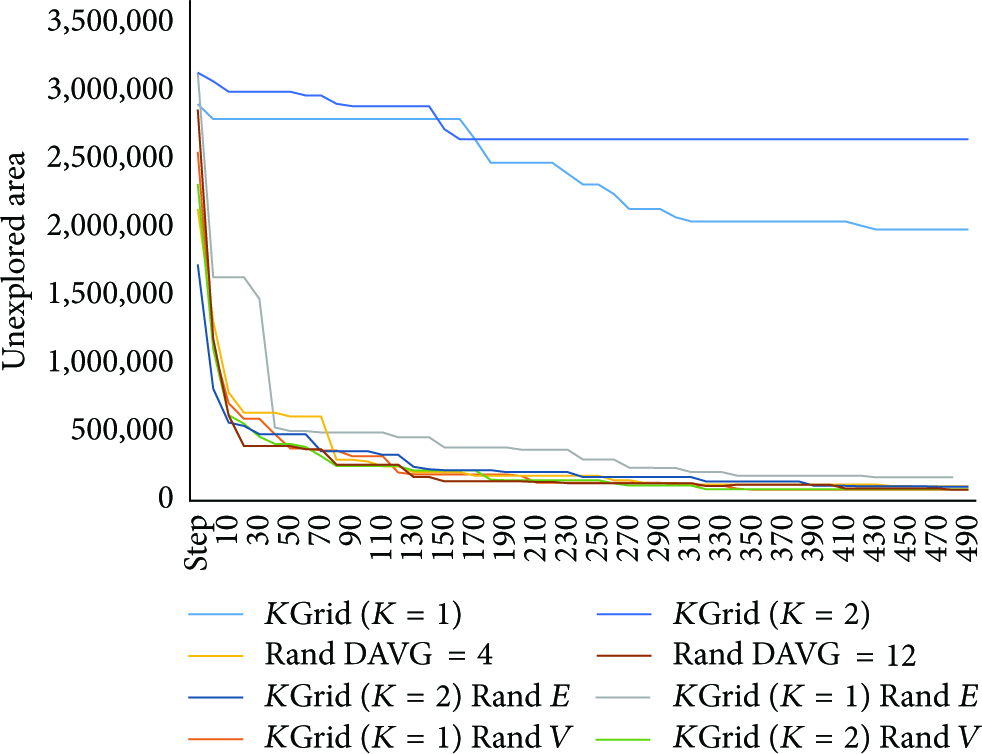
Figure3 plots the rate of decrease of the largest empty circle areas during the random walks, for the K-grid and random graphs with 2704 nodes.

Overall comparison of sampling quality for all graph types with 2704 nodes. The graphs with the slowest rate of decrease of largest empty circle area are the two blue lines at the top, which represent the K-grid graphs, with both
All networks outperform the unperturbed K-grids. Interestingly, even K-grid of
Upon closer examination of Figure3, it is also apparent that the randomization of edge choices while maintaining node location at regularly spaced grid points (

Relative comparison of node versus edge effect on sampling quality for two networks of over 10000 nodes. Steps 0 to 500,
Figure5 shows the rate of decrease of the largest empty circle areas for K-grid and random graphs with 10,404 nodes. As with the 2704-node graphs, the nonrandomized K-grids converge at a much slower rate than all other graph types.
Overall comparison of sampling quality for all graph types with over 10,000 nodes.
Figure6 represents an attempt to show more clearly the results for the K-grid graphs of size 2704. We show the size of the largest unsampled area (as measured via the largest empty circle) decreasing logarithmically as the number of steps required increases. Here it is clear that the

Steps in the random walk versus size of the largest unsampled area for different types of graphs. The size of the largest unsampled area shrinks exponentially from left to right.
4.2. Small World Graphs
It has been shown that the mixing time of geometrically embedded graphs, such as those representing purely wireless networks, is improved by the addition of sparse random links [19,20]. This results in hybrid models characteristic of small world graphs [12,13,21]. It is of interest to verify empirically that the geographic sampling quality is also improved by varying the randomness-inducing parameters of small world graphs.
For each small world graph, the degree of randomness is determined by the q and α parameters. Higher q indicates the presence of more randomly chosen links, and lower α indicates that those links will cover longer distances.
The spectral gaps for four randomly generated small world graphs are shown in Table1. The graphs are labeled by their p-q-α values. It is noticed that, as expected, larger spectral gaps are obtained by graphs with more random links, q, and longer random link distances, expressed by smaller α values.
For purposes of comparison, contrasting graphs of degrees 12 and 24 were generated in different ways. The 12-degree graphs had p, q, and α of 2-0-0 (all lattice connections, no random connections) and 1-4-0 (4 lattice and 4 random connections for each node). The 24-degree graphs had p, q, and α of 3-0-0 (we note that this case is also a K-grid) and 2-6-0. As is shown in Figure7, the 12-degree graph with more random connections exhibited even higher sampling quality than the 24-degree degree graph with no randomness. We note that the

Small worlds graphs. A 24-degree graph (red) converges more slowly than a 12- degree graph (light blue) with increased randomness. A high degree does not necessarily guarantee good mixing properties.
5. Conclusion
We have proposed a natural new measure of sampling quality relevant to geographically embedded networks in particular and used our measure to compare what network related factors affect the geographic sampling quality. We have demonstrated use of the rate of decline of the area of the largest empty circle to evaluate the efficiency with which a geographic network can be traversed by a random walk. A high rate of decline was generally correlated with graphs with high spectral gap and low mixing time. However, even for graphs with low mixing time, randomization of node locations while retaining identical connectivity structure also significantly affected the sampling quality. A greater amount of randomness in either node placement or edge connections resulted in a higher quality of sampling from geographic networks.
We compared the quality of sampling of geographic networks by noting the rate of shrinkage of the largest circumscribed circle of the Delaunay triangulation of the sampled points. Various types of networks were used, including completely nonrandom K-grids, node and edge based perturbations of the K-grids, random networks with regular degrees, and small world networks with varying randomness and degrees.
We started by first permuting the node locations and then randomizing the edge connections of the K-grids, to determine the relative effect of node distribution versus edge connectivity on the quality of sampling. The addition of randomness applied either way resulted in a substantially more rapid decrease in the unexplored geographic area compared to the unperturbed K-grids. Generally, the edge randomization resulted in better quality sampling than node randomization, although the differences were not necessarily great. Interestingly, the differences were greater with networks of greater size.
Spectral gap information was calculated for the examined graphs and was shown to correlate with the quality of sampling. As expected, graphs with higher spectral gaps exhibited a faster rate of largest circle decline. This was particularly important with small world graphs. The graphs with the highest amount of randomness, as represented by their q and α parameters, resulted in a better sample that was more quickly obtained via a random walk. And such graphs also had better mixing properties, as expected. In fact, a nonrandom graph of degree 24 performed significantly worse than a randomized small world graph of only degree 12.
Footnotes
Competing Interests
The authors declare that they have no competing interests.