
Abstract
In a multihop wireless network, such as a wireless sensor network (WSN), with nodes being aware of their locations, the geographic routing scheme is an effective way of delivering packets to their destinations because of its 1-hop beacon broadcasting based routing related information exchange operation. The routing information obtained via 1-hop beaconing is local in the sense that it is just 1-hop compared to the multihop end-to-end routing. Hence, at some point, packets may experience no more place to be forwarded to (i.e., dead-ends). In this paper, we propose a geographical routing mechanism adopting the concept of the azimuth to reduce the possibility of packets confronting dead-ends. In other words, the node with a packet to be forwarded to the final destination figures out the next-hop node by utilizing the azimuth of the destination as a routing metric. Besides, we propose additional routing metrics for stable next-hop node selection to provide reliable IP connectivity. In order to validate the performance of the proposed routing mechanism, we evaluate its performance through the NS-2 based simulations and show that our mechanism outperforms the other schemes in terms of the packet delivery success rate, the end-to-end delay, and the number of dead-end encounters.
1. Introduction
With various and emerging IoT applications, seamless communication capability needs to be supported so that IP connectivity can be possible anywhere and anytime for any type of IoT services. Multihop wireless networks such as mobile ad hoc networks (MANETs) [1], vehicular ad hoc networks (VANETs) [2], and wireless sensor networks (WSNs) [3] can extend the coverage of wireless communications by providing communications through multiple wireless links via mobile nodes. The network topology of a multihop wireless network changes frequently due to node mobility. For the delivery of packets in this harsh network environment, geographical routing schemes have been extensively proposed [4–11]. In this type of routing approaches, a node determines its next-hop node for the delivery of a packet based on both the location information of the destination and the location information of its 1-hop neighbors. One of the significant drawbacks of geographical routing schemes is dead-ends where a node may not find its next-hop node in delivering a packet to the given destination. In order to overcome dead-ends, the dead-end reduction (DR) mechanism based on the Voronoi diagram was proposed [8]. However, the Voronoi diagram approach may not give a delicate indication of a dead-end (refer to Section 3.1 and Figure 5).
In this paper, we propose the geographical routing scheme with dead-end avoidance (RSDA) that provides reliable IP connectivity by selecting next-hop nodes with low possibility of encountering dead-ends. This can be achieved by utilizing the effectively summarized 2-hop neighbor information, the union range of the azimuth (URA), and the number of 2-hop neighbors (2HN). The URA value of a candidate next-hop node is delivered to the next-hop node selecting node via a beacon message. The URA value is the range information of the azimuths of 1-hop neighbors, that is, the summarized 2-hop coverage information. Based on URA, the directionality to the destination is measured, which allows the RSDA mechanism to predetermine the possibility of encountering dead-ends and to reduce the possibility of falling into the perimeter mode, resulting in shorter delay to the given destination. In RSDA, the size of the possible dead-end area is smaller than that of the DR scheme.
The rest of the paper is organized as follows: in Section 2, the operations of the greedy perimeter stateless routing (GPSR) [7] and the DR mechanisms are described in detail because their performance will be compared with ours. Those routing metrics proposed in the RSDA mechanism and the procedure of applying those routing metrics are mentioned in Section 3. The simulation results and the performance analysis are presented in Section 4. Finally, we conclude in Section 5.
2. Related Work
The authors of [7] proposed the greedy perimeter stateless routing (GPSR) protocol in which a node determines the next-hop node of its packet by utilizing the location information in the beacon messages periodically broadcasted from its 1-hop neighbors. In GPSR, the node that makes the largest progress to the given destination of a packet is chosen as the next-hop node, which is appropriate in minimizing the time for delivering the packet to the destination. However, those packets forwarded by GPSR may encounter dead-ends frequently and dead-ends have to be detoured by using the perimeter forwarding mode, resulting in a longer path with higher overhead. For example, in Figure 1, when the node a delivers a packet to the node g, the node c confronts with a dead-end. Thus, c uses the perimeter forwarding mode to deliver the packet through a detour path. That is, the packet is finally forwarded through the
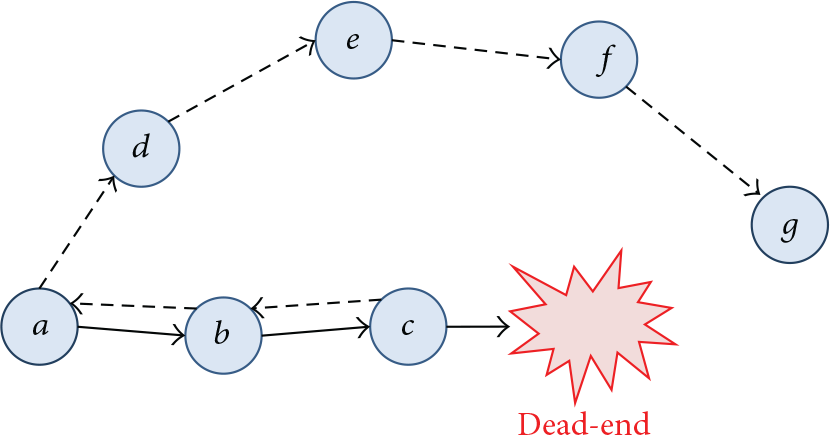
Dead-end resolution with the perimeter forwarding mode.
With the aim of avoiding dead-ends, the dead-end reduction (DR) mechanism [8] adopts the Voronoi diagram [12]. Each node periodically configures the Voronoi diagram of itself using 1-hop neighboring information. Figure 2 shows the Voronoi diagram of the node X with the neighbors A, B, and C. X is considered as a node without a dead-end because X is included in the Voronoi polygon. In this case, X can be considered as the next-hop node.

The Voronoi diagram at the node X.
In DR, four types of dead-end segments are defined and the node detecting a dead-end segment informs this to its 1-hop neighbors via a beacon message. A relaying node checks whether the destination is located in the dead-end segments of its neighbors. If the destination is inside the dead-end segment of a neighbor, then the neighbor is not qualified as the next-hop node. In Figure 1, if we use the DR mechanism, node b can know a priori that c will encounter a dead-end by checking whether the destination falls in the c's dead-end segment obtained via the beacon message from c. Then, b forwards the packet to d. Therefore, it is delivered through the
However, the DR mechanism tends to produce a longer path because it chooses the neighbor node without a dead-end as the next-hop node without taking account of the distance between the neighbor and the destination. Also, only 1-hop neighbors are checked for the existence of dead-ends. If all the 1-hop neighbors of the chosen next-hop node have dead-ends, the chosen next-hop node has to use the perimeter forwarding mode in order to detour the dead-end.
In this paper, we propose the geographic routing scheme with dead-end avoidance (RSDA). RSDA aims to figure out the next-hop node with the shortest route to the destination with lower possibility of encountering dead-ends. In Figure 1, if the DR mechanism is applied, node b decides not to forward the packet to c. On the other hand, in our RSDA mechanism, a determines d as the next-hop node based on the directionality to the destination, which is 1-hop ahead of the DR mechanism. As a result, a sends through the route
3. A Routing Scheme with Dead-End Avoidance (RSDA)
In this section, we newly define routing metrics and how these routing metrics are calculated and in which order they are applied. Our proposed routing metrics are computed based on location, the range of angles, and the number of neighbors obtained from beacon messages.
In the RSDA mechanism, each node periodically broadcasts beacon messages to its 1-hop neighbors, similar to GPSR. The beacon message of a node has the information on its location, the number of its neighbor nodes, the union range of azimuth (URA), and the 2-hop neighbors (2HN). The fields of the additional information are shown in Table 1. In this case, about 30 bits (9 bits for an azimuth value) may be enough to represent the number of neighbors, URA, and 2HN fields. On the other hand, the DR scheme requires at least 13 bytes for the representation of a dead-end segment in a compressed form.
The information in the beacon message.

The basic intuition of selecting the next-hop node in the RSDA mechanism is that the node with its neighbors closer to and heading to the destination is desirable to be selected as the next-hop node. In Figure 3, Figure 3(b) is the case of showing S having a desirable next-hop node to the destination D because all the neighbors of S's next-hop node (the node with a dark color) are closer to D than S.

Selecting the next-hop node of S to D.
3.1. Major Routing Metrics
The URA and the 2HN are two important factors in determining reliable next-hop nodes. The URA of a node is computed from the azimuth angles of its neighbors, which reflects the area with no dead-end. Each node computes its URA based on its location and the locations of its 1-hop neighbors. As shown in Figure 4, the central node measures the azimuth, 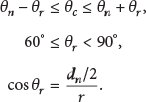
The azimuth angles of the neighbor nodes of the central node.

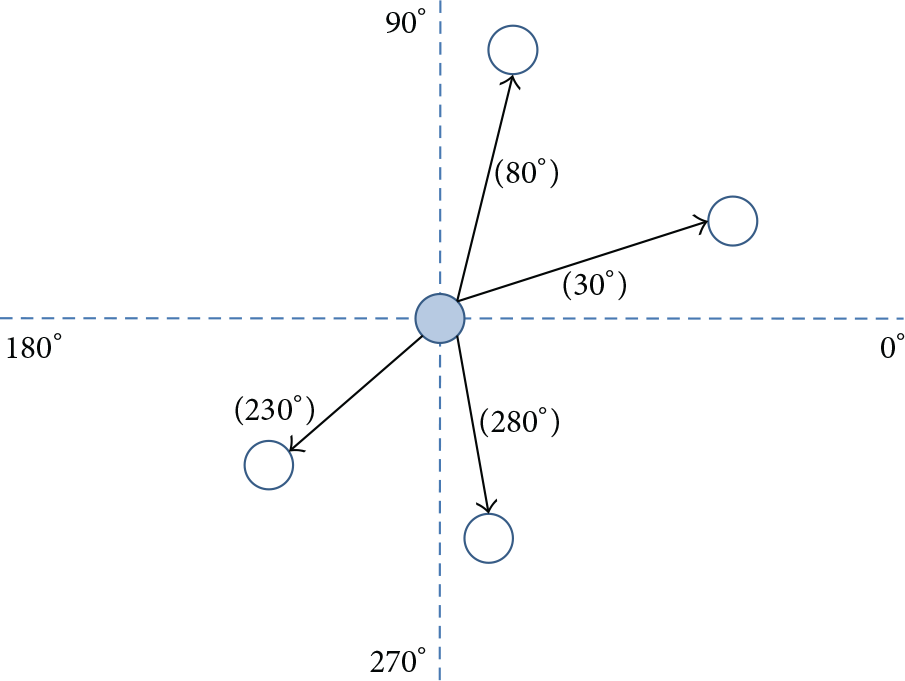
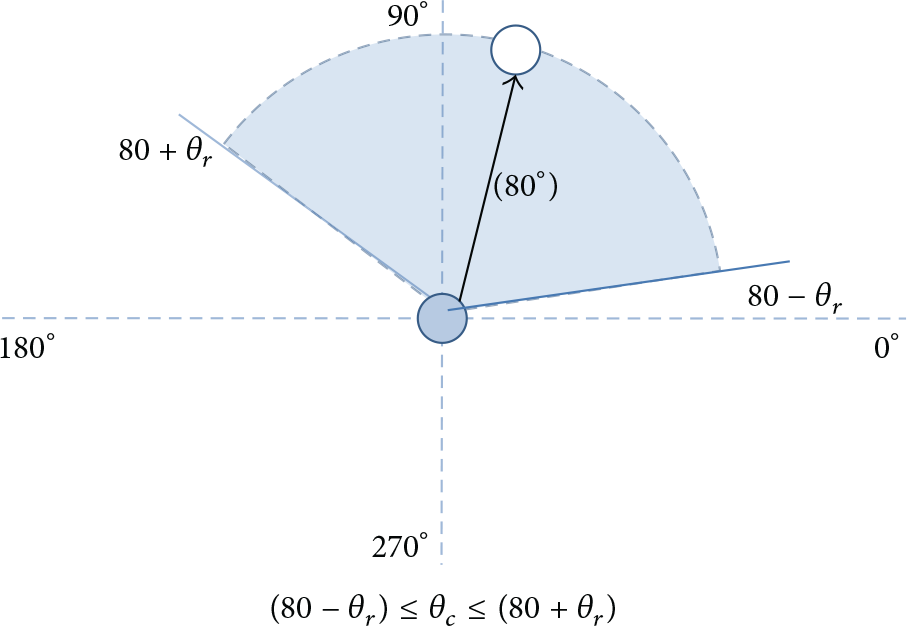
An example showing
Here,
Figure 6 shows how to compute
An example showing
Once
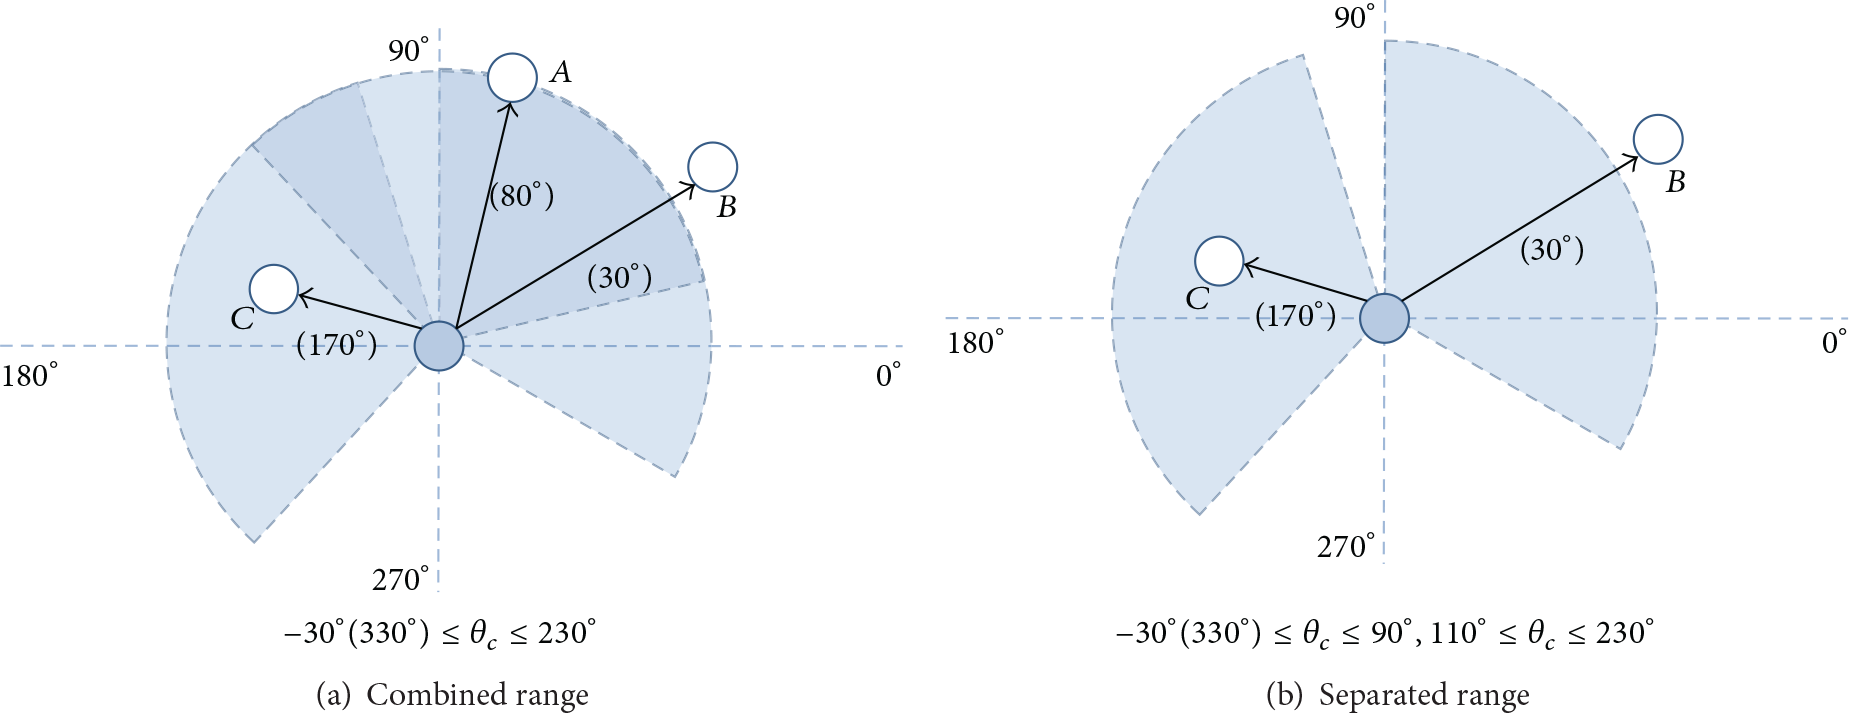
Two types of URA.
The 2HN value of a node is computed by adding up the numbers of neighbors of all of its neighbors and, then, taking out the number of its neighbors. The 2HN value of a node approximately indicates the possibility of having available paths and the node with a higher 2HN value tends to have a lower possibility of encountering dead-ends.
3.2. Selection of the Next-Hop Node
In the RSDA mechanism, each node periodically broadcasts beacon messages with its location, the number of its neighbors, and its URA and 2HN values to its 1-hop neighbor nodes. Figure 8 shows the procedure of handling the received beacon message. As shown in the figure, the beacon receiving node updates its routing table and recomputes its URA and 2HN values based on the location information of its 1-hop neighbor and the number of its 1-hop neighbors. If a new neighbor node is added into its routing table, it increases the number of its 1-hop neighbors.
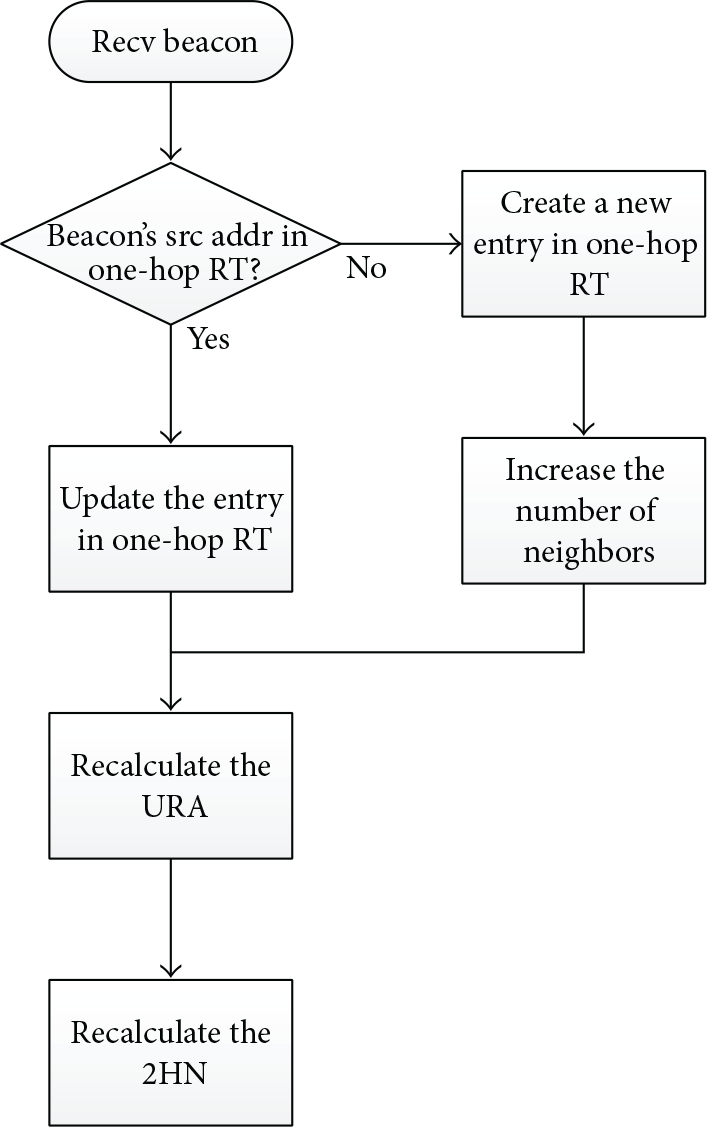
The operation of a node upon receiving a beacon message.
When a node n has a packet to send or forward, it checks its neighbors to select the next-hop node for the delivery of the packet. Those neighbors closer to the destination than n are considered as the candidate nodes for the selection of the next-hop node. For each candidate node, n measures the azimuth,

Finding the next-hop node of S to D.
For each of the determined dead-end nonencountering neighbor nodes, that is, the real candidates for the next-hop node, the position of the azimuth
The PA of a real candidate node c is calculated based on the URA of the node c, which is 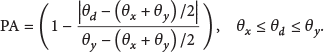
The PDD of a real candidate node c is the ratio of the progressed distance of c compared with n to the destination to the transmission range of n. A larger PDD is more desirable for the next-hop node of n,


For each of the real candidate nodes with the largest PA value, the metric MNN is computed using

Figure 10 shows the procedure of selecting a next-hop node based on the abovementioned RSDA mechanism.

Operation of a node selecting its next-hop node.
4. Performance Evaluation
We have used the NS-2 simulator [13] for the performance evaluation of our proposed RSDA. The simulation network consists of 100~250 nodes randomly placed in the 2000 m × 2000 m area. We have used the IEEE 802.11 as the MAC layer protocol with 2 Mbps data rate. The transmission range is set to 250 m and the interference range to 500 m. The total simulation time is set to 200 seconds. The mobility speed is varied from 1 m/s to 15 m/s using the random waypoint mobility model. For the data traffic generation, the CBR rates of 20 Kbps~40 Kbps are used. One beacon message is generated per second. The simulation parameters are listed in Table 2.
Simulation parameters.
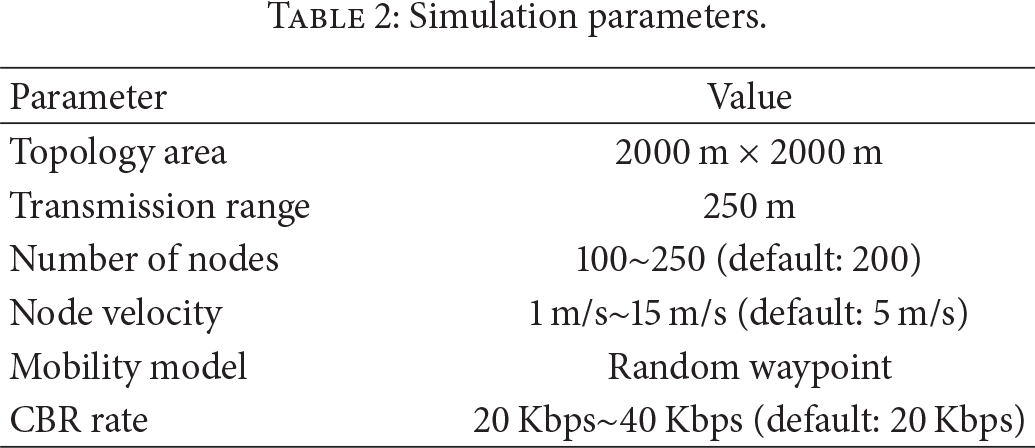
Figure 11 shows the packet delivery ratio for the number of nodes. As the number of nodes increases, our RSDA shows better performance than GPSR and DR in terms of the packet delivery ratio. In particular, for a smaller network (with less nodes), RSDA gives relatively much higher packet delivery ratio because a network with less nodes tends to have a higher possibility of having dead-ends.
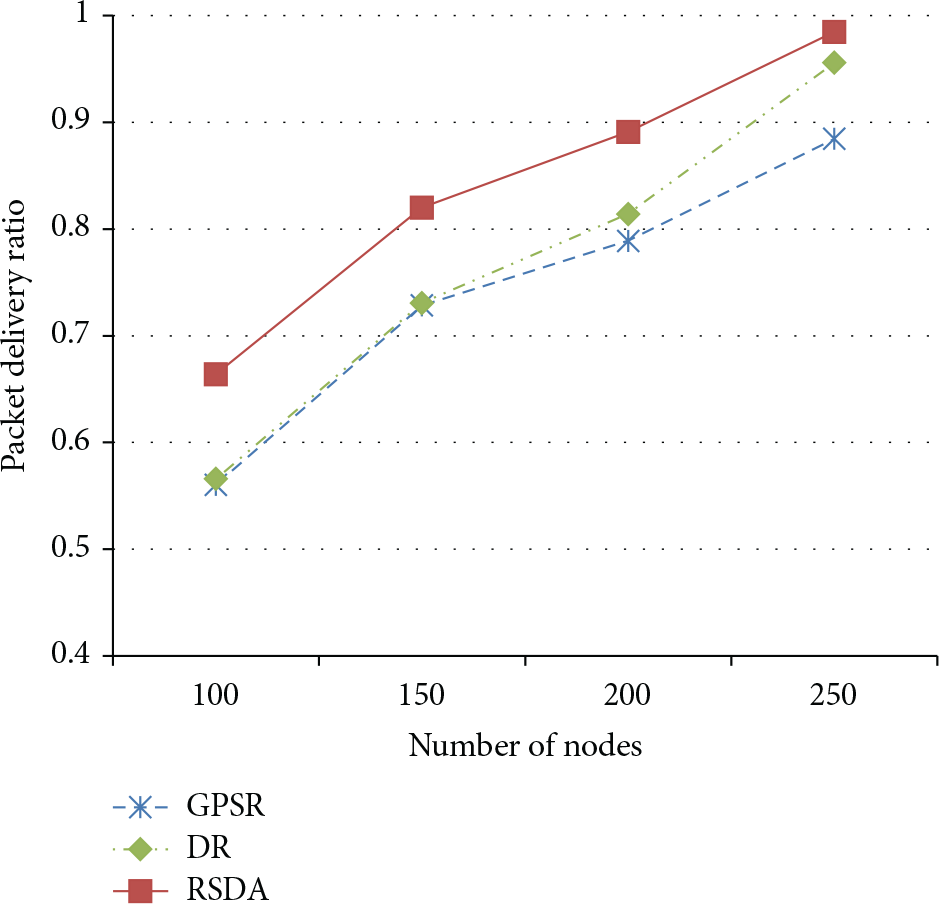
Packet delivery ratio versus the number of nodes (with
Figure 12 plots the packet delivery ratio for various node mobility speeds. Our RSDA shows higher packet delivery ratio for all the cases than GPSR and DR. The performance of GPSR degrades significantly as the node mobility increases. On the other hand, RSDA performs in a relatively stable manner even for higher node mobility because RSDA selects those next-hop nodes with low possibility of encountering dead-ends.
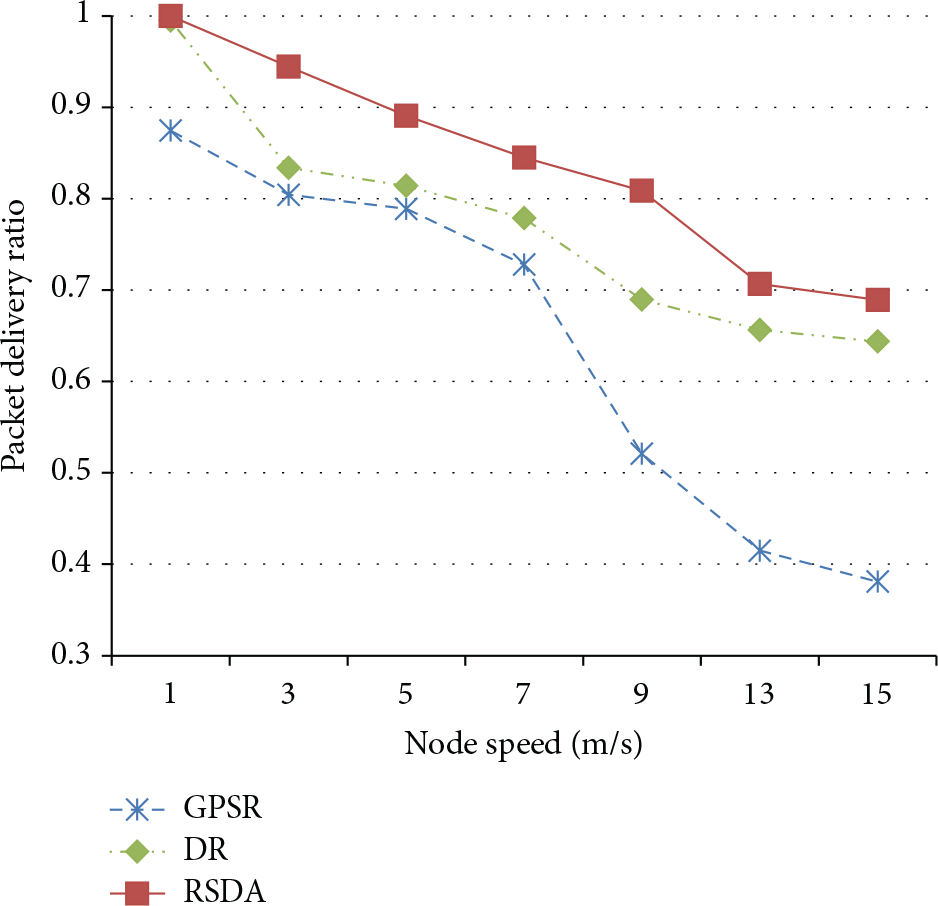
Packet delivery ratio versus node speed (with
Figure 13 depicts the packet delivery ratio for various CBR rates. As the figure shows, RSDA gives much higher packet delivery ratio than GPSR and DR for all the cases.
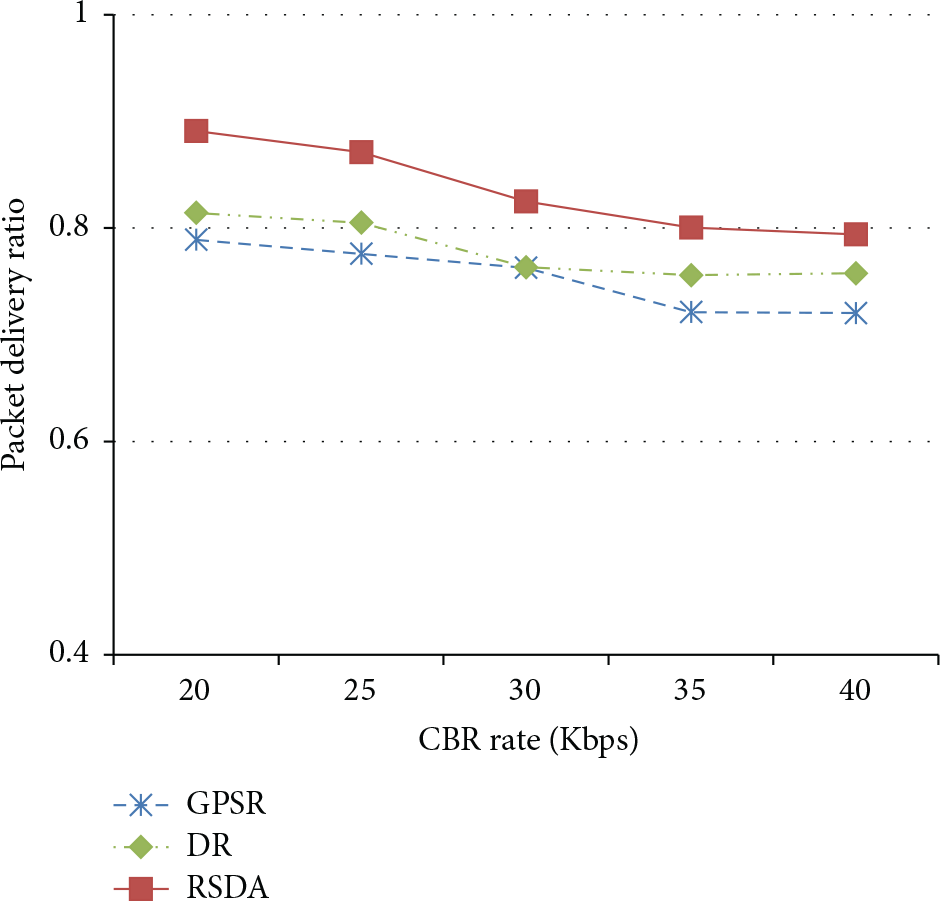
Packet delivery ratio versus CBR rate (with
Figure 14 shows the end-to-end packet delivery delay with varying the number of nodes. As shown in this figure, the DR mechanism gives the longest delay for all the cases. The reason for this is that DR uses routes which may be longer with no dead-end by utilizing the Voronoi diagram. Our RSDA routing mechanism shows higher packet delivery delay than GPSR since RSDA tends to select more stable and possibly longer routes with lower possibility of encountering dead-ends.

End-to-end delay versus the number of nodes (with
Figure 15 depicts the simulation results in terms of the average path length experienced by packets from sources to destinations. From this figure, we can see that the routes taken by packets in the DR mechanism are the longest overall. Our RSDA mechanism performs better than DR (i.e., shorter routes) but worse than GPSR (i.e., longer routes) because of the same reason as explained in Section 4.
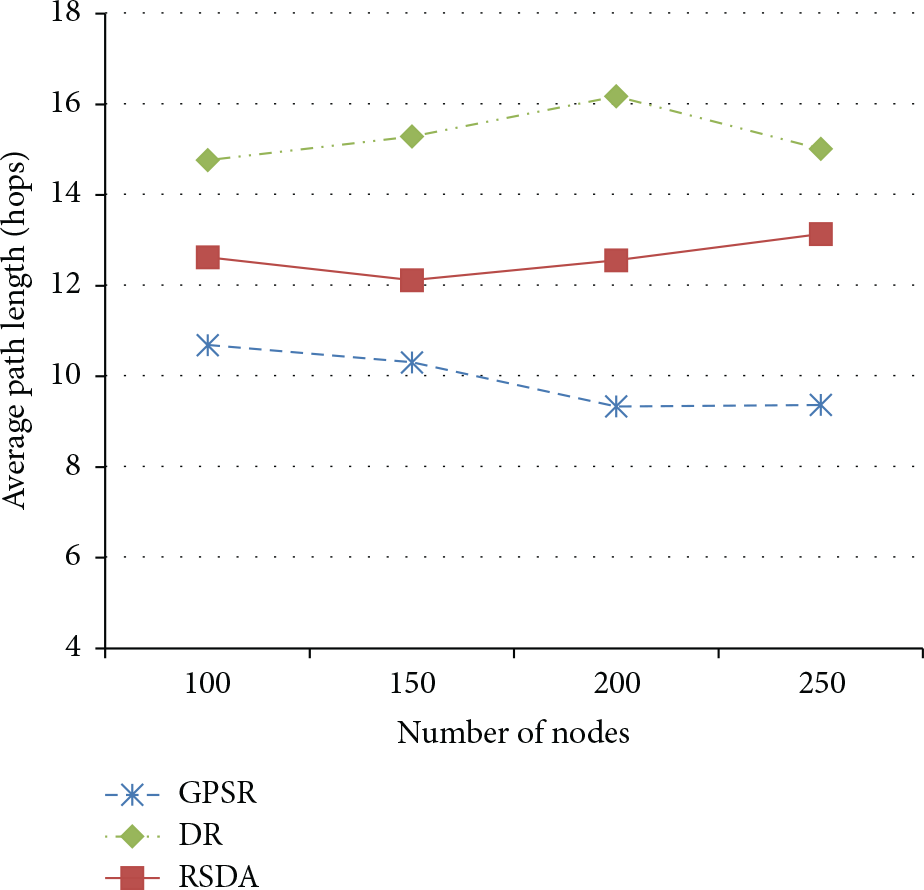
Average path length versus the number of nodes (with
Figure 16 shows the number of dead-ends encountered by packets per second with varying the number of nodes. As shown in this figure, the RSDA routing mechanism outperforms GPSR and DR mechanisms. This implies that our RSDA mechanism is more stable in selecting next-hop nodes so that the possibility of encountering dead-ends can be reduced. In this graph, we can see that, as the number of nodes decreases, the possibility of encountering dead-ends sharply increases for both the GPSR and the DR mechanisms. This is due to the fact that less nodes increase the possibility of undesirable next-hop nodes being selected.
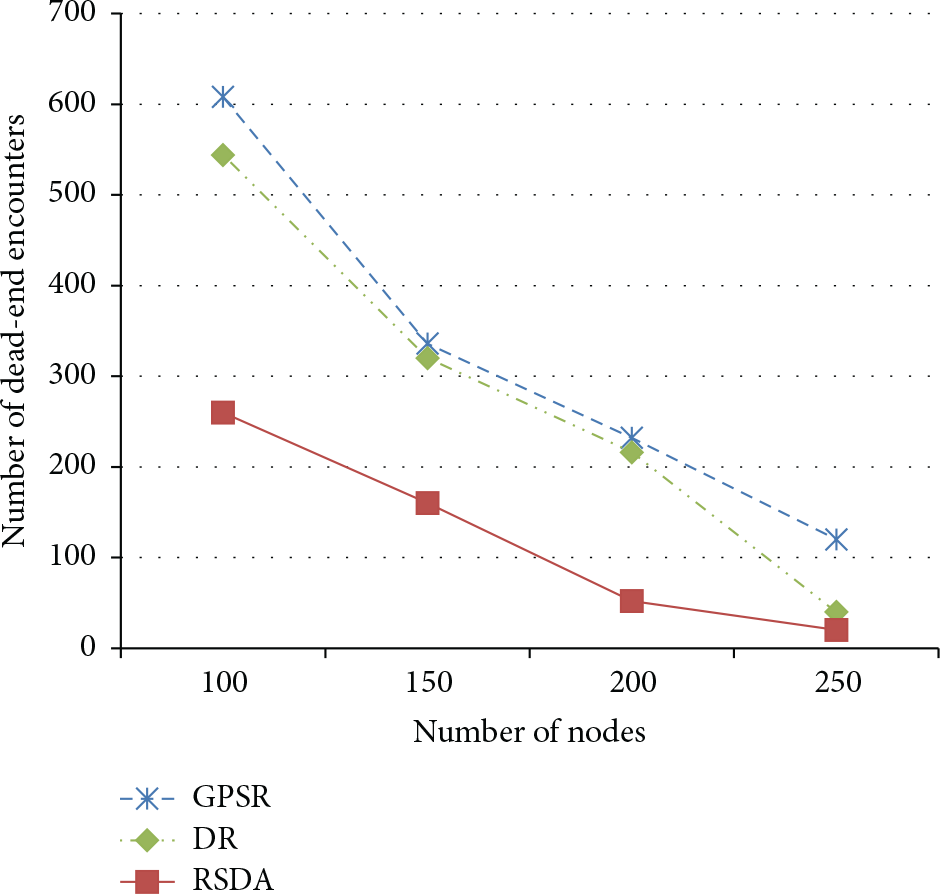
The number of dead-end encounters versus the number of nodes (with
Now, we analyse the impact of parameters α and k which are used in our RSDA routing mechanism. Figures 17 and 18 show the performance results in terms of the packet delivery ratio for various k values with varying the number of nodes and the node moving speed, respectively. k is the threshold used in the to-be next-hop node selection from the given real candidate nodes based on PA (see Section 3.2). As Figures 17 and 18 show, k value of 0.5 gives the best performance.

Packet delivery ratio versus the number of nodes for various k values.
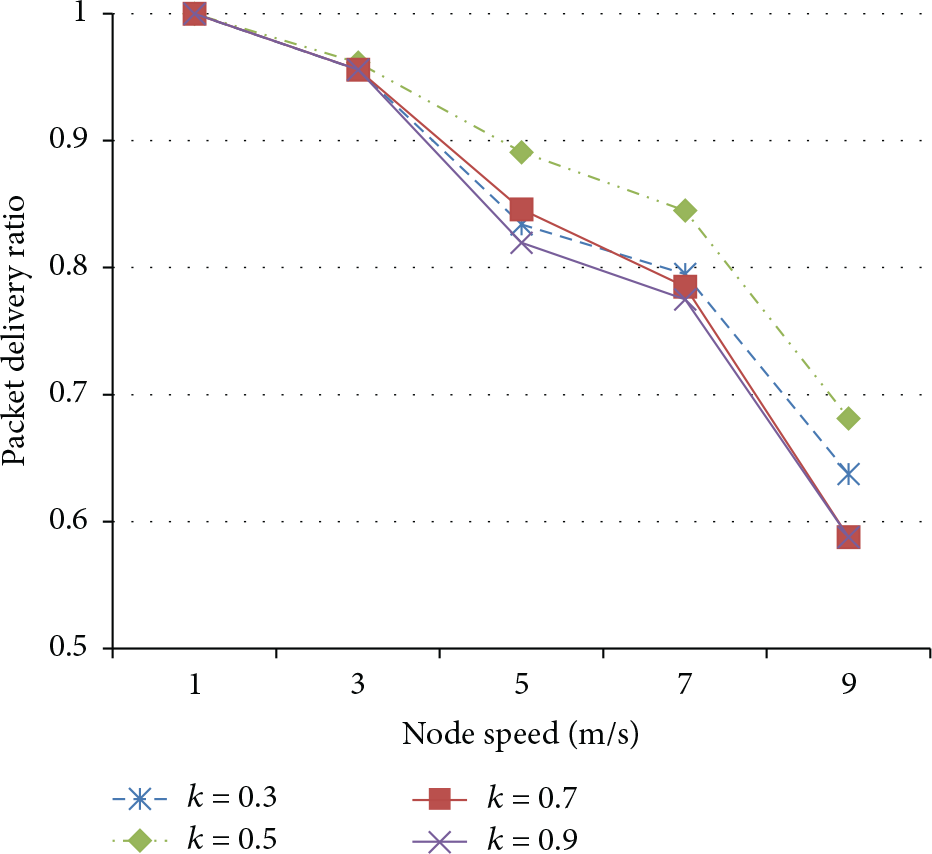
Packet delivery ratio versus node speed for various k values.
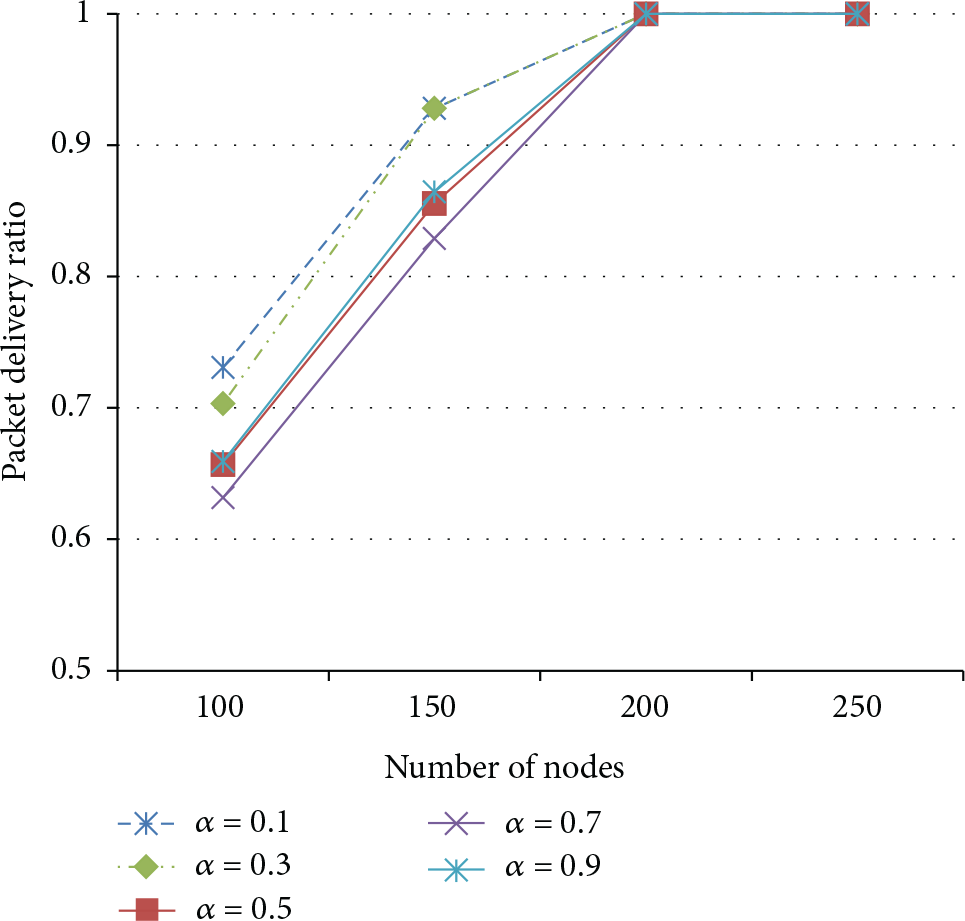
Figure 19 shows the packet delivery ratio for various α values. α is the weight used in calculating MNN from PDD and NPR (see Section 3.2). In Figure 19, we can observe that α of 0.3 (i.e., NPR is more preferred) is the best.

Packet delivery ratio versus the number of nodes for various α values.
Figures 20, 21, and 22 give the experimental results of various α values with changing the node mobility speed and the number of nodes. The results in Figures 20 and 21 are obtained from the simulation environments of the cases with the node mobility speed of 1 m/s (relatively low mobility). We can easily observe that larger α values are better when the node mobility is low and the node density is high. This means that, in a dense network, the progress to the destination needs to be preferred. For example, for the case of 200 nodes with all α values achieving the same packet delivery ratio, the end-to-end delay is smaller for larger α values.
Packet delivery ratio versus the number of nodes for various α values (with low mobility).

End-to-end delay versus the number of nodes for various α values (with low mobility).

Packet delivery ratio versus the number of nodes for various α values (with high mobility).
Figure 22 is the simulation results when the node mobility speed is set to 7 m/s which is high mobility compared to the environment in Figures 20 and 21. In the highly mobile environment, smaller α values (i.e., more weight on the number of 1-hop neighbors) are preferred.
5. Conclusion
Geographical routing mechanisms are good for large-scale multihop wireless networks such as WSNs. However, they may suffer from dead-ends, resulting in longer routes and higher overhead. Therefore, in this paper, we proposed the RSDA mechanism aiming to avoid dead-ends by using the concept of the coverage range of a node based on the azimuth and the perpendicular bisector. By carrying out the NS-2 based simulations, we showed that our proposed RSDA performs much better than GPSR and DR in terms of the packet delivery ratio, the end-to-end delay, and the number of dead-end encounters. Our proposed RSDA routing mechanism can be applied to any type of multihop wireless networks, such as MANETs, VANETs, and WSNs, in which each node is aware of its own location and the locations of its 1-hop neighbors and the location of the given final destination.
Footnotes
Competing Interests
The authors declare that they have no competing interests.
Acknowledgments
This work was supported by the National Research Foundation of Korea (NRF) grant funded by the Korean Government (MSIP) (no. NRF-2015R1A2A2A04005646). This research was supported by the MSIP (Ministry of Science, ICT and Future Planning), Korea, under the ITRC (Information Technology Research Center) support program (IITP-2016-H8501-16-1007) supervised by IITP (Institute for Information & Communications Technology Promotion).