
Abstract
This work proposes a comprehensive combinational algorithm for sensor layout to solve the problem that unreasonable sensor layout affects the effectiveness of data selection and reduces the accuracy of monitoring system in healthy monitoring system of wind turbine blade structure. This algorithm integrates the advantages of kinetic energy method, effective independence method, modal assurance criterion (MAC), and many other optimal methods. In order to avoid information redundancy caused by partial concentration of test spots, Euclidean distance was introduced as the iteration condition of algorithm. Finite element simulation and experimental results show that the layout obtained by this method is beneficial to improving signal-to-noise ratio and can maximize the crossing angle between target vibration modes. Therefore, relatively complete characteristics of actual wind turbine blade structure can be obtained.
1. Introduction
As one of the key components and bases of the whole wind turbine generator, blade has value accounting for about 20% of the whole installation cost. The wind turbine generator always works under alternating load and in the wild environment of dust, rain, and snow, so the blade made of composite material always has abnormal deformation, acute vibration, and irregular distortion. All of these phenomena may cause invisible internal damage in use [1–5]. Although such damage will not affect the normal use of blade immediately, the partial damage may expand or enlarge with accumulated damage, making potential threats to the safe operation of whole wind turbine generator. Therefore, it is very important to monitor the damage of blade in operation online [6, 7]. The dynamic characteristics of structure are the sensitivity sign of physical property, so vibration response is always obtained by embedding acceleration sensor under blade skin to judge the condition of blade. Limited by economic cost, technical condition, and actual environment, however, it is not practical for layout of a large amount of sensors in blade to obtain complete modal data. Therefore, it has been inevitable to choose an optimal sensor layout to obtain real, acute, and detailed high-resolution structural response data in healthy monitoring of blade structure.
The optimized objective functions for layout algorithms at different test spots are all different. Effective independence is the most popular algorithm applied in engineering at present. This method takes the maximum of information matrix determinant of modal monitored as the optimization objective to ensure good linear independence of various target models [8]. Moore et al. made optimal layout of sensors for aluminum plate by combining steepest descent method with genetic algorithm and verified the effectiveness of algorithm in aspects of numerical calculation and experiment [9]. Yaxun et al. proposed that the effective independence modified with construction correction factor of modal strain energy has the deficiency of low energy at selected test point based on the work by Kammer. The optimal layout is satisfied [10]. Dongsheng et al. proposed a rapid calculation method to do primary selection of test spot by orthogonal-triangular decomposition (QR decomposition) for modal matrix in the view of relationship between effective independence and modal kinetic energy [11]. Comprehensively, the traditional single target function or single method has been dissatisfied with the requirements about accuracy of modern monitoring system for structure. Therefore, the integration of various methods has been a development trend. However, the researches on optimal sensor layout still focus on evaluation criteria or the improvement of layout algorithm, while the researches with consideration of both evaluation criteria and layout algorithm are still few.
Therefore, in order to select vibration response data of turbine wind blade, this work proposes a combinational algorithm for optimal layout with wide application range and strong universality with comprehensive consideration about factors of independence of modal vibration mode, energy, and information redundancy. Firstly, dynamic condensation technique is used to reduce the calculation variance of initial model and decrease the calculation scale. Secondly, in order to prevent the information loss caused by low of energy at test spot, the average of energy coefficient is used to weigh the distribution vector of effective independence. Meanwhile, Euclidean distance is introduced as iteration condition to avoid regional concentration at test spot. Finally, modal assurance criterion is used to set the convergence conditions for algorithm to determine the number of test spots.
2. Methods for Sensor Layout
2.1. Kinetic Energy Method
The main idea of kinetic energy method (KEM) is to select the test spot with the standard of maximum kinetic energy. Theoretically, this method can improve the signal-to-noise ratio and is more beneficial to signal selection and modal parameter identification [12]. The kinetic energy (KE) of structural modal is closely related to its mass M and modal matrix


2.2. Effective Independence
Effective independence proposed by Kammer is the most popular layout method used in engineering at present. Later, many scholars improved and developed this method. Similar to main idea and kinetic energy, its objective is to seek the test spot with the maximum linear irrelevant contribution to modal information and collect modal information as much as possible with finite sensors. The independent coefficient matrix

3. Combinational Algorithm of Optimal Layout
There are several practical problems about blade sensor layout in engineering. Firstly, the dynamic characteristics of structure are the sensitivity sign of physical integrity, so the comprehensive and complete modal data of blade is the basis of structural monitoring. Secondly, regional concentration of test spots to different extent occurs to all of the traditional layout scheme, so the sensor cannot cover the whole blade structure. Finally, the noise is severe in working environment of blade. If we put the sensor on the spot with strong vibration, the signal-to-noise ratio can be effectively improved. Considering all of these conditions, the combinational layout algorithm which integrates effective independence, modal energy, and MAC criteria is determined.
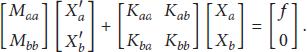
In recent years, the size of wind turbine blade tends to be gigantic, so the number of degrees of freedom becomes larger and larger. If we attribute all the degrees of freedom to degree of freedom to be selected, the calculation scale will be increased and optimal algorithm effectiveness reduced. Moreover, some regions of blade in actual engineering are not suitable for spot layout for limited conditions of environment, space, and so forth. Therefore, condensation should be conducted for blade model to reduce the number of test spots to be selected, and nodes in areas unsuitable for sensor layout should be deleted. This work adopted dynamic condensation to simplify the degree of freedom of model. The main idea of this method is to divide degree of freedom into main degree of freedom a and subordinate degree of freedom b. The main degree of freedom is reserved in condensation system to condensate the subordinate degree of freedom of structure. Therefore, the structural dynamic equation is as follows:
In order to overcome the deficiency of traditional EI algorithm that the energy at test spot to be selected is too low, many scholars introduce the energy factor into effective independent matrix. The main idea of the introduction is to take the energy contribution of all nodes in structure to be tested to the target modal as correction coefficient. However, this method is not suitable for the blade with complex structure and large difference in modal states. If we add test spot according to the energy contribution of nodes to all target modal states, the data insufficiency may be severe in some order of modal monitoring. To solve this problem, the average value of kinetic coefficient is used to correct the independent distribution matrix in combinational algorithm, so the information loss can be avoided. Combinational algorithm regulates the energy coefficient at node as follows:


Meanwhile, Euclidean distance is introduced as iteration condition to avoid the information redundancy caused by regional concentration of test spots. Euclidean distance can be used as the standard to evaluate information similarity degree. The smaller the distance to test spot is, the smaller the information difference will be and the easier the information redundancy will occur. The difference


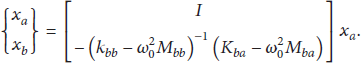
Test spots can be distributed in the area with strong structural vibration to a great extent with a certain sparse degree by weighing effective independent matrix with average energy coefficient and setting distant constraint. This layout algorithm not only ensures the monitoring integrity of target modal, but also avoids the information redundancy to make the distribution of test spots more rational and effective. Finally, the convergent condition of combinational algorithm is set by MAC criteria to determine the optimal number of sensors. In engineering, it is always thought that states in all orders are orthogonally independent for MAC value less than 0.25. In order to improve the accuracy, this work set the convergent condition of algorithm that the maximum of nondiagonal element is less than 0.1 [14]. Figure 1 shows the flow of combinational layout algorithm at test spots.
Flow of combinational optimization algorithm.
4. Simulated Analysis
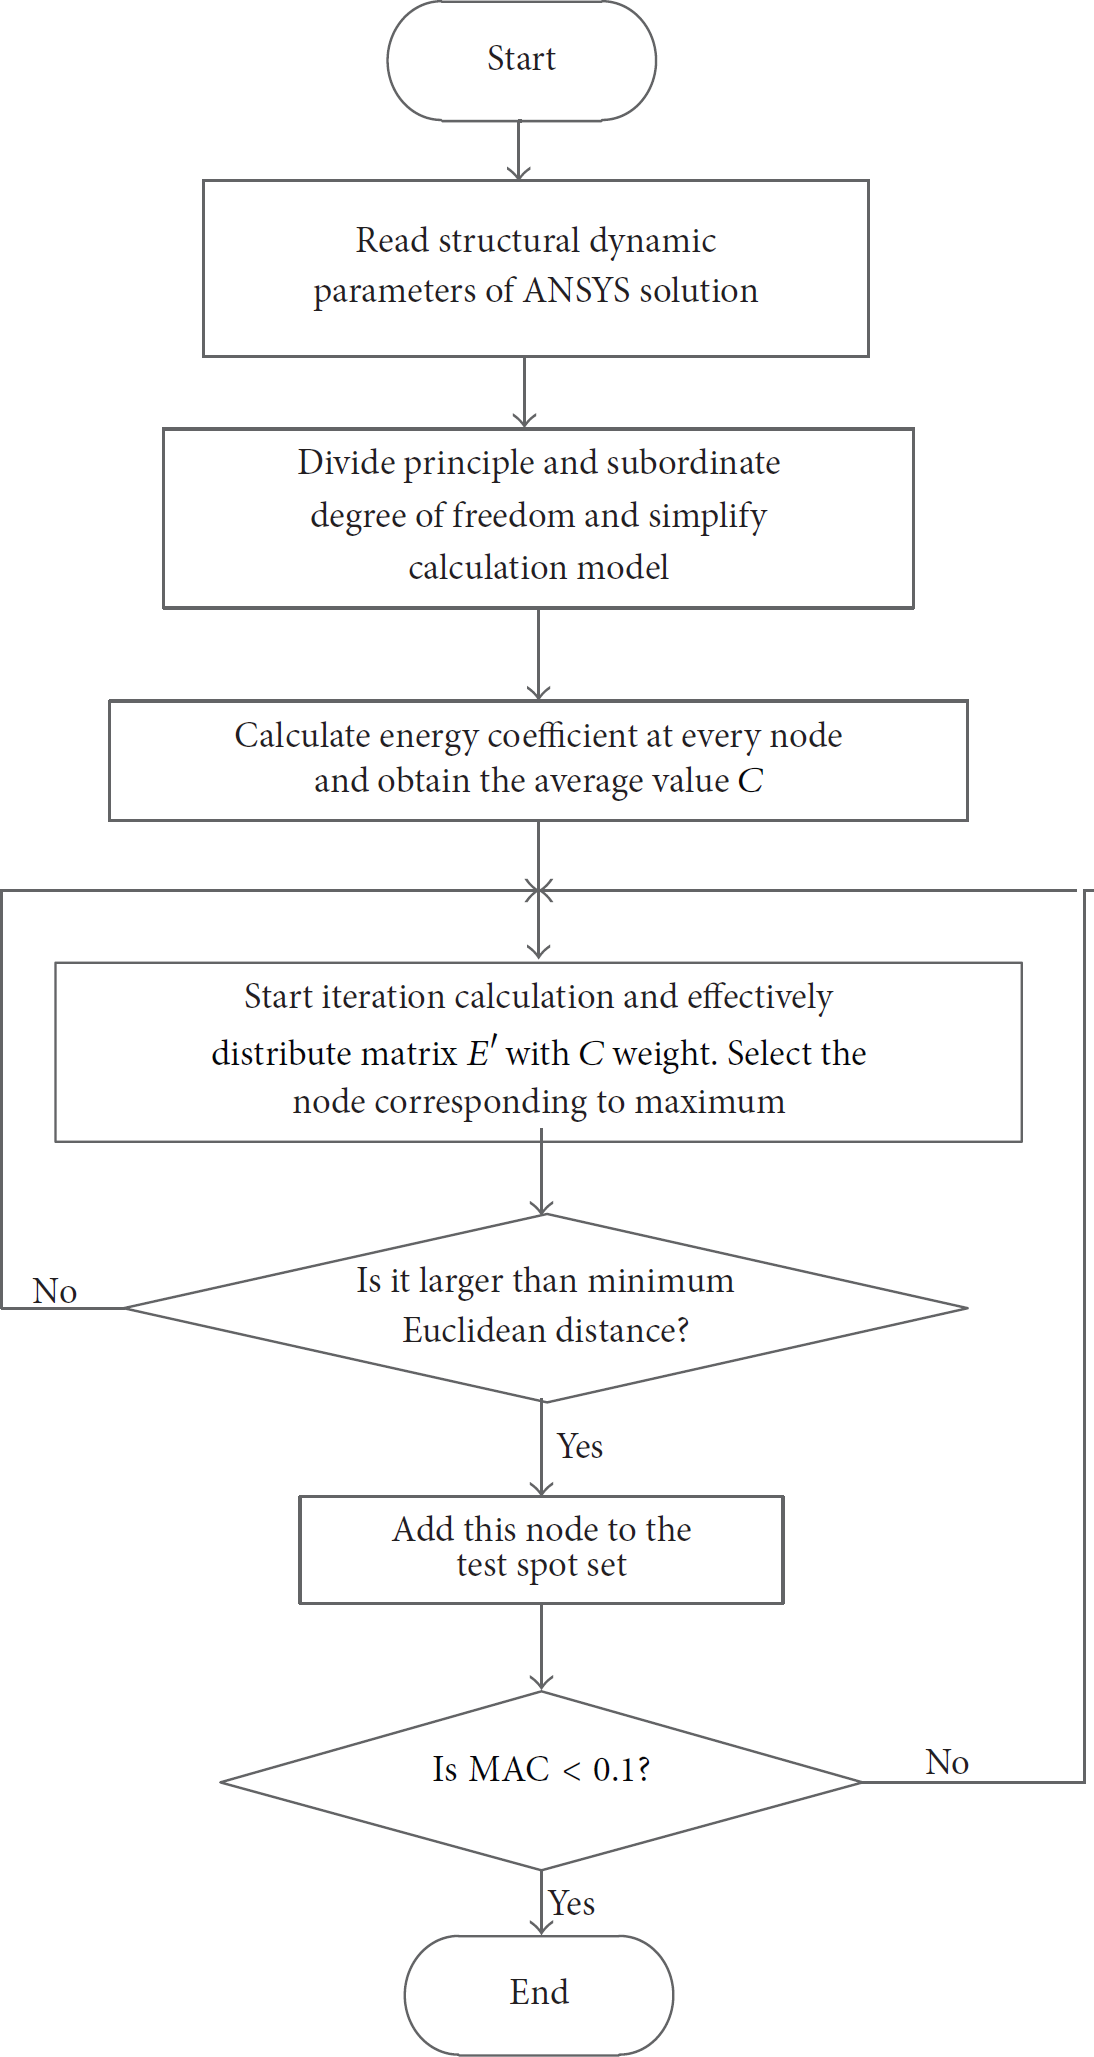
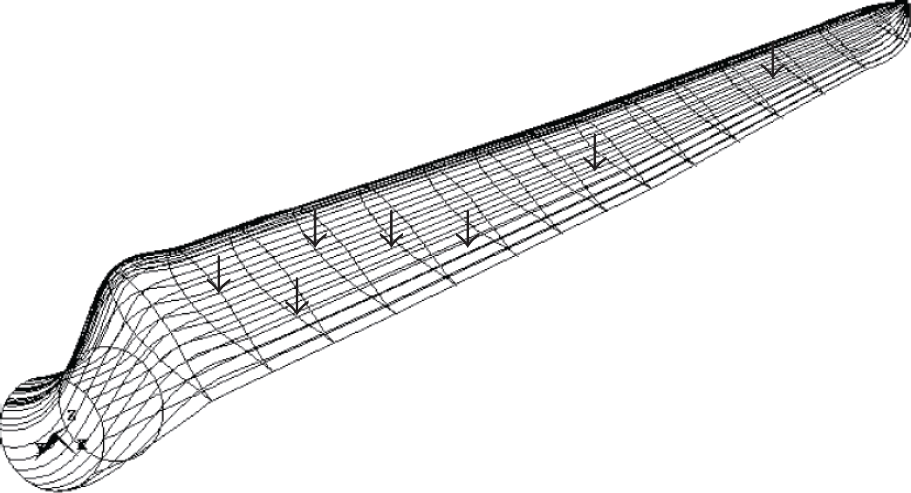
Figure 2 shows ANSYS finite element model of FY-300 horizontal axis wind turbine blade made of fiber glass with length of 1.5 m. In the modeling of blade, the Shell 99 unit is used with material density of 1950 kg/m3, elasticity module of 16.5 GPa, and Poisson ratio of 0.305.
Finite element model of blade.
4.1. Modal Analysis
Table 1 shows the frequency information of waving vibration in the first four orders analyzed by vibration modal analysis of blade by ANSYS. Following numerical calculation and experiment mainly use the combinational algorithm of waving vibration exploration with correctness and effectiveness because of the limitation of swing vibration mode [15].
Natural frequencies of waving vibration for the first four orders of blade.

4.2. Optimal Layout of Sensors
There are 377 nodes and 2262 degrees of freedom in blade model. The low-order vibration mode of blade mainly takes waving vibration as principle, so this work focused on the optimal layout of displacement sensors in waving direction (direction y as shown in Figure 2). In other words, degrees of freedom in waving direction are divided into main degrees of freedom and subordinate degrees of freedom. In addition, it is difficult to place sensor at the blade tip, so the selection range of test spots is
Programming is conducted by steps of combinational algorithm with MATLAB. After determining the minimum distance threshold, the result of optimal algorithm is solved with this program. Figure 3 shows MAC matrix of final allocation plan of test spots. When there are 7 test spots, the maximum nondiagonal element of MAC matrix has been less than 0.1, satisfying the optimization requirement. Table 2 and Figure 4 show the layout result by final combinational algorithm. Meanwhile, 4 initial test spots are selected by QR decomposition, and 3 test spots were selected by effective independence and effective independence driving-point residue method [16] to compare and analyze the optimization results by combinational algorithm. Figures 5 and 6 show the layout results with 7 test points by these two methods, respectively.
Optimal layout of sensors by combinational algorithm.

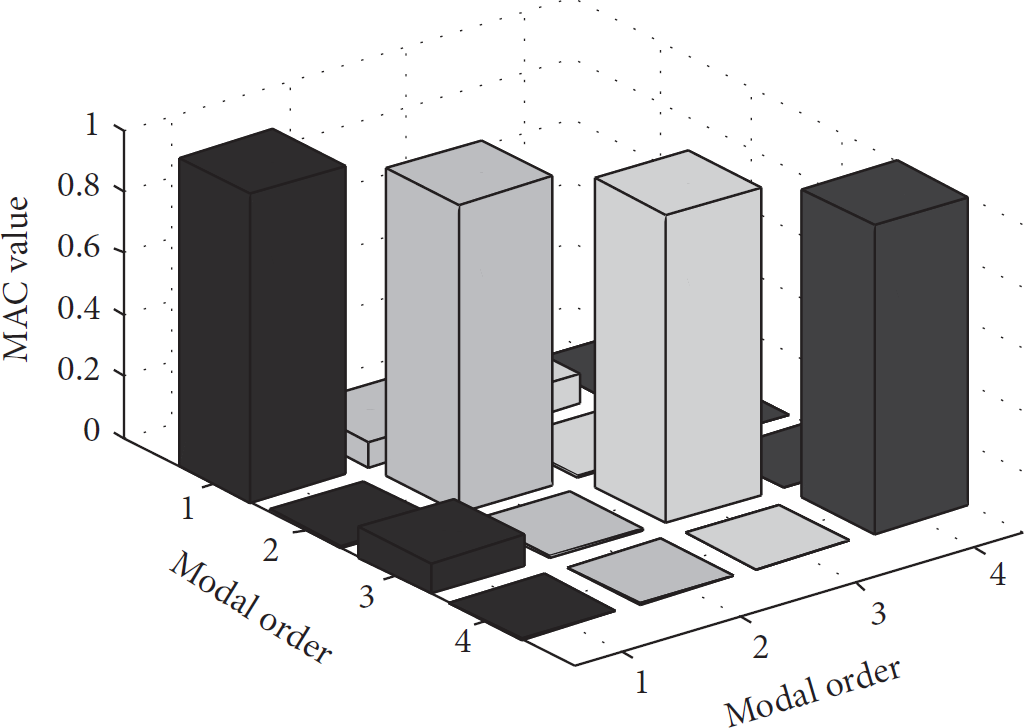
Histogram of MAC matrix.
Sensor layout obtained by combinational algorithm.

Sensor layout obtained by effective independence.

Sensor layout obtained by effective independence driving-point residue method.
4.3. Evaluation of Layout Plans
In order to compare above three layout plans for test spots on blade, this work applied conducted comparison calculation for these three plans with the most common criterions for optimization comparison in engineering [17].
4.3.1. Regional Distribution of Node and Correlation Index
Figure 4 shows that the distribution of test spots in all layout plans obtained by combinational algorithm is rational. Moreover, the most spots are located in the place with large change, including blade root and wings, which is basically consistent with the worst working conditions in large-scale fan blade [18]. Therefore, blade damage can be obtained completely. Figures 5 and 6 show that there is regional concentration of test spots by the other two methods. For example, with effective independence, the test spots are mainly concentrated in blade. The correlation coefficients between nodes 5 and 6 and nodes 127 and 128 have been 0.995 and 0.949. This may cause information redundancy to a great extent.
4.3.2. Modal Assurance Criteria
Modal assurance criteria matrix is a good tool to evaluate the orthogonality of vibration vector space. Its formula is as follows:

4.3.3. Least-Mean-Square-Error Criterion
The main idea of least-mean-square-error criterion is to compound the complete vibration mode with vibration mode of the selected test spot by modal expansion technology. Then, the result is compared with that of finite element simulation result, and different plans are quantitatively analyzed with the average square. The smaller the difference between squares of two vibration modes is, the stronger the ability of optimization plan to catch the kinetic feature of modal will be. The minimum average square between the measured vibration mode in ith order and finite element result can be expressed as follows:

Comparison of average square by optimal vibration mode and simulation vibration mode.

5. Experimental Verification
Above-mentioned small-scale blade was selected to establish experimental platform with tail fixed with 7 rows of bolts. Then, vibration sensors were attached to blade surface at the location obtained by three algorithms. In the experiment, vibrational excitation was conducted to blade by hammering method, and CGJ1-8595 piezoelectric accelerometer was arranged at every test spot. DH5937 data collection and analysis system was used to obtain blade vibration data, and DY-300-60 electrical vibration system was used to produce limited band white noise to simulate environmental excitation with bandwidth of shock excitation in range of 30 Hz~346 Hz. Figure 7 shows the experimental installation pictures.
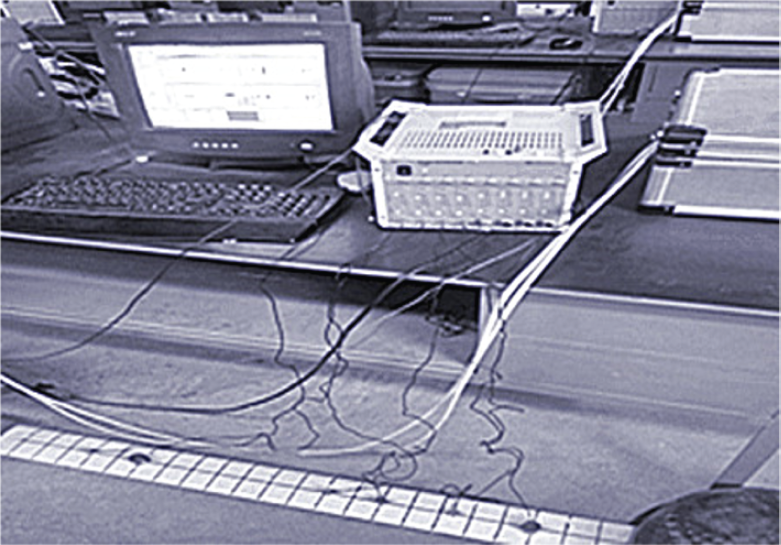
Collection installation in laboratory.
The environmental excitation borne by blade in actual working condition cannot be measured, and effective excitation is difficult to be applied to blade structure and shape, so this work adopted cross-spectrum density method which can effectively identify the structural modal parameters with output response, to obtain the blade modal parameters. Then, the inherent frequency of blade was further determined by checking the phase distribution of sensor channels and coherence function. Finally, the transmissibility curve was used to obtain the fitting figure of blade vibration mode by curve fitting. Figures 8 and 9 show the amplitude and phase section in cross-power spectrum between reference point and one response point of blade.

Amplitude in cross-power spectrum between response point and reference point.

Phases in cross-power spectrum between response point and reference point.
Table 4 shows the comparison of frequency results with three layout algorithms actually measured by experiment and calculated by ANSYS. It can be seen that the error of frequency in different orders by the method in this work is lower than that by other two algorithms, and the errors are all less than 4%. It indicates that this method to arrange acceleration sensors can reflect the real kinetic characteristics of reaction structure. Figures 10, 11, and 12 show the comparison between the vibration modes measured by three algorithms and the complete vibration mode of blade number. It can be seen that the vibration mode obtained by combinational algorithm is the closest to the ideal vibration mode displacement by ANSYS, while the node with large kinetic response cannot be caught effectively by the other two algorithms. Figures 10, 11, and 12 prove that the plan proposed in this work can catch the complete vibration mode of structure well and describe the real condition of blade correctly. This method lays the foundation for the subsequent damage identification.
Comparison between results of experimental frequency and numerical frequency.

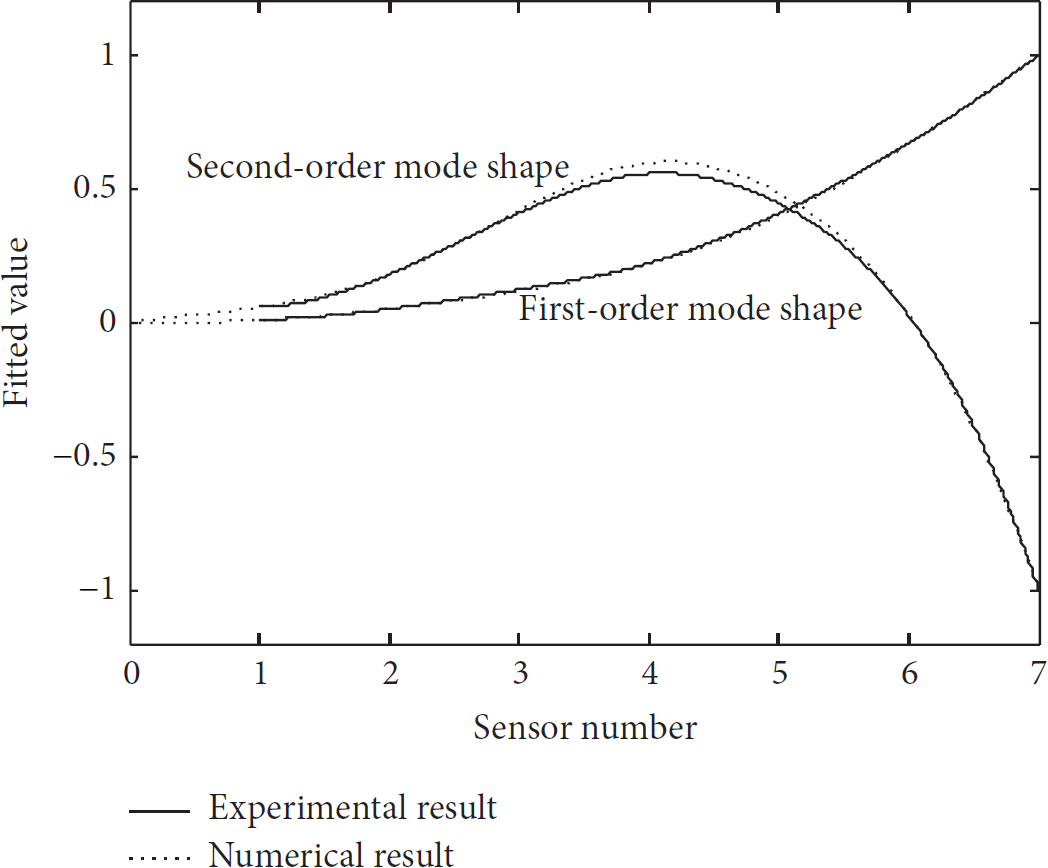
Comparison of vibration modes between experiment and numerical simulation by this method.

Comparison of vibration modes between experiment and numerical simulation by effective independence.

Comparison of vibration modes between experiment and numerical simulation by driving-point residue method.
6. Summary and Conclusions
This work proposed a combinational layout algorithm with good comprehensive performance to solve the problem that the sensor layout in monitoring system of fan blade structure is unreasonable. By numerical calculation and experimental verification, following conclusions are drawn.
Average energy coefficient is taken as the correction coefficient of effective independent matrix to make all the monitoring states have the same energy contribution. Therefore, the information loss caused by the large difference among modals is prevented effectively. Euclidean distance is introduced as iteration condition to effectively avoid information redundancy between two close test points. In addition, Combinational optimization algorithm and two traditional algorithms are applied to monitoring system of blade to obtain three layout results with 7 test spots. By comparison, we can obtain that combinational algorithm can make the regional distribution of test spots more rational and effective. Therefore, this method has better modal observability to catch dynamic features accurately and improve the accuracy of monitoring system effectively.
Footnotes
Conflict of Interests
The authors declare that there is no conflict of interests regarding the publication of this paper.
Acknowledgments
This work was supported by Science and Technology Support Fund of Lanzhou Jiaotong University (ZC2012008) and College Research Program of Gansu Province (42015274).