
Abstract
Link duration between two vehicles is considered an important quality of service metric in designing a network protocol for vehicular networks. There exist many works that study the probability density functions of link duration in a vehicular network given various vehicle mobility models, for example, the random waypoint model. None of them, however, provides a practical solution to estimating the link duration between two vehicles on the road. This is in part because link duration between vehicles is affected by many factors including the distance between vehicles, their turning directions at intersections, and the impact of traffic lights. Considering these factors, we propose the extended link duration prediction (ELDP) model which allows a vehicle to accurately estimate how long it will be connected to another vehicle. The ELDP model does not assume that vehicles follow certain mobility models; instead, it assumes that a vehicle's velocity follows the Normal distribution. We validate the ELDP model in both highway and city scenarios in simulations. Our detailed simulations illustrate that relative speed between vehicles plays a vital role in accurately predicting link duration in a vehicular network. On the other hand, we find that the turning directions of a vehicle at intersections have subtle impact on the prediction results.
1. Introduction
Vehicular ad hoc network (VANET), a special type of mobile ad hoc network (MANET), provides both intervehicle and vehicle-roadside communications via the dedicated short range communications (DSRC). Despite their similarity, VANETs differ from generic MANETs because vehicles' movements are constrained by urban and/or highway road network topologies. VANETs are able to provide various services, for example, safety message dissemination [1,2], entertainments [3], location based service [4], dynamic traffic management [5–7], social networking [8], and information recommendation between vehicles [9]. To realize such visionary networks, we proposed several multihop routing protocols for VANETs [10–13]. From the previous works, we realized that a VANET routing protocol's performance is highly influenced by link duration between vehicles [14]. Specifically, it significantly affects the end-to-end delay, packet loss rate, and throughput of a routing protocol in VANETs.
The importance of link duration, regarding network performance, was intensively studied in MANETs and wireless sensor networks [15,16]. Simulation results [17] also confirmed that link duration is a critical factor in designing a routing protocol for VANETs. To model link duration in a VANET, however, only a few analytical models are presented [18–21]. A model for link duration between vehicles in one-dimensional highway scenarios is first proposed in [22]. More link duration models for city scenarios are then provided in [23–25]. In [26], we propose a link duration prediction (LDP) model that is suitable for both highway and city scenarios. In the above-mentioned works, however, the impact of vehicles turning at intersections is not adequately considered. Besides vehicle turnings, intervehicle distances, vehicle velocities, and traffic lights also affect link duration in a VANET. To obtain a deeper understanding about link duration in a VANET, we first analyze the relative velocities between vehicles. Simulation results reveal that the relative speed of two vehicles closely follows the Normal distribution. Therefore, we propose to use the distribution of relative speeds, instead of instantaneous ones, to estimate link durations between vehicles.
We extend the LDP model [26] to the extended link duration prediction (ELDP) model that allows a vehicle to practically estimate link durations between itself and neighboring vehicles. The main instrument of this work is to approximate the distribution of relative speeds between vehicles. After the distribution parameters are estimated, the expected link duration information is computed. While estimating link durations, our model also considers the initial distances between vehicles, their turning directions (at intersections), and the impact of traffic lights. To filter outliers, the ELDP model uses the exponential moving average (EMA) method to process relative velocity samples. According to simulation results, a vehicle only needs the latest five relative speed samples to get an accurate estimation.
There are four major contributions of this paper. First, we propose the ELDP model which provides a way for a vehicle to predict, in real time, the link durations between itself and nearby vehicles. Second, we implement the model so that a vehicle can automatically collect velocity samples and accurately estimate the relative velocity distribution. Third, the ELDP model considers the impact of a vehicle's turning decisions at intersections. Forth, we validate the ELDP model and evaluate its performance in simulations. Results show that ELDP can accurately predict the link duration in a VANET.
The rest of the paper is organized as follows. Section2 summaries the related work. The ELDP model is introduced in Section3 along with the method of accurately estimating the parameters of relative velocity distributions. In Section4, we validate our model and evaluate its performance in both highway and city scenarios. We draw conclusions in Section5.
2. Related Work
Link duration refers to the time interval during which two nodes are connected in a wireless network. Link duration between nodes in a MANET is determined by many factors, for example, channel conditions, distances, and interference levels. These information keep changing in a MANET, due to time-varying radio environments and node mobility. Wu et al. in [27] investigate the impact of node mobility on link duration in a MANET and develop an analytical framework to model link duration. This model is used to analyze both point-to-point and multipoint link durations. The model is then validated in simulations where node mobility follows the random waypoint mobility model [28], random walk model [29], reference point group mobility [30], and reference velocity group mobility model [31]. Unfortunately, none of these mobility models is applicable in VANETs.
Although various mobility models have different impacts on link duration analysis, previous works [32,33] also show that the link duration in a MANET can be effectively approximated using an exponential distribution. In [18,19], it is found that an exponential distribution is a good approximation of the link duration in VANETs. However, [20] presents a different result that the probability density function (pdf) of link duration in a VANET is close to the log-Normal function. Yan and Olariu [21] also show that the link in VANETs is a log-Normal function given the following two assumptions: (1) the pdf of intervehicle distance is a log-Normal function and (2) a vehicle's velocity is deterministic.
Because link duration is so important in a MANET, some research works focus on predicting the link duration in a MANET. Although the random waypoint model [28] is widely used, it is clear that different mobility models have different impacts on the link stability in a MANET [34]. For example, Hua and Haas study several path-selection algorithms with different mobility models [35]; however, the algorithms cannot be used to predict link duration in a MANET. Haas and Hua in [36] propose a mobile-projected trajectory algorithm to estimate the residual link lifetime (RLL) between two nodes in a MANET. In [37], Korsnes et al. consider the link age information, that is, how long a link has been up, in estimating the RLL of a link. Then, Hua and Haas propose another RLL-prediction algorithm in [38], based on the Kalman filter approach. All the above-mentioned link lifetime prediction methods cannot be used in VANETs because vehicle movements do not follow any existing mobility models.
In [18–21], the pdf of link duration in a VANET is analyzed. Shelly and Babu in [18] study link duration in a VANET by assuming a free-flow traffic state. Nekovee studies the pdf of link duration in a VANET by assuming a constant distance between vehicles and ignoring the impact of vehicle mobility [39]. Later on, he extends the work by considering that a vehicle's velocity follows the Normal distribution [40]. In [41], an analytical framework for single-hop link duration in a VANET is presented. In [42], it is found that link duration in a VANET can be affected by vehicle movements and channel randomness. Nevertheless, all the above analytical models are not applicable for VANETs in urban scenarios.
In a two-dimensional urban scenario, Artimy et al. analyze the network connectivity of a VANET [24]. Based on the cellular automata model, Viriyasitavat et al. provide a comprehensive analytical framework for network connectivity in an urban VANET [23]. Factors such as traffic lights are considered in this model. The events of two consecutive vehicles encountering a traffic light are considered to be independent, which is however not true in reality. Considering intervehicle distances, vehicle speeds, turning ratios at intersections, and traffic lights, Hu et al. [25] propose a discrete Markov process-based model for link duration estimation. In [26], Wang et al. present the LDP model to estimate the link duration in VANETs, in both urban and highway scenarios. Factors such as relative speeds, traffic lights, and distances between vehicles are considered in the LDP model. One limitation of the LDP model is that it focuses on straight roads and cannot be applied in real-world VANETs. To the best of our knowledge, we propose the first model to practically predict the link duration between two vehicles in urban and highway VANETs.
Besides analytic results, research works on VANET simulations are also important in the study of link duration. For example, the impact of a traffic light on a vehicle's movements has been well studied in SUMO—Simulation of Urban Mobility. SUMO is a microscopic, inter- and multimodal, space-continuous, and time-discrete traffic flow simulator [43]. With the proposed Car-Driver model, vehicles in SUMO dynamically change their speeds based on the speed of the leading vehicle (s). That also means a collision-free traffic is simulated in SUMO [44]. Traffic lights in SUMO are modeled based on the junction-based right-of-way rules: that is, only the vehicles facing green signals are allowed to enter intersections. Since it was released in 2002, SUMO has evolved into a full-featured toolkit for vehicular traffic simulation and modeling. SUMO is widely used in studying vehicular communications, optimal route selections, dynamic navigations, and traffic light algorithms [45]. For example, SUMO is used to validate an image-based traffic light control algorithm in [46]. The algorithm in [46] processes images captured by the cameras installed in a road intersection; it then changes the traffic light's signal based on the queue length of vehicles. Due to legal constraints, the proposed algorithm has to be first tested in simulations before it is applied in a real-world system.
In 2012, SUMO was selected as the traffic simulator in the EU FP7 COLOMBO project that aims at delivering a reliable traffic management system for traffic surveillance and advanced traffic light control [47]. According to reports [48,49], traffic lights play an important role in traffic modeling and traffic management. The importance about how traffic lights affect vehicle movements are completely studied in [48,49]. For example, it is pointed out that simulation scenario (e.g., a single intersection, corridor, or network) and the road network (e.g., numbers of lanes) are important in modeling a vehicle's behavior in front of a traffic light. Based on these findings, we propose to consider the impact of traffic lights in our link duration prediction model. The ELDP model complements existing research on traffic simulation because we consider not only the impact of vehicles turning at intersections but also the impact of traffic lights in the model.
3. ELDP Model
To accurately estimate how long two vehicles will be connected, a link duration prediction model has to address the following challenges. First, it needs to consider dealing with the impact of vehicles turning at intersections. Second, the model must accommodate the frequent changes in vehicle speeds. Third, the model must be able to handle the impact of traffic lights on the prediction of link durations. In this section, we will illustrate how to address these three technical challenges in detail.
3.1. Impact of Vehicles Turning at Intersections
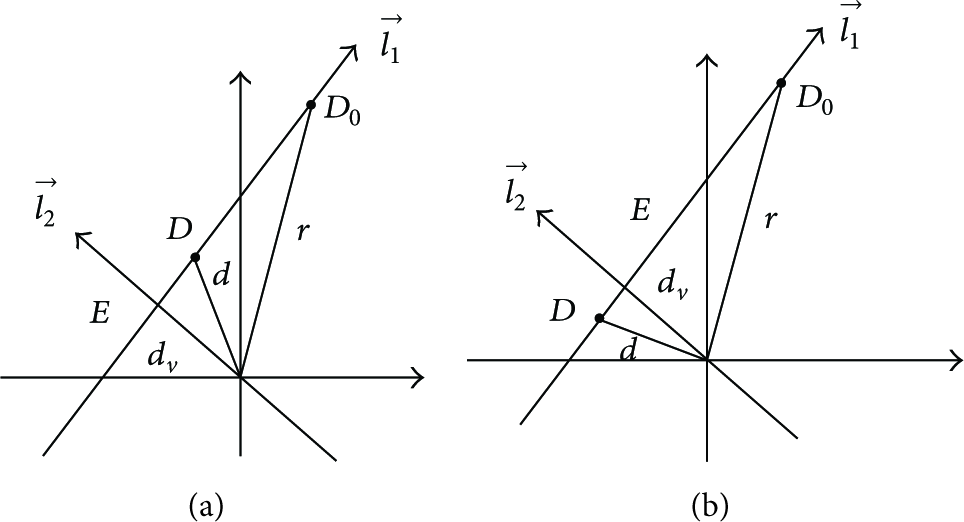
As shown in Figure1(a), we use α to denote the angle from the positive x-axis to a vehicle's moving direction. Given two vehicles in front of an intersection, we consider the location of one vehicle the origin and then construct a planar coordinate system, as shown in Figure1(b). Since

A planar coordinate system for analyzing relative velocity.
To understand link duration between two vehicles at an intersection, we denote their velocities as

From Figure1(b), we can compute the relative velocity between these two vehicles as

If we consider the first vehicle (with velocity

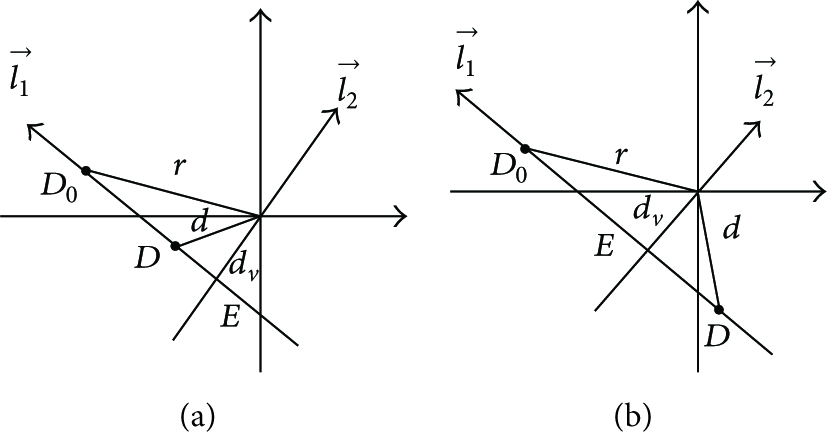
A transformed coordinate system.
Let us denote the locations of these two vehicles in the original coordinate system as
Because


In the example shown in Figure2, the distance from D to
In the first case, we have
Computation of relative moving distance
In the second case, we have
Computation of relative moving distance
The third case is illustrated in Figure5, where we have

Computation of relative moving distance
In the last case, we have

Computation of relative moving distance
In summary, when
3.2. Distribution of Relative Speed
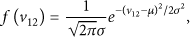
Previous works [18,40,50] indicate that the speed of a vehicle generally follows Normal distribution. Let us assume that a vehicle's speed v follows Normal distribution

Given two vehicles, we denote their velocities as


3.3. Principle of the ELDP Model
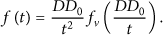
Based on the parameters of relative speed distribution and
We consider the link duration between two vehicles a random variable T. The distribution of T depends on (1) relative speed v, (2) initial distance d between them, and (3) their relative moving direction. Because these factors keep changing when these two vehicles move, the ELDP model needs to adaptively adjust prediction rules in order to compute an accurate result.
We first give the cumulative density function (CDF) of T as follows:


Because v follows Normal distribution, we know that about 99% samples of v fall within the range [
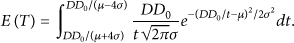
The above equation can be used to predict the link duration of two connected vehicles given their relative speed distribution and initial distance. So far, the model only considers the case where there is no traffic light at intersections. It is important to investigate how link duration prediction is affected if vehicles change their moving directions at intersections.
In our previous work [26], we addressed this issue by assuming that the events of two consecutive vehicles encountering traffic lights are dependent. In other words, which traffic signal the second vehicle faces depends upon the traffic signal that the first vehicle encounters. This phenomenon was observed and analyzed in [25,26]. To address this issue, we first compute the probabilities where (1) both vehicles face red signals, (2) the first vehicle faces red signal and the second vehicle faces green signal, (3) both vehicles face green signals, and (4) the first vehicle faces green signal and the second vehicle faces red signal. In each case, we adjust the parameters
3.4. Link Duration Prediction Algorithm
Based on the ELDP model, a vehicle could predict the link durations between itself and any other vehicles. We assume that vehicles
To reduce prediction error, a sliding window method is adopted on each vehicle: that is, a vehicle only saves its most recent 5 velocity samples. It then computes its relative speeds with regard to other vehicles. Because vehicles
Furthermore, to address the sudden change of a vehicle's velocity (due to breaking, overtaking, or turning), the relative speeds need to be preprocessed by the EMA (Exponential Moving Average) method as follows:

The algorithm of computing the expected link duration between vehicles

Flowchart of predicting link duration between vehicles
4. Performance Analysis
Because vehicle mobility significantly affects ELDP's accuracy, we simulate vehicle movements via the VISSIM simulator [51]. This simulator is widely used to simulate realistic automotive motions at a microscopic level. VISSIM provides a toolkit for transportation simulations, a user-friendly graphic user interface. It is not only able to simulate large-scale vehicular networks, but also supports traffic lights, lane changes, and speed regulations.
In the simulations, we consider both highway and city scenarios to evaluate ELDP's performance. To evaluate the performance of ELDP, we focus on the cases where vehicles encounter intersections and make turns in both highway and city scenarios. The cases where vehicles move without changing directions were completely evaluated in our previous work [26]. In the simulations, we note that the relative direction of two vehicles significantly affects the ELDP's performance: that is, when two vehicles move towards (away from) each other, the relative distance between them keeps decreasing (increasing), which will change the rules in ELDP in predicting link durations.
4.1. Highway Scenario
The simulation configuration parameters for highway scenarios are listed in Table1. We first analyze many trace files generated by the VISSIM and divide vehicles into two groups. In the first group, there are two vehicles that connect to each other and move in the same direction. In this group, one vehicle turns and changes its moving direction from 0 to
Simulation setup parameters in highway scenarios.

4.1.1. Moving in the Same Direction
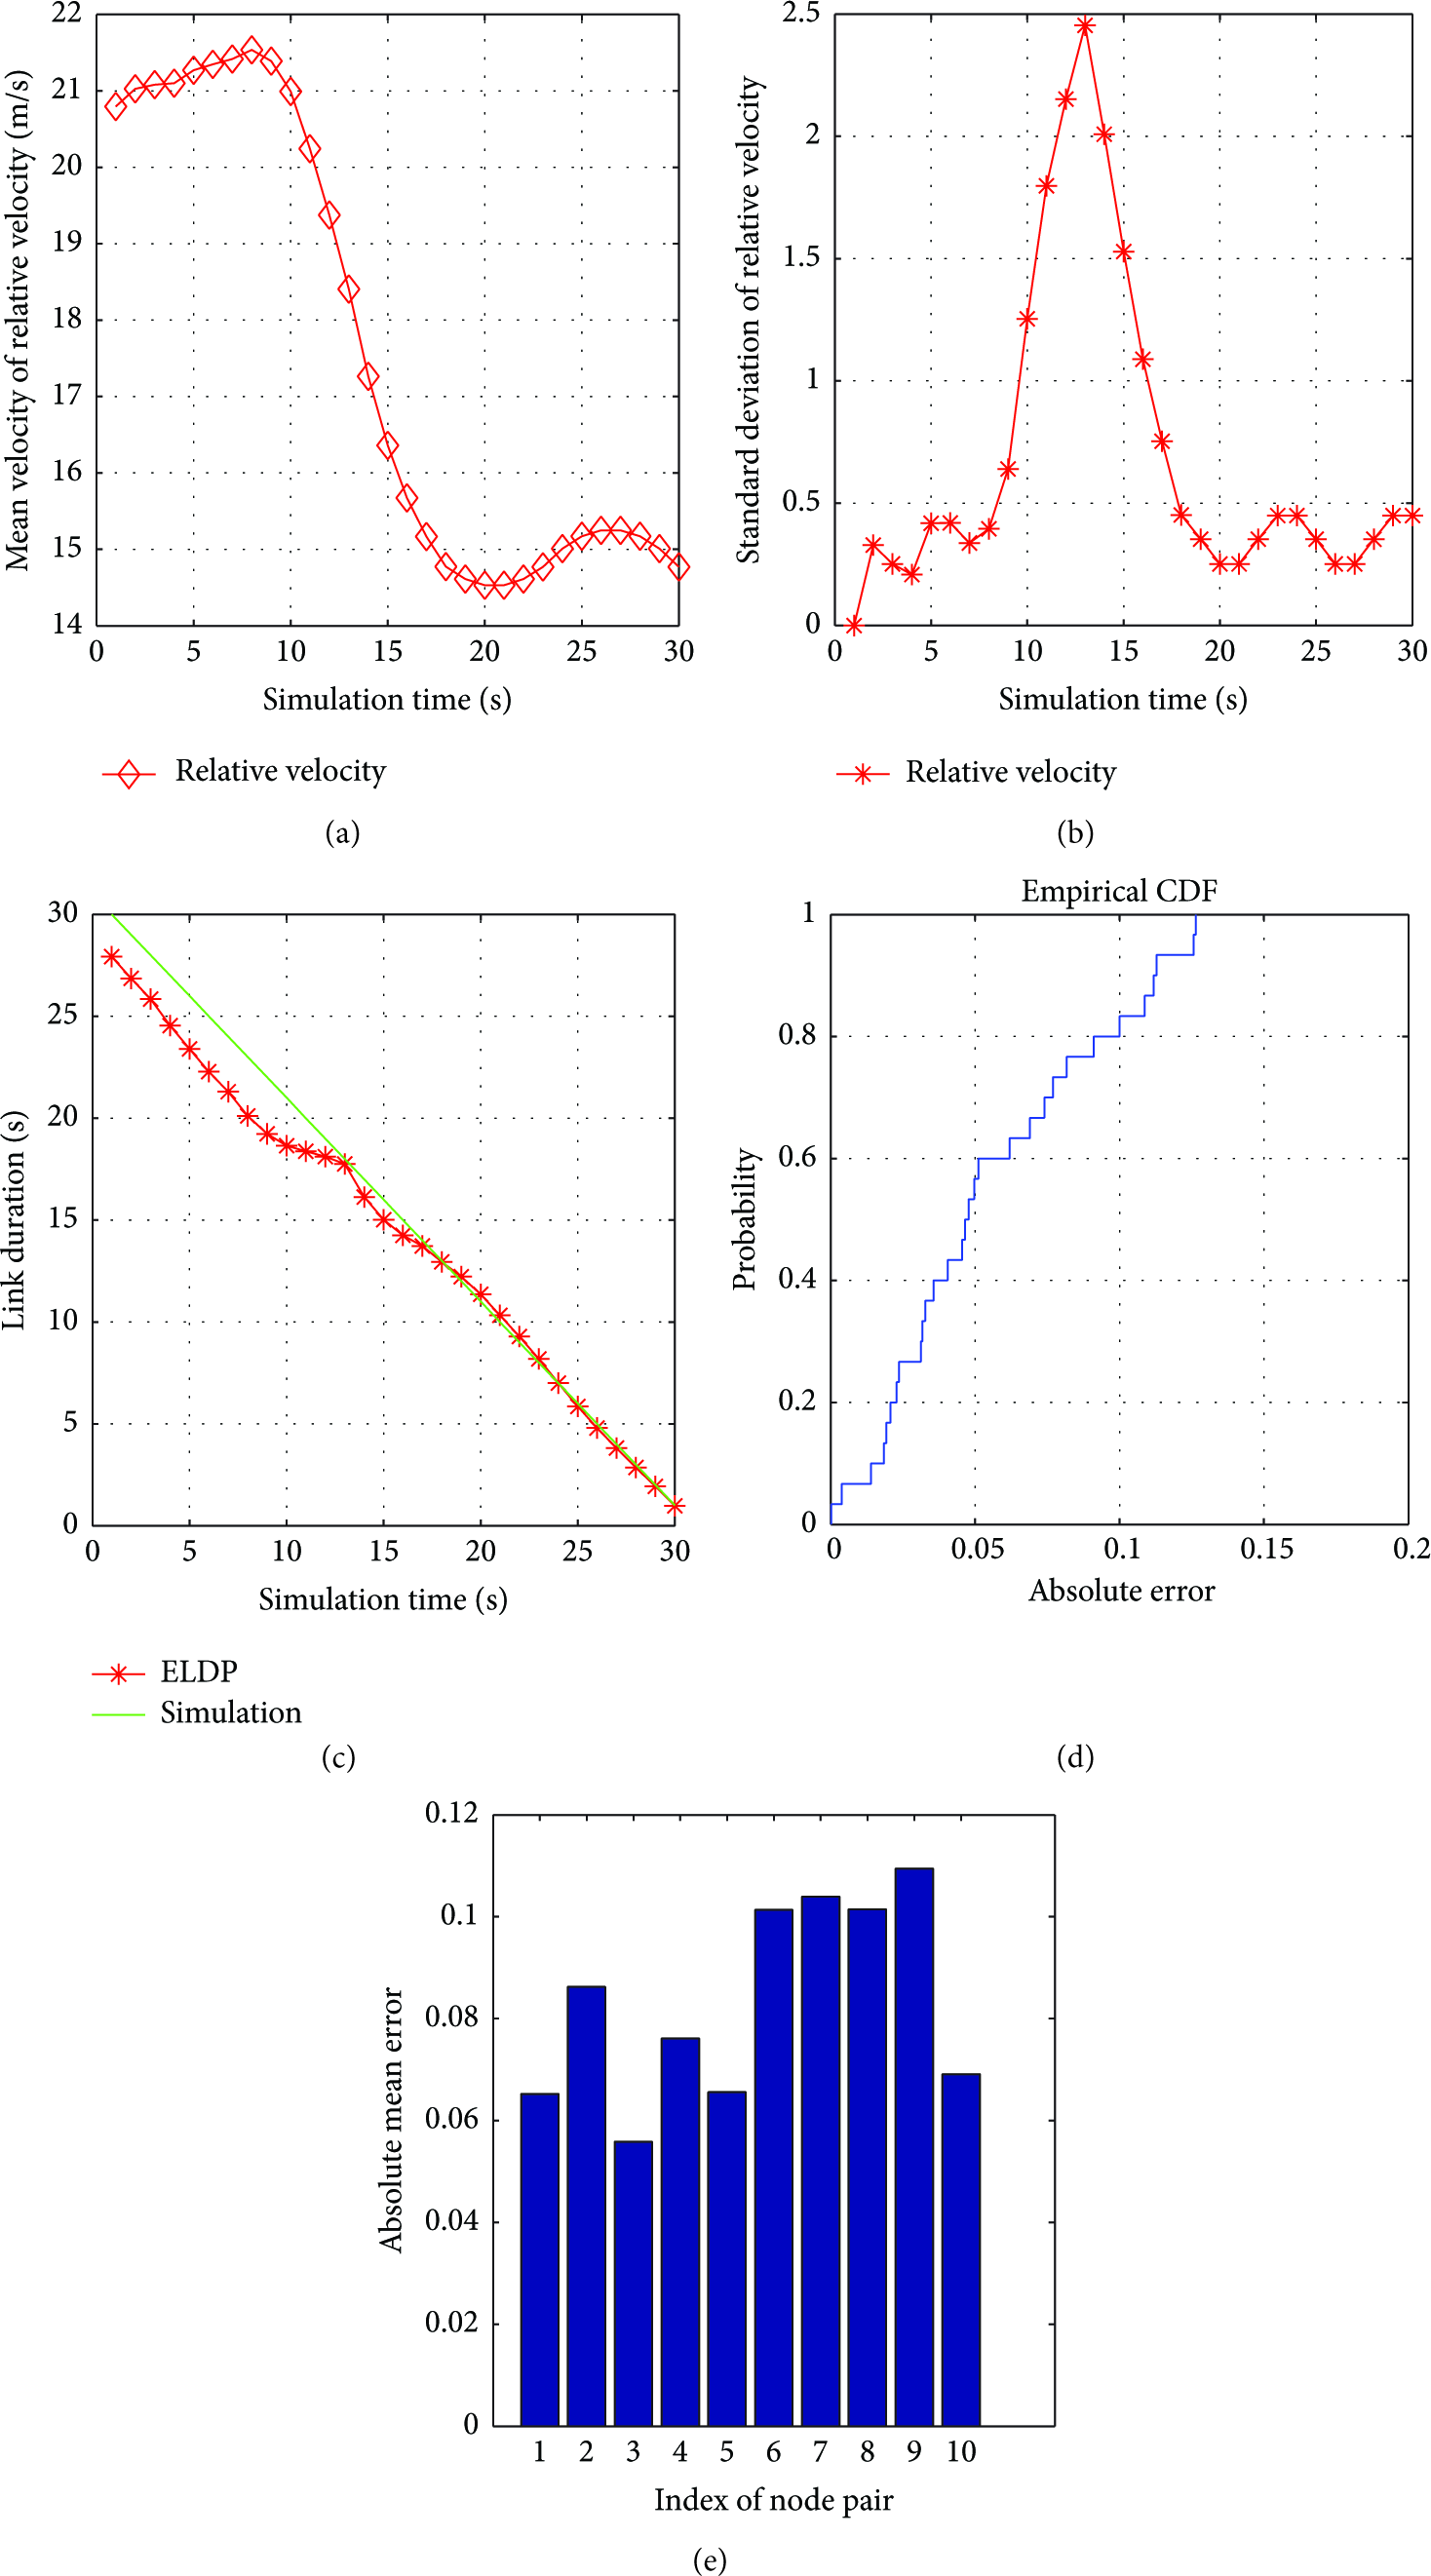
We first study the ELDP's performance on two vehicles moving in the same direction. We are interested in the cases where one vehicle turns and the other does not. We randomly select a pair of vehicles and plot the mean of their relative speed in Figure8(a). As we can see, the two vehicles are connected at the

One vehicle turns and the other one keeps moving in a highway scenario. After the turning, two vehicles move in the same direction.
We compare the predicted link durations and the ground truth in Figure8(c). We can see that the estimated results from ELDP match the ground truth very well, indicating ELDP is an accurate model. To obtain a deeper understanding of the ELDP's performance, we further plot the CDF of prediction errors in Figure8(d). We also randomly select 10 pairs of vehicles and plot the mean prediction errors in Figure8(e). From Figure8(d), we find more than
4.1.2. Moving in Opposite Directions
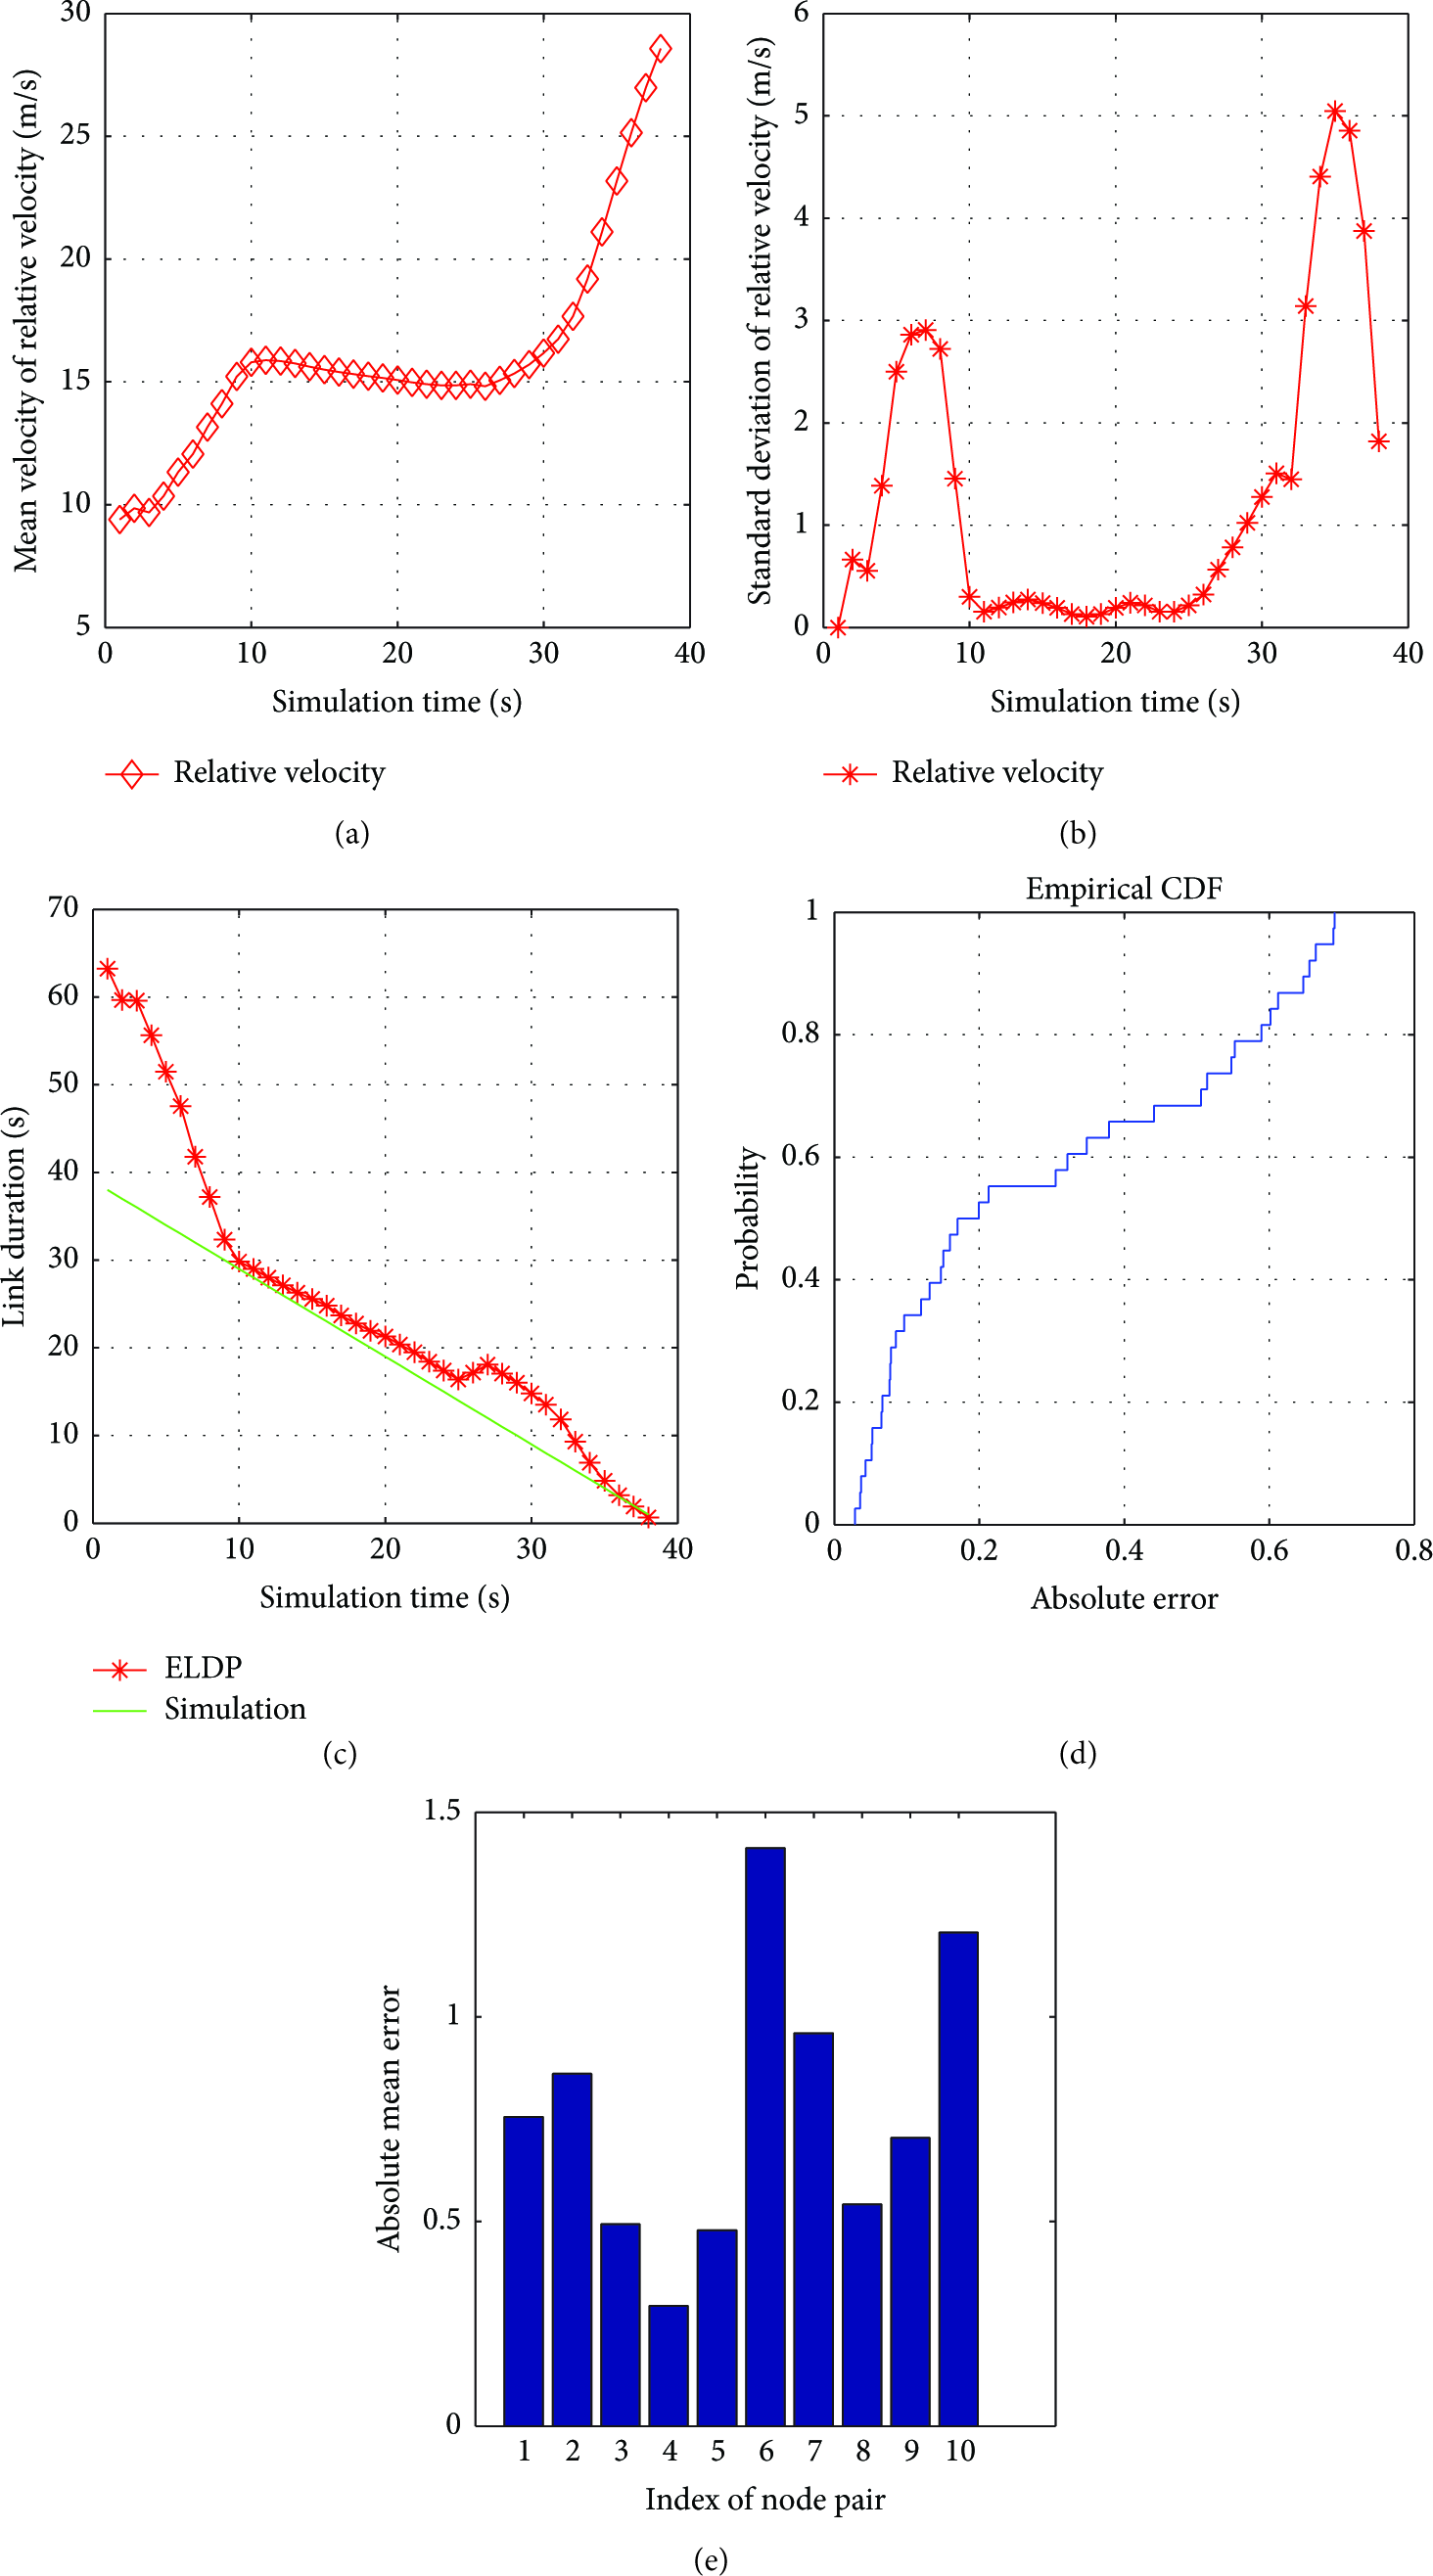
We then look at the cases where two vehicles move in opposite directions. Similarly, we only select the cases where one vehicle turns and the other does not. We randomly select a pair of vehicles and plot the mean and standard deviation of their relative speed in Figures9(a) and9(b), respectively. From the figures, we find that the relative speed keeps decreasing but decreases faster after the

One vehicle turns and the other one keeps moving in a highway scenario. After the turning, two vehicles move in opposite directions.
We further plot the predicted link durations and the ground truth in Figure9(c). We can see that the estimated results from ELDP are very close to the ground truth. We also plot the CDF of prediction errors and the mean prediction errors of 10 randomly selected pairs of vehicles in Figures9(d) and9(e), respectively. From Figure9(d), we find more than
Overall, simulation results illustrate that ELDP works better for vehicles moving in opposite directions. In addition, a vehicle making turns on highways does not drastically affect ELDP's performance. We conclude that the turning angle of a vehicle is not an influential factor in ELDP.
4.2. City Scenario
It is challenging to accurately predict the link duration between two vehicles in a city scenario. This is mainly because it is difficult, if not impossible, to predict what traffic signal a vehicle will face in front of an intersection. Besides, vehicles can make turns at intersections, which makes the link duration prediction a nontrivial problem. To realistically simulate vehicle movements in city scenarios, we configure the VISSIM simulator based on the parameters given in Table2.
Simulation setup parameters in city scenarios.

Based on the trajectories of vehicles at an intersection, we categorize connected vehicles into three groups: (1) one vehicle moves straightforward and the other makes a left/right turn, (2) one vehicle turns left and the other turns right, and (3) both turn to the same direction. After turns, the two vehicles may move in the same direction, in opposite directions, or with a relative angle of α.
4.2.1. Moving Forward versus Making Turns
Here, we are interested in pairs of connected vehicles: one moves straightforward and the other turns to left/right. We divide these vehicles into three groups. After turns, (1) both vehicles move in the same direction, (2) both move in opposite directions, and (3) the relative moving direction of them is
Moving in the Same Direction. For the first case where two vehicles move in the same direction, we randomly pick a pair of vehicles and plot the predicted and real link durations in Figure10(c). We can see that these two vehicles connect for about
One vehicle turns and the other one keeps moving in a city scenario. After the turning, two vehicles move in the same direction.
To understand the fluctuation in data in Figure10(c), we further plot in Figure10(b) how relative speed changes over time. This figure indicates that, during
We also plot the CDF of error and the mean errors of 10 randomly selected pairs of vehicles in Figures10(d) and10(e). In Figure10(d), more than
Moving in Opposite Directions. For this case, vehicles move in opposite directions after one vehicle turns at an intersection. In Figure11(a), we provide the predicted and actual link durations of a pair of randomly selected vehicles. The first vehicle faces a red signal at

One vehicle turns and the other one keeps moving in a city scenario. After the turning, two vehicles move in opposite directions.
Similarly, we plot Figures11(d) and11(e). From these figures, we find more than
Moving Directions with a Certain Angle. For the last case, we are interested in two vehicles moving with a relative angle α, after one vehicle turns at an intersection. We first plot the mean and standard deviation of their relative speed in Figures12(a) and12(b). The two figures help us to understand what happened when they are approaching the intersection. We plot the predicted and real link durations in Figure12(c). We can see that the predicted errors are very small no matter whether a vehicle turns at the intersection or not. We also plot the prediction error CDF and the mean errors of 10 randomly selected pairs of vehicles in Figures12(d) and12(e).

One vehicle turns and the other one keeps moving in a city scenario. After the turning, the relative moving direction of them is denoted as α.
In summary, for a pair of vehicles where one moves straightforward and the other turns at an intersection, ELDP can accurately (with an error
4.2.2. Making Different Turns
For those connected vehicles that make different turns at an intersection, we divide them into three groups. After they turn at an intersection, they move (1) in the same direction, (2) in opposite directions, and (3) with
For the first case, we randomly select a pair of vehicles and plot the mean of their relative speed in Figure13(a), the standard deviation of their relative speed in Figure13(b), and the predicted and real link durations in Figure13(c). We find that, even with a large fluctuation in the relative speeds, the predicted error is small and acceptable. We plot the prediction error CDF of this pair of vehicles and the mean errors of 10 randomly selected pairs of vehicles in Figures13(d) and13(e). We find that

Two vehicles make different turns in city scenarios. After turning, these two vehicles move in the same direction.
For the second case, we pick two vehicles and plot the mean of their relative speed in Figure14(a), the standard deviation of their relative speed in Figure14(b), and the predicted and real link durations in Figure14(c). Because the second vehicle arrives at and leaves the intersection at
Two vehicles make different turns in city scenarios. After turning, these two vehicles move in opposite directions.
For the third case, two connected vehicles are randomly selected. We have the mean of relative speed in Figure15(a), the standard deviation of relative speed in Figure15(b), and the predicted and real link durations in Figure15(c). We further plot the prediction error CDF of this pair of vehicles in Figure15(d). We randomly select other 10 pairs of vehicles and show their mean prediction errors in Figure15(e). From these figures, we conclude that

Two vehicles make different turns in city scenarios. After turning, the moving directions of these two vehicles have a certain angle.
4.2.3. Making the Same Turn
Now we are looking at the cases where two vehicles make the same turn (either left or right) at an intersection. Again, we divide the vehicles into two groups. After turns, both vehicle (1) move in the same direction and (2) in opposite directions. Note that it is impossible to have two vehicles moving on directions with a relative angle because they turn to the same direction.
For the first case, we speculate that the prediction error will be large because both vehicles turn at the intersection. We pick two vehicles, of this type, which connect to each other for

Two vehicles make same turns in city scenarios. After turning, these two vehicles move in the same direction.
For a pair of randomly selected vehicles in the second case, we plot the mean of their relative speed in Figure17(a), the standard deviation of relative speed in Figure17(b), and the predicted and real link durations in Figure17(c). We can see that these two vehicles are connected during

Two vehicles make same turns in city scenarios. After turning, these two vehicles move in opposite directions.
5. Conclusions
The LDP model is extended to the ELDP model, leveraging the distribution of relative speeds, instead of instantaneous ones. Besides relative speeds, the model also considers intervehicle distance, the impact of traffic lights, and vehicles turning at intersections, in predicting link durations. Based on the model, a practical solution is implemented so that a vehicle can dynamically estimate the link durations between itself and any connected vehicles. Among all parameters, the mean of relative speed is the most important one, so accurately estimating this parameter becomes extremely critical. To eliminate the impact of sudden velocity changes, we apply the EMA method on relative speed samples so that outlier samples are filtered. Intensive simulation results show that the ELDP model is suitable and practical for accurately predicting link durations in VANETs. Particularly, a higher accuracy of prediction is achieved in the highway scenario where two vehicles move in opposite directions. Because a vehicle only needs to collect and share its latest five velocity samples, the overhead of proposed work is subtle. The extended model can be used to accurately predict link duration of any two vehicles in both highway and city scenarios. We plan to further validate the ELDP model against real-world datasets.
Footnotes
Competing Interests
The authors declare that they have no competing interests.