
Abstract
Most of the cyber-attacks are caused by malware, and damage from them has escalated from cyber space to home appliances and infrastructure, thus affecting the daily living of the people. As such, anticipative analysis and countermeasures for malware have become more important. Most malware programs are created as variations of existing malware. This paper proposes a scheme for the detection and group classification of malware, some measures to improve the dependability of classification using the local clustering coefficient, and the technique for selecting and managing the leading malware for each group to classify them cost-effectively in a massive malware environment. This study also developed the system for the proposed model and compared its performance with the existing methods on actual malware to verify the level of dependability improvement. The technology developed in this study is expected to be used for the effective analysis of new malware, trend analysis of the same malware group, automatic identification of malware of interest, and same attacker trend analysis in addition to countermeasures for each malware program.
1. Introduction
Most cyber-attacks are caused by malware, and attacks are becoming more intelligent, while damage from them has increased from cyber space to home appliances and infrastructure, thus affecting the daily living of the people. Such malware is sharply increasing every year. According to the 2014 Symantec Security Intelligence Report, the number of malware programs found in 2014 increased by 26% compared to 2013 and reached an average of 1 million a day and 317 million a year. As such, malware analysis companies have been distributing technologies for quickly collecting so many new malware programs appearing daily through various channels and responding to them. It was reported that most of the 1 million new malware programs appearing daily on average are not a new type of malware but a variation of already collected and managed malware. The response can be more effective if the nature of variation of malware is analyzed in addition to analyzing the maliciousness of each malware program and responding to it.
Several benefits can be expected through such intelligence analysis. First, static analysis and dynamic analysis are used to determine the maliciousness of a code, but there is a limitation in accurate detection. If the analyzed code is judged to be similar to the malware already known to be malicious, it can greatly help reduce false detection/missed detection. Second, since the variation of a malware is produced using the existing code, the result of analysis of the variation of malicious code provides the grounds for estimating that an attack using the malicious code is from the same attacker. Third, it can assign the priority in analyzing and responding to the one million malware programs occurring daily. When the destructive malware programs are registered in advance, an alarm can be automatically generated if a variation of the registered malware is found to enable responding with high priority. Likewise, malware programs such as dropper and downloader, which are not as destructive, can be categorized as low priority. Fourth, analyzing the change of classification of all malware programs over time will show the characteristics of the latest malware and change in production trend. As such, the analysis of variation of malware enables not only responding to individual malware but also understanding the relation to the known malware, thereby allowing intelligent response.
The rest of this paper is organized as follows. Section 2 introduces the preceding studies of analysis of similarity to existing malware; Section 3 presents the malware group classification technology proposed in this paper; Section 4 presents the system development and result of testing with existing malware; and Section 5 summarizes the significance of test result and future work.
2. Related Work
There have been many studies on analyzing the similarity of malware, and they can be mainly divided into static analysis and dynamic analysis. Kephar and Arnolod conducted the automated malicious codes signatures [1]. Hu and Dullien conducted similarity analysis based on the flow graph of calls from malicious codes as part of static analysis [2, 3]. Alazab et al. statically analyzed malware to extract the list of APIs that can be called and measured the similarities based on them [4]. Although these studies showed some detection result, the effectiveness was limited since most malicious codes were packed. Even when the malicious codes are unpacked if the packer is known, there is difficulty in coping with the custom packing set by an attacker [5]. Manuel et al. classified the types of dynamic analyses of malware into analysis of API and system calls, analysis of correlation of called parameters, information flow tracking, and so forth [6]. Bayer et al. tabulated the malicious behaviors generated by more than 90,000 malicious codes to build the grounds for analyzing the behaviors that can be generated by most malware programs [7]. Liu et al. converted the API sequence into regular expressions and detected a similarity between malicious codes when there is a similar pattern among the regular expressions [8]. Inoue et al. analyzed the unit function of the called API sequence and malicious behaviors in advance and determined the maliciousness based on the generation of the same pattern [9]. Although these studies have the strengths of enabling analysis based on the identification of elemental malicious behaviors of malicious codes, there is a high possibility of false detection in identifying elemental malicious behavior, including a limitation of identifying new malicious codes other than the already known types. Pratiksha and Deepti identified the APIs frequently called by malicious codes and their frequencies in advance and analyzed the maliciousness of a code based on the calls [10]; another study compared the similarity with the edit-distance of called sequences. In the case of using representative APIs and frequencies, there are difficulties in selecting the APIs since even normal codes also use the API often used by malicious codes; simply comparing frequencies can generate significant false detections. Moreover, comparing similarities using edit-distance may be meaningful as an indication of similarity of total malicious code API sequences but is limited in measuring accurately if the new malicious codes include additional malicious functions. Moreover, these studies only discuss the similarities between two malicious codes but do not include the automatic identification of malicious code groups. Tian et al. extracted the API functions and parameters of malicious codes and normal programs and analyzed the code association using data mining techniques such as support vector machine, random forest, and decision tree [11]. Santos et al. generated the sequences by extracting the opcodes and assigning the weight factors instead of using APIs and then performed data mining analysis such as K-Nearest neighbors and Bayesian network [12]. Rieck conducted the malicious code analysis based on the machine learning [13]. Section 3 presents an efficient, reliable scheme of identifying the similarity to malicious codes.
3. Proposed Scheme
3.1. System Overview
This section describes the overall organization of the proposed scheme. First, the API behavior data generated when a malicious code is executed are collected using the Cuckoo Sandbox method [14–16]. The API data are generally represented by thousands and tens of thousands of call sequences. To simplify the process, they are converted into normalized codes, with the API sequences of the converted API data extracted in n-gram. Similarity to a malicious code is calculated with the generation sequence of API sequences. All malicious codes having such similarities between two malicious codes are compared in N : N and then grouped based on the comparison. Such method has several problems, however. All the malicious codes classified in the same group do not have the same dependability, and the dependability level of the group is lowered considerably if there is only partial similarity. Moreover, since a new code must be compared with all the malicious codes, more than 10 billion comparisons are needed even when only 10,000 codes are inputted each day with existing 1 million malicious codes. The system is simply impractical. This study proposes the technology of identifying the associated group of the input code through the preliminary comparison with the representative malicious code automatically selected from each group and fully compared with the malicious codes in the group to increase efficiency of operation. After a code is classified into a group, the group is regularly filtered according to the local clustering coefficient value of each malicious code. Figure 1 shows the system overview.

System overview.
3.2. Effective Group Classification
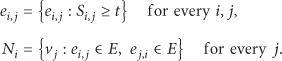
The similarity of two malicious codes is determined based on the similarity of API calls generated when a malicious code is executed (Figure 5). The formula for similarity comparison of API sequences is deduced through n-gram-based analysis. The cosine similarity method used for the comparison of similarity between two vectors is used for the similarity formula. If the similarity value is above a specific threshold, two malicious codes are judged to be similar to each other and such can be expressed as follows. A graph

3.3. Selection and Management of Group Representative Malware
The previous section presented the scheme for detecting the variations of malware and group classification as well as the filtering technique to improve dependability. Although this method can help secure the dependability of classification of malicious codes, a performance problem arises when applying it to the actual operation system. Assuming that there are 1 million malicious codes registered in the system and that 10,000 codes are analyzed each day, 10 billion similarity comparisons on average are needed. To solve such problem, a scheme for identifying the malicious code that represents the malware group and subsequently classifying the group based on it and periodically managing it is presented.
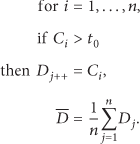
When a new malicious code is inputted, it is compared with the malicious codes that represent the groups, and the most similar group is selected. It is then compared with all malicious codes in the group to calculate the local clustering coefficient. The group with representative malicious codes having the highest average similarity value is selected, and the similarity value must be equal to or larger than the threshold value. A new group is created if there is no group with high similarity. The previous section described the detection of variation of malicious code, guaranteeing the dependability of group classification and selection and management of representative malicious code of each group considering operating performance. This section analyzes the level of performance improvement. If a malicious codes are inputted daily into an environment where N malicious codes are classified into n groups and the rate of malicious codes of each group is s, the performance can be predicted as described below. Since the number of malicious codes per group is

4. Experimental Result
This sector analyzes the dependability improvement based on the proposed method of classifying malicious code groups. Using 3,000 malicious codes collected from a commercial environment, the performance improvement levels were compared through the detection and group classification of variations to malicious code and filtering of local clustering coefficient. Table 1 shows the average clustering coefficients of the top 10 malicious code groups with and without filtering and the standard deviations of average clustering coefficients indicating the accuracy of malicious code group classification.
Dependability analysis between no filtering and proposed model.

The analysis result is the case of filtering threshold of 0.8. The result shows that the dependability of group classification increased in most of the top 10 groups. Although the analysis result differs according to the group, the 1620 group and 1640 group showed improvement of group classification dependency with 11.6% and 20.8%, respectively. Moreover, when filtering was applied to group classification, the standard deviation of dispersion of nodes in the groups greatly improved from 0.089 to 0.029. The fact that standard deviation improved more greatly than the dependability of group classification is attributed to the filtering of some improper nodes, although most nodes are classified properly. Although the dependability of group classification increases as the threshold increases, the number of nodes in the group decreases. If the threshold decreases, the group classification dependability decreases, but the number of nodes in the group increases. This sector analyzes the correlation between the threshold, group dependability, and number of nodes. Figure 2 shows the improvement of group dependability of the proposed model according to the local clustering coefficient threshold and the change of number of nodes according to the group dependability improvement. Group dependability was 92.8% without filtering, increasing to 96.7% according to the threshold when filtering was applied. Dependability was 97.2% or higher, which was 2-sigma level if the threshold was set to 0.93, and 99.5% or higher, which was 3-sigma level if the threshold was set to 0.97.

Clustering coefficient analysis between no filtering and proposed model.
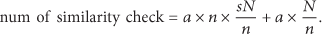
Since the improvement of dependability of group classification corresponds to filtering incorrectly classified nodes, the distribution of local clustering coefficients of the nodes changes. Figure 3 confirms that the standard deviation greatly improved from 0.089 when no filtering was applied to 0.022 according to the change of threshold. The fact that the standard deviation of nodes was low and the group dependability level was high means that improper nodes were effectively classified.
Standard deviation analysis between no filtering and proposed model.
The setting of threshold is ultimately related to the use of group classification result. Higher threshold must be set if only the variant relation data closely related to a specific malicious code are needed. Lower threshold is more efficient in the case of analyzing the characteristics or trend of production of variation to malicious code. If the threshold is set high, the number of nodes in group classification decreases. Figure 4 shows that dependability or number of nodes did not change up to the threshold of 0.5 but decreased by 4.84% at the threshold of 0.7, by 9.2% at the threshold of 0.8, and by 13.75% at the threshold of 0.9. Figure 4 illustrates the change of group dependability and number of nodes according to the threshold setting. The threshold can be set according to the purpose using the graph.

Dependability and threshold analysis according to the filtering level.

Group classification visualization.
The administrator can operate the proposed technology easily with user-friendly GUI. First, the user can check the group classification status of all registered malicious codes. Each circle means the malicious code group and the number of its circles means the malicious code size. When the user selects a specific group, we can check the detailed information such as malicious code list, similarity values, and coefficient values. In addition, we can check the similarity relation map between malware programs in the group. Each node means the malicious code and edge means the malware variants. If two malicious codes are not variants, the edge between two nodes is not generated.
Moreover, the vaccine detection name according to the same malware group is provided at the same time so that the user can check the dependability of group classification (Figure 6).

Antivirus detection name according to the same malware group.
5. Conclusions
Various cyber incidents are occurring continuously, and damage from them not only affects cyber space but also extends to daily living including home appliances and infrastructures in the IoT environment wherein all devices are connected to IT. Since most attacks use malware, it is important to analyze the malicious code and respond to it proactively. This study focused on the area needed to use the existing technology of detecting the malware variation and classifying groups in an actual operating environment instead of a lab environment. As a result, the filtering technology to improve the factor that lowers group classification dependability in existing algorithms and the automatic representative malicious code selection and management technique to operate effectively without affecting performance in an environment wherein a large volume of malicious codes are inputted are proposed. The verification with more than 3,000 malicious codes showed that the proposed model greatly improved the dependability and processed volume over existing methods. The proposed malware variation detection and group classification technology can automatically identify key malicious codes and automatically filter malicious codes such as downloader and dropper, which are not highly destructive. Variants of malicious code are useful in understanding the trend and change of the same attacker. There can be several enhancements. Since the raw data for analyzing the variation of malicious code are extracted through Sandbox, new technologies must be continuously developed in step with the attack trend since more intelligent malicious codes circumventing the virtual environment have been continuously appearing. Moreover, the problem of failure to yield an accurate result, for example, too small API sequence or false detection since the size of common library is too large, must also be resolved. The future plan includes additional technology development to improve the operating effectiveness and problem while operating the system in an actual operating environment.
Footnotes
Competing Interests
The authors declare that there is no conflict of interests regarding the publication of this paper.
Acknowledgments
This work was supported by Institute for Information & Communications Technology Promotion (IITP) Grant funded by the Korea government (MSIP) (no. B0101-16-0300, The Development of Cyber Blackbox and Integrated Security Analysis Technology for Proactive and Reactive Cyber Incident Response) and by the National Research Foundation of Korea (NRF) Grant funded by the Korea government (MSIP) (no. NRF-2014R1A2A1A11050818).