
Abstract
Wi-Fi based indoor localization system has attracted considerable attention due to the growing need for location based service (LBS) and the rapid development of mobile phones. However, most existing Wi-Fi based indoor positioning systems suffer from the low accuracy due to the dynamic variation of indoor environment and the time delay caused by the time consumption to provide the position. In this paper, we propose an indoor localization system using the affinity propagation (AP) clustering algorithm and the particle swarm optimization based artificial neural network (PSO-ANN). The clustering technique is adopted to reduce the maximum location error and enhance the prediction performance of PSO-ANN model. And the strong learning ability of PSO-ANN model enables the proposed system to adapt to the complicated indoor environment. Meanwhile, the fast learning and prediction speed of the PSO-ANN would greatly reduce the time consumption. Thus, with the combined strategy, we can reduce the positioning error and shorten the prediction time. We implement the proposed system on a mobile phone and the positioning results show that our algorithm can provide a higher localization accuracy and significantly improves the prediction speed.
1. Introduction
Indoor localization is a critical tool for fast developing location based service (LBS) [1]. An indoor localization system helps to obtain the positions of people, animals, and equipment, and these location information pieces play an important role in navigation, security, and healthcare industries [2, 3]. Although, in open areas, Global Positioning System (GPS) can provide precise positioning, it does not perform well in indoor environment due to the lack of GPS signals. Therefore, different kinds of indoor positioning systems have been developed for personal and commercial needs [4–7]. Among all of the indoor location methods, Wi-Fi based indoor location systems have drawn much attention because Wi-Fi has become a standard facility in most buildings, such as airports, commercial centers, and office buildings. And the smartphones, as a common kind of personal belongings, are now all able to receive the Wi-Fi signals. As such, Wi-Fi location is a widespread, low-cost, and easy obtained indoor location method [8–10].
The model-based method and fingerprinting-based method are two mainly used techniques in Wi-Fi indoor localization. The model-based positioning strategy aims to build an accurate model between the propagation distance of the signal and the received signal strengths (RSSs) value. However, it suffers from a low location precision due to the complexity of radio channels, such as reflection, shadowing, multipath, and device variation [11]. Thus, instead of using an inaccurate propagation model, many researchers turn to the fingerprinting-based technique in Wi-Fi indoor localization. The main idea of the fingerprinting-based technique is to compare the online measured RSS value with the offline premeasured RSS database. But the existing fingerprinting algorithms suffer from two major problems. One is that it requires a long time to match the RSS value with the whole database, especially when the database is very large [12]. The other one is that the fingerprinting algorithms cannot deal with the nonlinear RSS variance, which may lead to a low precision [9].
In this paper, we use the artificial neural network (ANN) trained by the particle swarm optimization (PSO) algorithm to solve the above localization problem. The traditional backpropagation (BP) algorithm is wildly used in ANN training algorithm. The main idea of BP algorithm comprises a feed forward propagation of signals and a backpropagation of errors. However, it costs much time for training and is easily trapped in local minima. On the contrary, PSO is a powerful population-based stochastic approach to solve the global optimization problems. PSO generates a swarm of particles; each particle contains a set of network parameters. By simulating the group behavior of animals, both the swarm and the individual particle are able to evolve, and then the optimal solution is obtained to enhance the ANN performance. Therefore, the PSO-ANN can be used to build the fingerprint database. The fast training and prediction speed of the PSO-ANN would greatly reduce the time cost both in the offline training phase and in the online matching phase. Before training, we use the principal component analysis (PCA) to reduce the dimension of RSS values and an unsupervised affinity propagation (AP) algorithm to cluster RSS values. So the RSS values in each cluster share the similar character, and training the ANN for each cluster helps make the system achieve a higher localization accuracy.
The proposed positioning system was implemented on a mobile phone to evaluate the performance. The experiment was conducted in a general office building with no special constraints, so the experimental results are more typical and reliable.
The rest of the paper is organized as follows. Section 2 reviews some related works in indoor localization. Section 3 provides details of the proposed algorithm. Section 4 describes the experiments and the results to verify the proposed approach. Then we conclude our paper in Section 5.
2. Related Works
Model-based approach and fingerprinting-based approach are two main methods used in Wi-Fi indoor localization. Model-based approach obtains the range measurements between transmitter and receiver and uses the geometric constraints to estimate the unknown position [13]. Different kinds of range measurement approaches are taken into consideration, including the time of arrival (ToA) [14], the time difference of arrival (TDoA) [15], and the RSS. Among all, RSS is the most popular one because it can be easily obtained by most mobile devices. The prevalent log-distance path loss model builds a function between the propagation distance and the RSS value [16, 17]. However, due to the complicated indoor propagation environment, it is hard to build a precise propagation model. Thus, the distance estimations often suffer from a poor accuracy.
A large number of existing indoor localization systems adopt fingerprinting as the position estimation method [12, 18–20]. The fingerprinting-based method builds a fingerprint database by collecting RSS samples at some reference points (RPs). Then, the location of the user is estimated by matching the measured fingerprint with the database. Lots of researches on fingerprinting-based technic have been proposed during the past two decades. To reduce the calibration effort while maintaining the location accuracy during the database collecting phase, some unlabeled data, which can be easily obtained by measuring user's casual movement traces, are used [21, 22]. Some propose to enhance the location accuracy by using motion constraints [23, 24]. With the combination of inertial sensors and pedestrian dead reckoning, researchers find a way to improve the efficiency of generating radio map and the positioning accuracy for indoor Wi-Fi localization system [25–27].
However, these approaches either require an extra hardware or have the weakness in dealing with the dynamic indoor environment changes. In this paper, our proposed PSO-ANN model is conducted in a continuous space, and the PSO algorithm has the strong ability to solve the complicated indoor environment problems.
3. Location Methods
3.1. PSO-ANN Based Indoor Location System
A typical fingerprinting-based indoor localization system contains two localization phases: the offline phase and the online phase. In the offline phase, the RSS values from the RPs are collected and stored in a database called fingerprint database. And, in the online phase, the RSS values collected by a mobile device are compared with the fingerprint database, and the location can be obtained by some comparison algorithms.
However, in order to acquire an acceptable positioning accuracy, we need to increase the density of RPs, and the size of the fingerprint database would be quite large. As a result, comparing the received RSS value with all fingerprints will be very time consuming. This also causes a time delay in real-time positioning tasks. Besides, the complicated indoor signal propagation environment, caused by signal reflection, shadowing, and multipath, makes the precise localization more difficult. And most existing systems cannot deal with these cases. To improve the efficiency and accuracy of localization, we utilize a new indoor positioning method.
As shown in Figure 1, the proposed PSO-ANN based solution consists of two phases: an offline phase and an online phase. During the offline phase, the raw RSS data are collected at some RPs in advance. Then, in order to reduce the size of the search space, the PCA algorithm is performed to reduce the dimension of RSS fingerprints. After being transformed with PCA, the RSS fingerprints are divided into some clusters by the unsupervised AP clustering algorithm. The clustering algorithm achieves two aims: (i) by dividing all RPs into some clusters, it reduces the computational complexity during the ANN training phase; (ii) the RSS data in the same cluster share the similar character, which helps enhance the performance of ANN. After clustering, each cluster trains an ANN model with the PSO algorithm. During the online phase, after PCA transformation, the RSS value collected by a mobile device needs to be compared with the exemplars of each cluster to identify to which cluster it belongs. And the location coordinate can be obtained by using the corresponding ANN model.
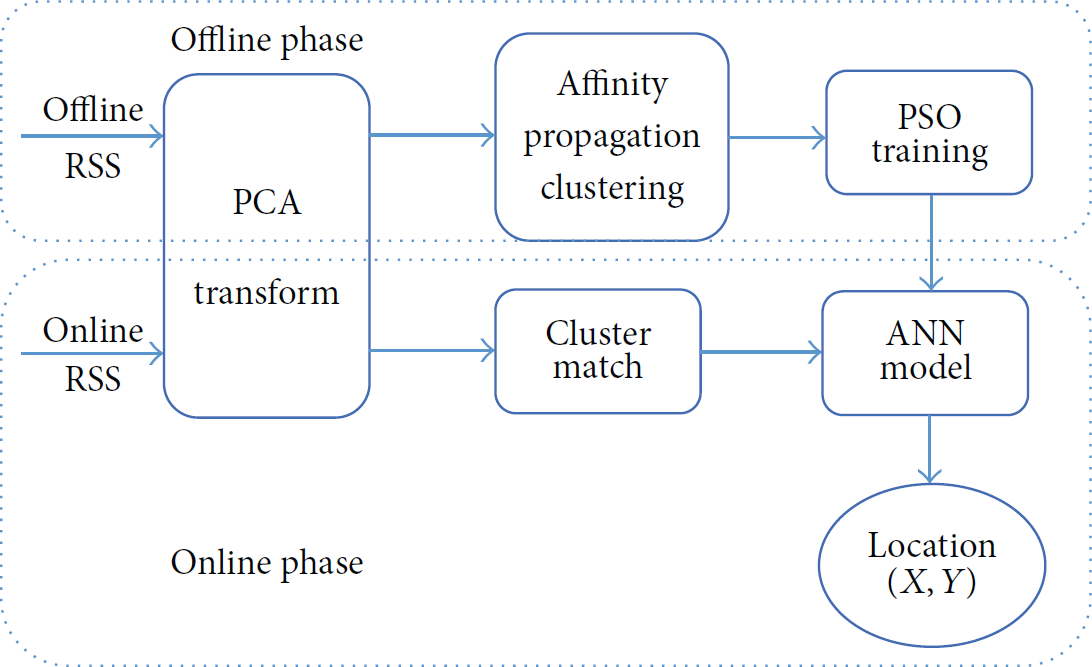
Block diagram of the proposed particle swarm optimization (PSO) based indoor location system.
3.2. Data Conditioning Process
During the offline phase, the RSS data is collected at some known RPs. Suppose all

The principal component analysis (PCA) is utilized to reduce the dimension of fingerprints and remove the measurement noise in our work. PCA uses orthogonal transformation to remove redundant information and decrease the number of variables. During the positioning process, both the offline fingerprints and the online RSS data are transformed with PCA.
PCA creates a set of linearly uncorrelated variables


3.3. Affinity Propagation Clustering
The main difficulty in Wi-Fi based indoor positioning is dealing with the signal reflection and fading effects due to the wall and item-placement in indoor environment. To reduce the signal fluctuation caused by the environment effects, the AP algorithm is employed. AP divides the RPs into some clutters according to the RSS value collected from each RP. The clustering strategy makes the RPs in the same cluster experience the similar signal transmission environment and has the similar RSS values. Then, a unique ANN model will be trained for each cluster during the next step. Thus, compared with all RPs sharing the same ANN model, creating an appropriate ANN model for each cluster helps make the position prediction more accurate.
Unlike the traditional K-means clustering algorithms, AP algorithm does not require the initial information on the exemplars [28]. All RPs have the potential to become the exemplar. The matrix that quantifies the similarity between two RPs is defined as

The self-similarity value

The main part of AP algorithm is conducted by iteratively updating two messages, the responsibility matrix R and the availability matrix A, between each pair of RPs. Both matrices are initialized to zero and then updated as follows:


These two messages are passing between each pair of RPs until the exemplars stay fixed for some iterations. During the online phase, the obtained RSS value is first compared with all exemplars to identify which cluster it belongs to, and then the ANN of this cluster is used to localize the position. Consequently, the RPs are clustered by the AP algorithm to enhance the prediction accuracy of ANN model.
3.4. PSO-ANN Implementation on Indoor Location
After the RPs are clustered by the AP algorithm, we build a model, as a replacement of the traditional fingerprint map, to evaluate the relations between RSS value and position. ANN is a statistical learning model which can be used to approximate complicated nonlinear functions. Prior to making the prediction, the ANN model needs to be trained first. Different training algorithms can be used in ANN and they will lead to different prediction performance [29].
PSO is a powerful population-based stochastic approach to solve the nonlinear global optimization problems [30]. The particle swarm simulates the cooperative behavior of a group of social animals, like fish and birds swarm. A group of random particles were initialized and iterated to find the optimal solution. In each iteration, the particle keeps tracking the best position of itself, known as the personal best or “

As we mentioned earlier, BP is a local minima search strategy and might lead to unsatisfied training results of the ANN model. In contrast, the PSO helps solve the global optimization problem. PSO is used to determine the weight and bias value of the ANN. Each particle contains all the parameters needed in an ANN model

The RSS training data, described in Section 3.2, are used to train the particles in the following step.
Step 1.
Set the particle group size M, the max iteration number n, and the expected error e. Give each particle a random initial position and a random initial velocity.
Step 2.
For all RSS training sets [
Step 3.
Update the
Step 4.
Update the particle position and velocity according to (9).
Step 5.
Repeat Steps 3 and 4 until the distance between
4. Experiments and Analysis
4.1. System Overview
This section provides details of the experiments to evaluate the performance of the proposed PSO-ANN based indoor location system. Our experiments were carried out on the third floor of the building of the School of Automation, Beijing Institute of Technology. Specifically, the experiment area is about 45 m ∗ 25 m including hallway and eight office rooms, as shown in Figure 2. Six D-Link 211 Wi-Fi routers were utilized as the regular equipment for our experiments. And another 10 Wi-Fi signals could be received from some unknown WRs during the experiments, which means we did not know their exact location.
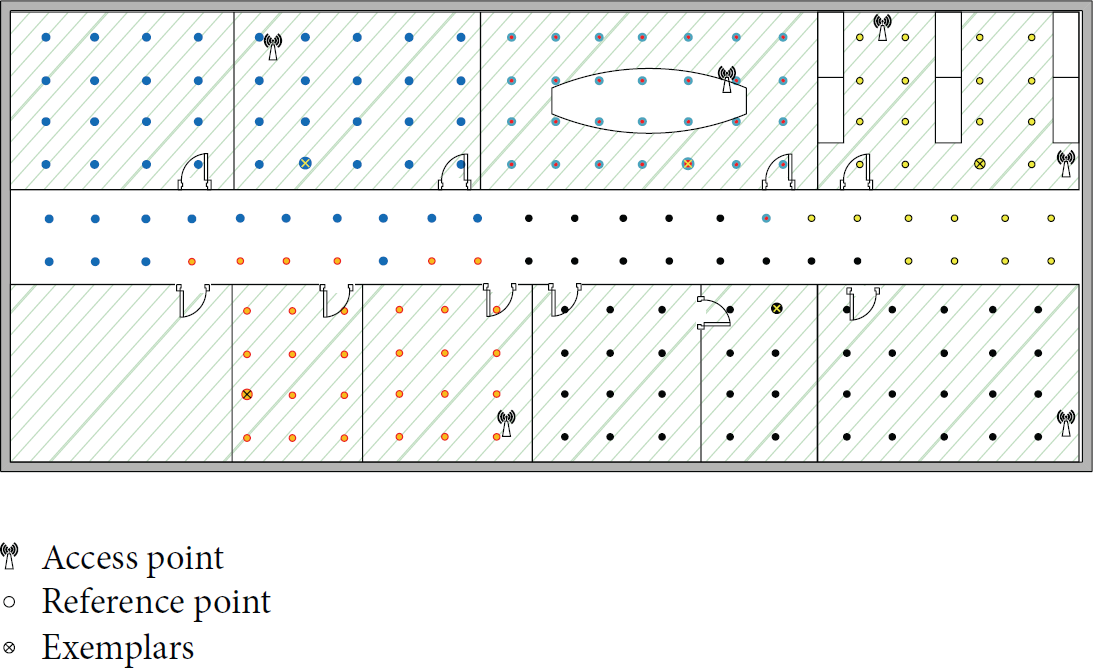
Position of the offline reference points (RPs), Wi-Fi wireless routers (WRs) in the test area. Each dot represents one RP, and RPs in different clusters are indicated in different colors. The exemplar for each cluster is indicated by a cross inside the dot.
The positioning software is developed in Java and installed on a Samsung 9006 mobile phone. The software continuously scans the received signal and records the ID, mac address, and RSS value of each WR. The RSS value ranges from −20 dBm to −90 dBm. The scan rate of this mobile device is 2 times per second and the human moving speed is about 1-2 meters per second. So the scan rate can meet the general requirements in indoor location.
During the offline phase, a total of 188 RPs were selected, of which the interval was 2 m. The positions of the offline RPs are shown as the dots in Figure 2. Fifty Wi-Fi fingerprints were collected at each RP, so we got 9400 fingerprints in total. During the online phase, another 200 Wi-Fi RSS test data pieces were collected from 100 test points, which were different from the RPs. In order to take the dynamic changes of the signal transmission environment into consideration, we collected the test data in two different days.
The mean localization error e and the cumulative distribution of localization error

4.2. PCA Reduction Performance
The PCA algorithm is used to reduce the dimensions of the input vectors. During the experiment, the training data was collected at 188 different RPs from 16 WRs. Six of the WRs were randomly placed at the given location in advance, and the other 10 WRs were from the unknown position. So the received RSS value

Combined variance with different number of principal components (PCs).
In general, we choose the first several PCs to make at least 95% of the variance preserved. In our work, the first 9 PCs were used and the combined variance reached 96.5%.
Figure 4 shows the mean reconstruction error with different number of PCs. The reconstruction error identifies the similarity between the origin data and the PCA reconstruction data.

Mean reconstruction error with different number of PCs.
For the training set

The mean reconstruction error is defined as the sum of the Euclidean distance between

From Figure 4 we can see that the reconstruction error M decreases rapidly from 1 to 8 PCs and stays relatively stable after the PCs number reaches 8.
The result above has shown the reasonability that the first 9 PCs were chosen to replace
4.3. AP Clustering Results
In order to reduce the diversity in RSS training set and improve the location efficiency, the AP algorithm was adopted to cluster all the 188 RPs according to their RSS values. The main task of the AP algorithm here is to divide the RPs into some parts, and in each part the RPs share the similar wireless transmission environment.
As shown in functions (4) and (5), the similarity value
In the clustering results, as was shown in Figure 2, the RPs were divided into 5 clusters, each indicated by different colors. The dot with a cross inside it represents the exemplar for each cluster. As observed in Figure 2, most RPs in the same room were divided into the same cluster. That is because the wall is a major factor affecting the propagation of the WR signals. However, the RPs in the hallway are hard to cluster because of the strong effect of the noise and multipath effect.
The clustering process is conducted after the fingerprints were transformed by PCA during the offline phase. And, during the online phase, the RSS values we collected were used to compare with the exemplars. Several criterions used to identify to which cluster the RSS value belonged were discussed in [33]. And different cluster matching schemes did not affect the location prediction significantly in our experiments. So we used the negative Euclidean distances between the given RSS value and the exemplar to identify the cluster to which it belonged.
4.4. Training the PSO-ANN
4.4.1. Selection of the ANN Model
The RPs were classified into 5 clusters by AP algorithm. After that, we trained the ANN for each cluster. The performance of the PSO-ANN model is affected by the selection of the ANN model parameters. So some analyses about the choice of model parameters were performed.
In our experiments, the network with two hidden layers was used as the ANN model because more hidden layers would greatly increase the training time while two hidden layers could satisfy both the training performance and the training efficiency. Both hidden layers had the same number of hidden nodes. The activation function of all neurons was the hyperbolic tangent. As shown in Figure 5, all ANNs shared the same structure, which had 9 inputs, each representing a PC of the RSS value, and 2 outputs, representing the geography coordinate of the current position.

The structure of the artificial neural network (ANN).
4.4.2. Selection of the Number of Hidden Nodes
After the sizes of hidden layers and the activation function were determined, another important factor that affects the performance of the ANN is the number of hidden nodes. Figure 6 shows the training performance of different number of hidden nodes. The mean location error e is denoted as the criterion to judge the performance of different number of hidden nodes. e is defined as the mean of location errors in 10 repeated tests, because the same ANN structure and the same training set might draw a different result.
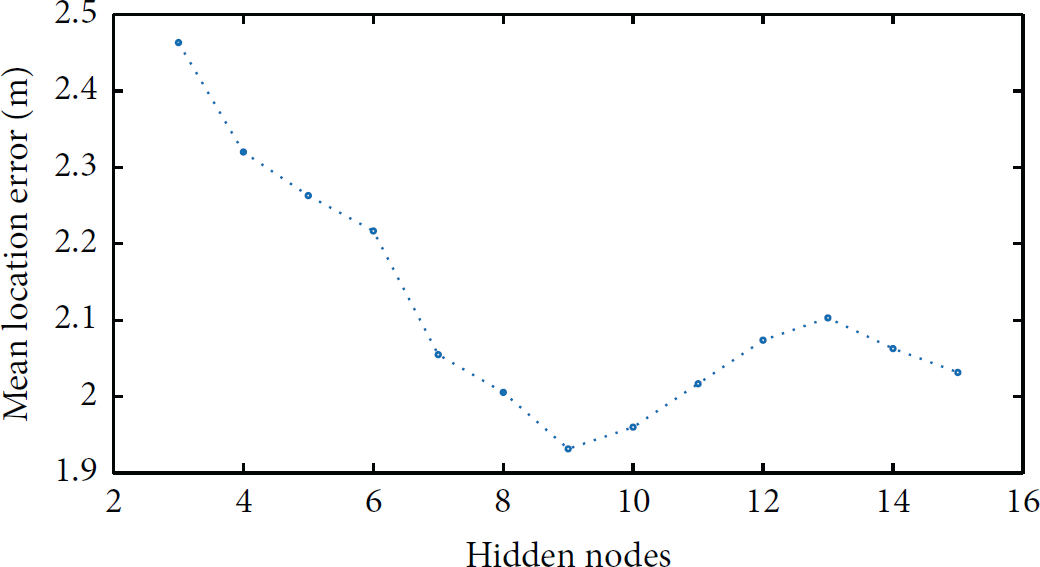
The mean location error with different number of hidden nodes.
As indicated in Figure 6, 9 hidden nodes led to a best location accuracy of which the mean location error was 1.93 m. More hidden nodes would not continuously reduce the mean location error. So the ANN model we used had two hidden layers, each containing 9 hidden nodes.
4.4.3. Selection of the Number of Particles
The PSO algorithm was utilized to determine the weights and threshold of each hidden node. And the size of the particle swarm might affect the optimization results. A larger number of particles would perform better in finding the global optimization, but it would also lead to a longer training time. A series of tests were conducted to find the appropriate number of particles.
Due to the stochastic motion of particles, there exists a little difference between each training phase. To obtain a better training performance, the training phase was repeated 5 times, and the one with least training error was chosen as the prediction model. Figure 7 shows the mean location error with different number of particles. The mean location error decreased fast as the size of the swarm increased to 600. After that, keeping increasing the particle number did little help in improving the network performance.
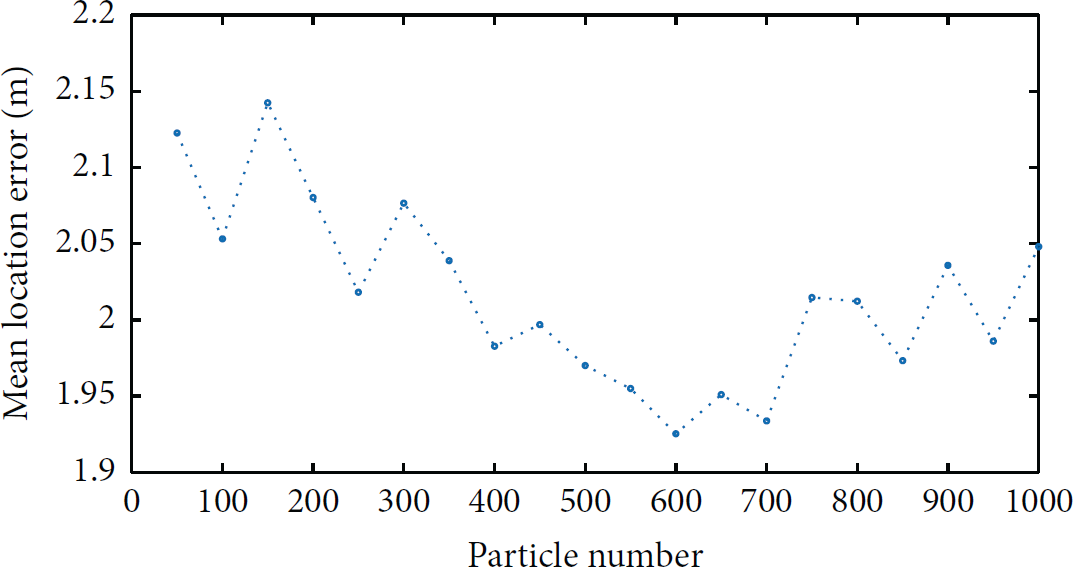
Mean location error with different number of particles.
On the other hand, as the particle number increased, the training time also increased rapidly. Figure 8 shows the training time with different number of particles. Therefore, 600 particles were an optimum swarm size in our PSO-ANN model.

The training time consumed to train the network with different number of particles.
4.5. Comparison between the PSO-ANN and Other Methods
In order to illustrate the superiority of our proposed method, we compared the prediction performance of our PSO-ANN method with two most widely used algorithms: k-nearest neighbor (KNN) and BP-ANN algorithm.
The BP-ANN model contained 2 hidden layers and 9 hidden nodes in each layer (the same as the PSO-ANN model). The maximum iteration of BP training was set to 50000. The training set and test set were also the same as we used in PSO-ANN model, as we discussed in Section 4.1. All pieces of fingerprints were used to train the ANN, which enhanced the model adaptability to diverse signal interference. The KNN algorithm used three nearest values, and the fingerprint map was transformed with PCA.
We did two series of experiments, with and without clustering, respectively. All offline fingerprints were used to train the KNN, BP-ANN, and PSO-ANN. For the experiments without clustering, the cumulative distribution of location error of each algorithm was displayed in Figure 9. The blue line first reaches the 100% probability, which means the PSO-ANN algorithm outperforms the other two in reducing the maximum location error.
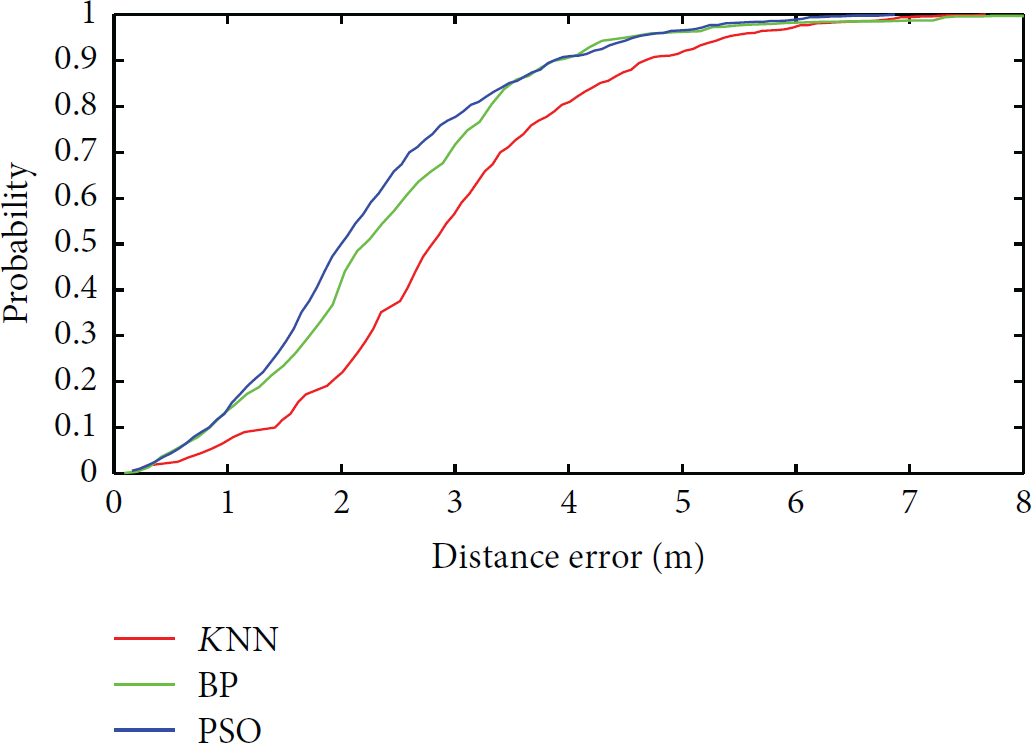
Cumulative error distribution for k-nearest neighbor (KNN), backpropagation (BP), and PSO.
With clustering, the AP clustering algorithm was applied to all the three models firstly. And the BP-ANN and PSO-ANN were trained for each cluster. Figure 10 shows the comparison of cumulative distribution of the location error. All three methods perform better with the AP cluttering. And the PSO-ANN algorithm shows the best location performance.
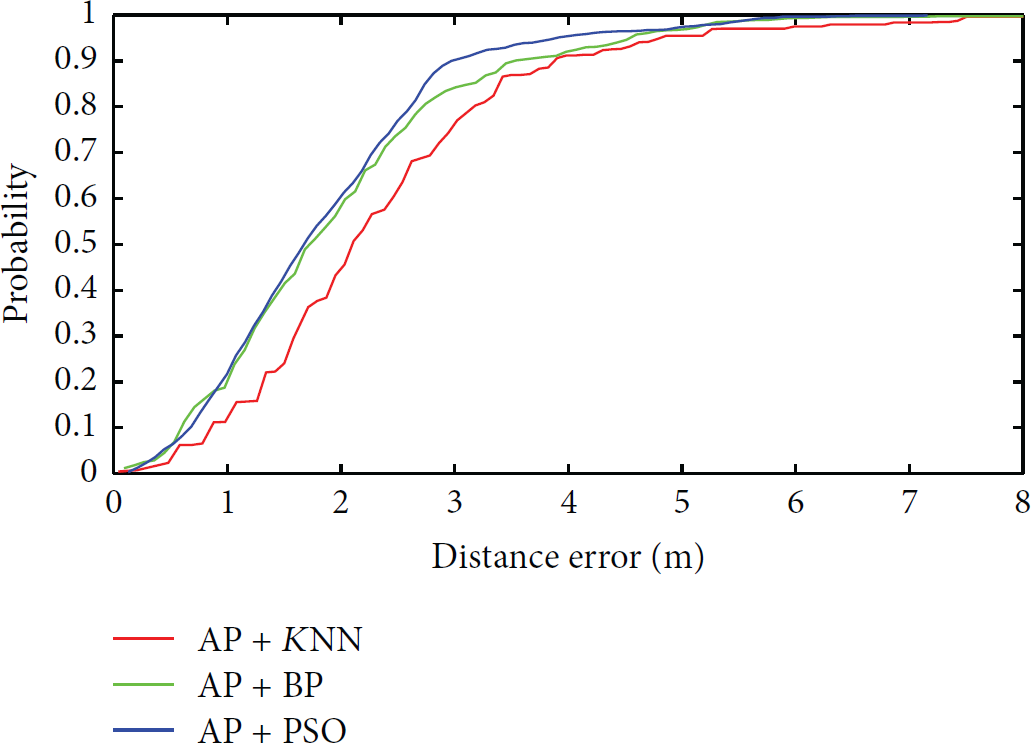
Cumulative error distribution for affinity propagation (AP) + KNN, AP + BP, and AP + PSO method.
Table 1 demonstrates the details of KNN, BP-ANN, and PSO-ANN in terms of the training and localization time, the mean location error, the 90% accuracy, and the error variance.
Comparisons between PSO and other methods.

The training time is the time consumed in training the ANN model with all 9400 fingerprints. The offline training time of the PSO algorithm is mainly related to the particle number and iteration times. In our work, the maximum iteration time of the PSO algorithm was set to 700. Thus, the maximum time required to train the ANN model can be defined. As shown in Table 1, the offline training time of PSO-ANN is less than BP-ANN, especially when AP clustering was applied. During the online phase, the prediction time is the time consumed in locating all the 200 test points. Online time consuming is an important criterion for a real-time system; the prediction time of two ANN-based methods was much less than that of the KNN algorithm. That is because the KNN algorithm needed to compare the received RSS value with the whole fingerprint map every time. However, when the RPs were clustered, the prediction time of KNN reduced by 80.5%. And the two ANN-based algorithms kept faster. This seems more important when the algorithm is running on a mobile device.
In Table 1, we can also see that the use of PSO-ANN had reduced the mean location error by 24% and 8%, respectively, compared to KNN and BP-ANN. By combining the AP technique, the location accuracy of all methods improves, while the PSO-ANN performs better than that of KNN and BP-ANN on mean location error by 21% and 15%. After clustering, the 90% accuracy of all three methods significantly decreased, because the AP clustering technique limits the maximum location error. The last column of the table shows that the PSO-ANN method has the minimum error variance, which means it performed best in dealing with the dynamic environment changes.
In summary, our proposed AP + PSO-ANN method can provide a higher localization accuracy with a faster speed than the mostly used KNN and BP-ANN algorithms.
5. Conclusions and Future Work
An indoor localization system adopting the PCA, AP clustering, and PSO-ANN algorithms was proposed in this paper. The PCA is used to reduce the dimension of the RSS data and decrease the computing load. With the AP clustering technique, we divide the location area into some subareas, each sharing the similar signal transmission environment, and it helps enhance the prediction performance of ANN models. The fast training and prediction speed of the PSO-ANN algorithm could greatly reduce the time consumption both in the offline training phase and in the online locating phase. The experiment results show that our PSO-ANN model performs much better than the traditional KNN algorithm and BP-ANN model. Besides, the simple PSO algorithm is easy to implement and adapted for different applications.
Our future work will mainly focus on fusing different kinds of indoor information, including Wi-Fi, vision sensors, inertia, and magnetism. Therefore, we can build a hybrid precise indoor location system that can meet different indoor localization needs.
Footnotes
Competing Interests
The authors declare that there is no conflict of interests regarding the publication of this paper.