
Abstract
Activities of Daily Livings (ADLs) refer to the activities that are carried out by an individual for everyday living. Recognition of ADLs is key element for building intelligent and pervasive environments. We propose a two-layer HMM to build a ADLs recognition model that can represent the mapping between low-level sensor data and high-level activity based on the binary sensor data. We used embedded sensor with appliances or object to get object used sequence data as well as object name, type, interaction time, and location. In the first layer, we use location data of object used sensor to predict the activity class and in the second layer object used sequence data to determine the exact activity. We perform comparison with other activity recognition models using three real datasets to validate the proposed model. The results show that the proposed model achieves significantly better recognition performance than other models.
1. Introduction
Activity recognition is an important task for many ubiquitous computing applications. In a home environment, activity recognition systems observe the resident's activities and can remind users to perform the missed activities or complete actions, helping them to provide some automated service. In a hospital environment, activity recognition system can remind a doctor or nurse to perform certain tests before operating. In a factory environment, it can monitor the activities of the workers and encourage them to act more safely. Activity recognition systems use several types of sensors, microphones and video cameras, RFID readers, wearable sensors, and embedded sensors with appliances (or object), to determine the state of the physical world. Based on the state of the physical world, activity recognition systems observe the behavior of persons and if necessary take actions in response. Microphones and video camera based activity recognition is complex to implement because it requires processing of multidimensional data and may violate issue of user's privacy [1–6]. It is effective to recognize primitive sequence of movements (walking, sitting, standing, etc.) but difficult to recognize ADLs (showering, grooming, preparing meals, etc.) using wearable sensors [7–9]. Home users perform an activity by interacting with appliances (or objects) within nearby location at a given time. Appliances or object used information can be gotten by attaching embedded sensor with them [10–13]. Embedded sensors are inexpensive, invisible, and nonintrusive having no impact on regular life activities. Tapia et al. have presented how simple binary sensors have solid potential for solving the ADLs recognition problem in the home [11]. Binary sensors can also be applied in human-centric problems such as health and elder care [14–16]. Van Kasteren et al. use binary sensors and motion sensors for performing ADLs recognition in a house setting [17]. However sensors based activity recognition is challenging due to the inherent noisy nature of the input [18]. In this context the temporal probabilistic reasoning and machine learning approaches are very effective. Several object use based models have been used to recognize ADLs from binary sensors such as Bayesian Networks [11], Conditional Random Field (CRF) [19], Hidden Markov Model (HMM) [17], and Hidden semi-Markov Model [17]. In [20], the authors proposed Triplet Markov Chains (TMC) to deal with nonstationary HMM by introducing an auxiliary process governing the regime switching of the hidden process.
The location of a person in an environment can provide important context information for activity recognition [21, 22]. Location based model is able to provide high-level abstraction for an activity. For example, bedroom is for sleeping, bathroom for showering, and kitchen for preparing meal. The same location can be used for different activities such as showering, brushing teeth, and toileting as bathroom activities and preparing meal, taking meals, and dishwashing as kitchen activities. So location information based modeling is not suitable for recognizing ADLs. Our aim is to build an activity recognition model that can represent the mapping between low-level sensor data and high-level activity based on the binary sensor data. We want to combine location of object used sensor with the object used data to overcome the limitation for each approach. Using embedded sensors with appliances or object we can get object used data as well as object name, type, interaction time, and location. We propose a two-layer Hidden Markov Model (HMM) for recognition of ADLs. In the first layer, we use location data of object used sensor to predict the activity class and in the second layer object used sequence data to determine the exact activity from the selected class. In our 2-layer HMM, first layer selects one activity class so second layer only considers the activities (variables) which are related to that class only. This approach reduces time complexity of this model. We evaluate and compare the activity recognition performance of the proposed models on three fully annotated real world datasets generated by Van Kasteren [23]. Based on our experiment, 2-layer HMM outperforms other activity recognition models. Using location data with object used data, this model can result in a significant increase in recognition performance.
The rest of the paper is organized as follows: Section 2 presents an overview of the data used in this study. Section 3 illustrates the details of the proposed model. Section 4 provides the experimental settings and results obtained followed by conclusion and future work in Section 5.
2. Dataset
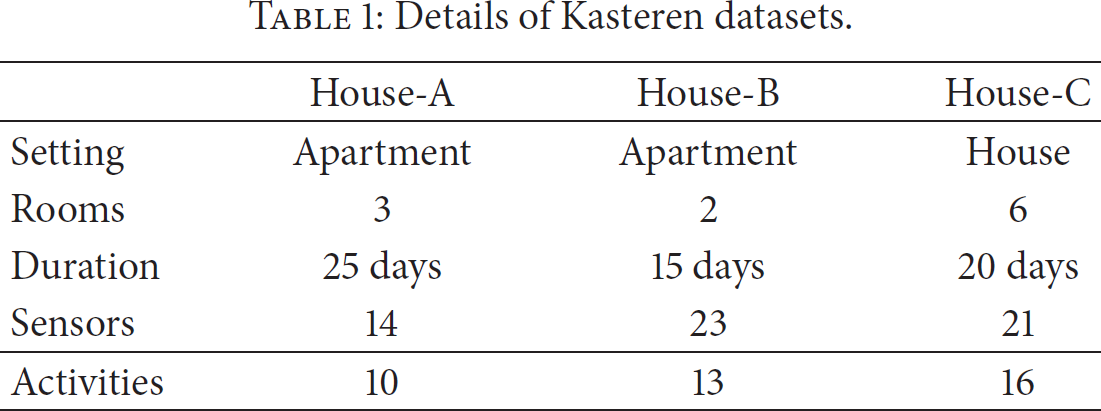
We evaluate the recognition performance of the proposed model and compare it with naïve Bayes, Conditional Random Field (CRF), and Hidden Markov Model (HMM) on three fully annotated real world datasets generated by Van Kasteren et al. Wireless Sensor Networks are used to observe the behavior of inhabitants inside the houses by collecting binary temporal data. Wireless network nodes are equipped with various kinds of sensors: reed switches to measure whether doors and cupboards are open or closed, pressure mats to measure sitting on or lying in bed, mercury contacts to detect the movement of objects, passive infrared (PIR) to detect motion in a specific area, and float sensors to measure the toilet being flushed. Wireless network node sends an event to base station when the state of the digital input changes or when the analog input crosses some predefined threshold. An overview of the datasets is presented in Table 1.
Details of Kasteren datasets.
Time series data is discretized into a set of time slices of constant length
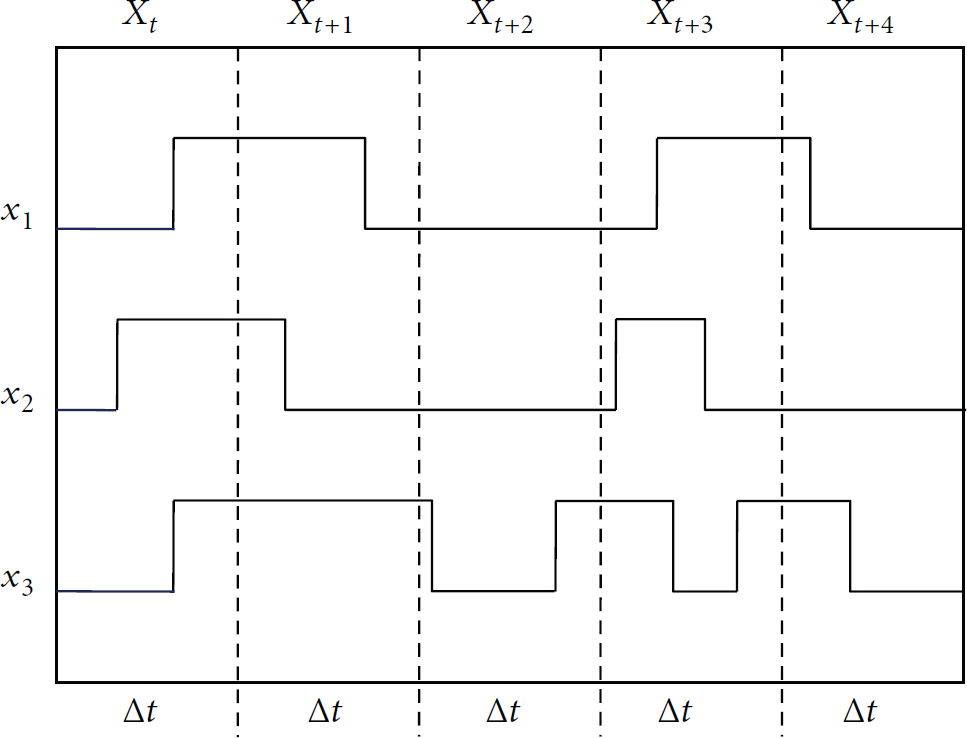
Temporal relation between sensor reading
The activities or labels considered were not the same for all datasets. In the three datasets nineteen different ADLs were included for labels: “Brushing teeth”, “Breakfast”, “Dinner”, “Drink”, “Dressing”, “Dishwashing”, “Eating”, “Leaving house”, “Lunch”, “Medication”, “Preparing Breakfast”, “Preparing Lunch”, “Preparing Dinner”, “Relax”, “Showering”, “Sleeping”, “Shaving”, “Snack”, and “Toileting”. If the activity of a time interval does not match with labeled activity, then activity of the corresponding time interval is referred to as “others”. Table 2 shows percentage (%) of instances in each activity class of the used datasets.
Instances of each activity classes in Kasteren dataset measured in percentage (%).

3. Proposed Model
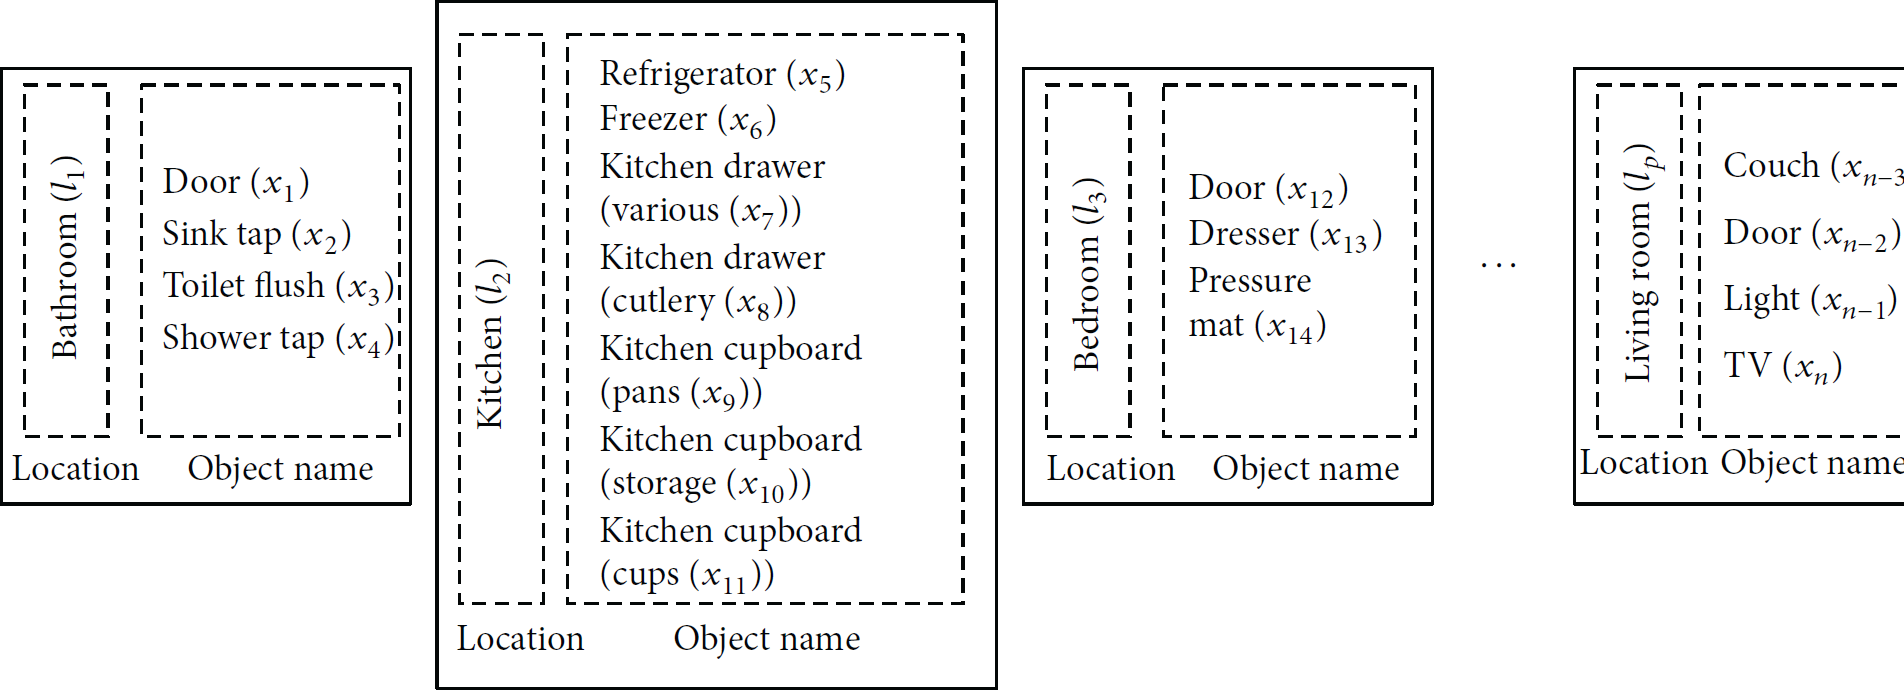
We have proposed a 2-layer HMM for recognition of ADLs. We used the locations information of the used object in the first layer and select a group which satisfied maximum joint probability. In the second layer we considered the data of used object and select one activity among the classes. Activities are grouped according to the location of objects used to perform similar activity. Figure 2 shows an example of the grouping of the activity. Sensors are also classified based on the location of the objects which are involved with each activity group. Figure 3 presents an example of classification of the location of sensor installed with different object for each activity group.

Grouping of the activities according to the location of sensor installed with different objects.
Classification of the location of sensor installed with different objects for each activity group.
We consider
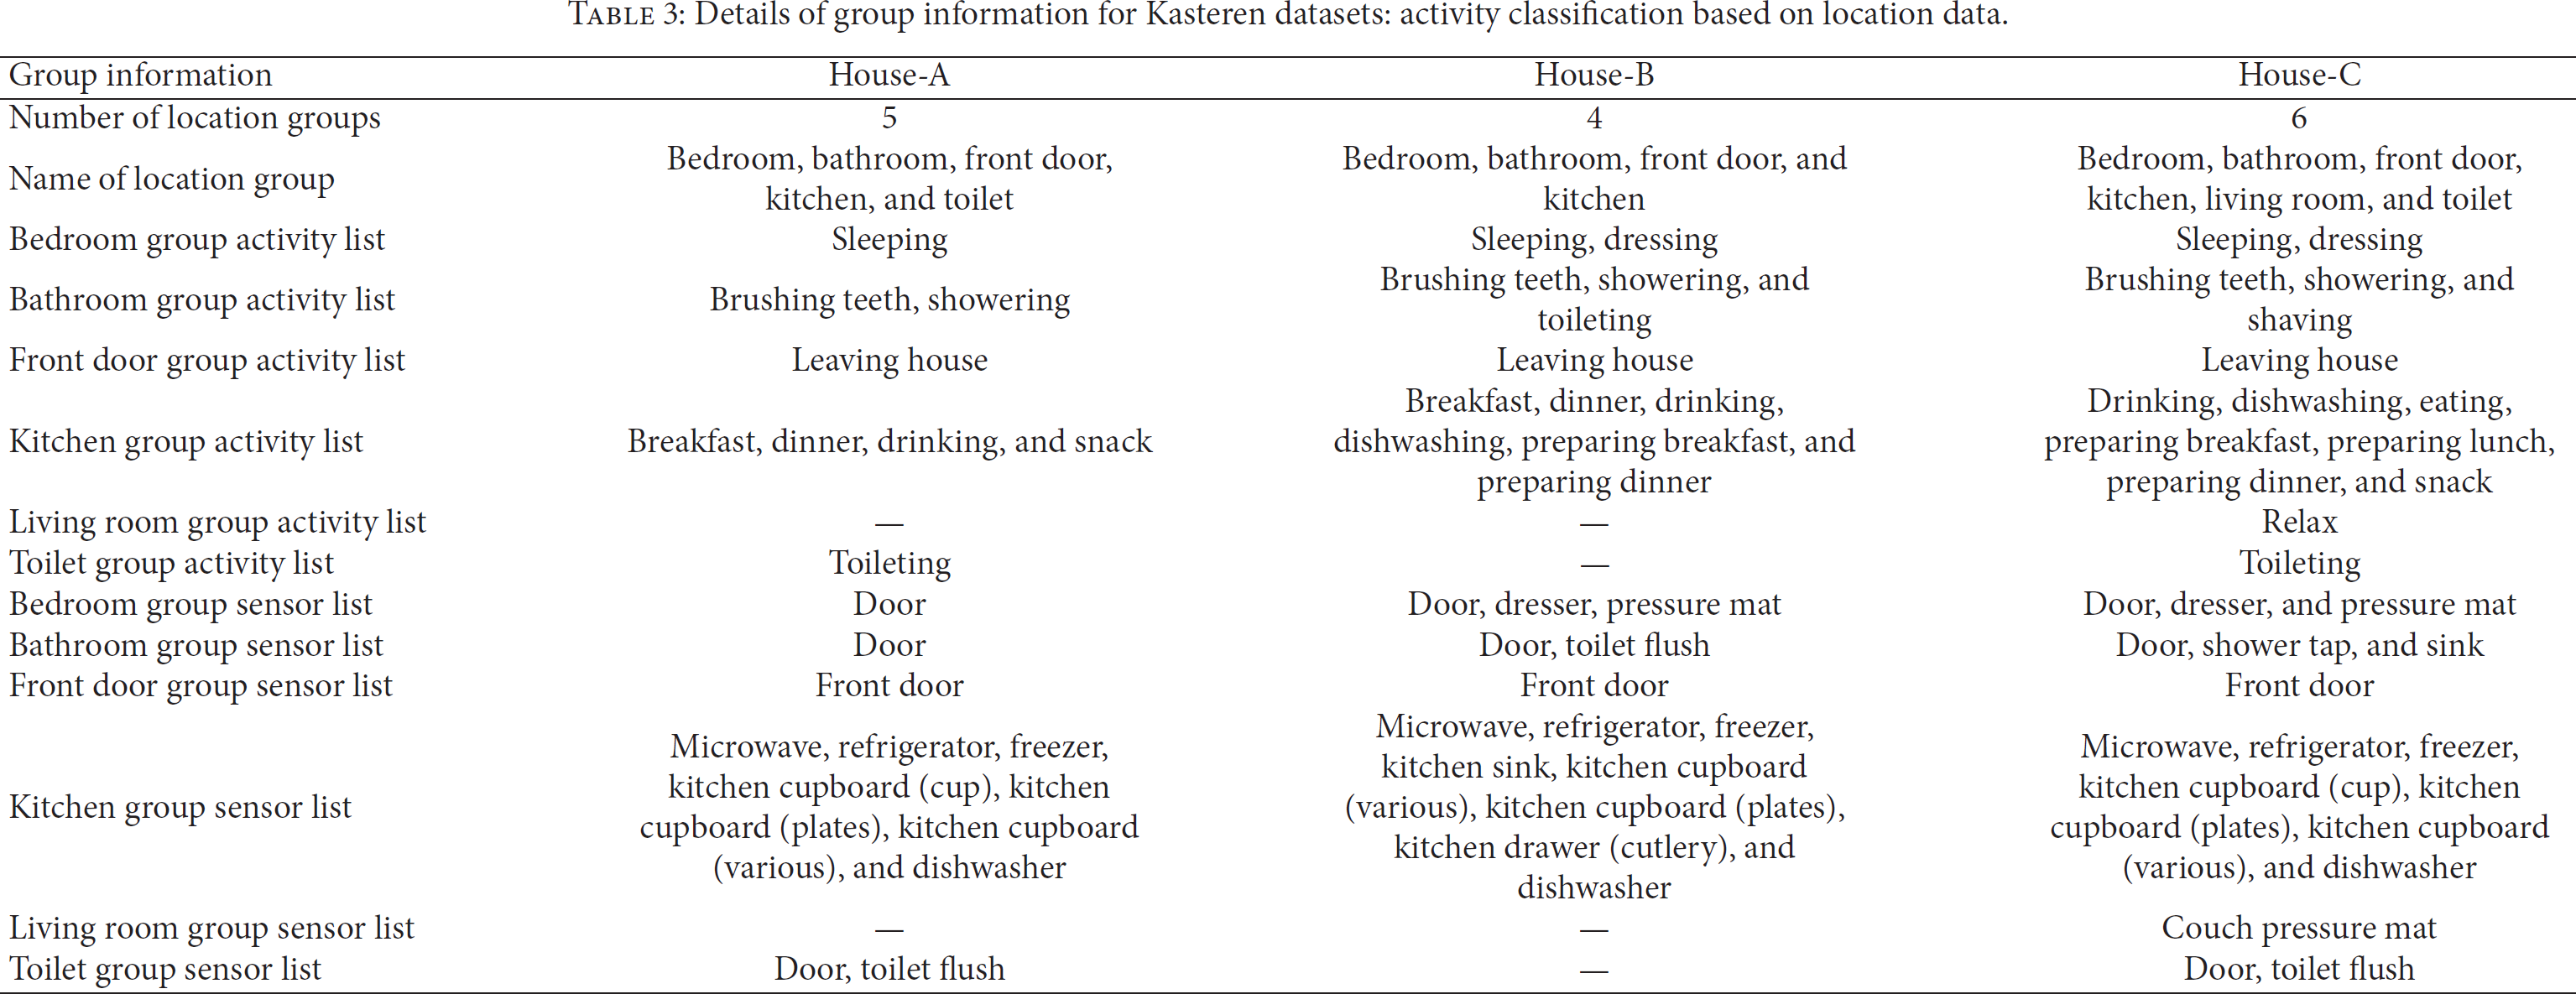
3.1. First Layer of HMM
In the first layer, the classifier uses the location information of the observed sensors to classify the group of activities. The first layer of this HMM is characterized by 


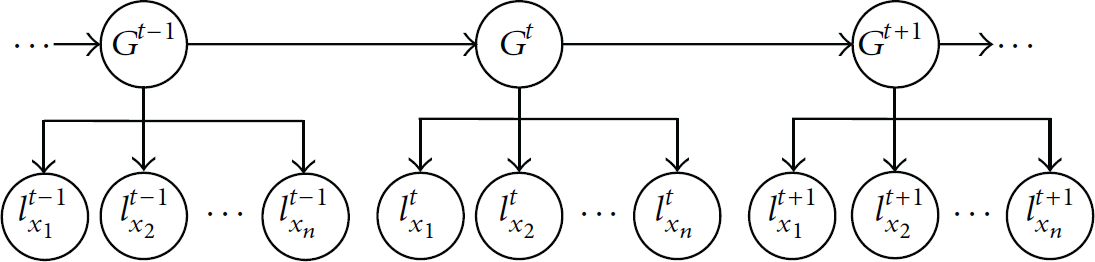
The graphical representation of the HMM used in the first layer of the activity model.
3.2. Second Layer of HMM
In the second layer, the classifier uses the sensor data to classify the individual activity. For each activity group 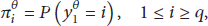


The graphical representation of the HMM used in the second layer of the activity model.
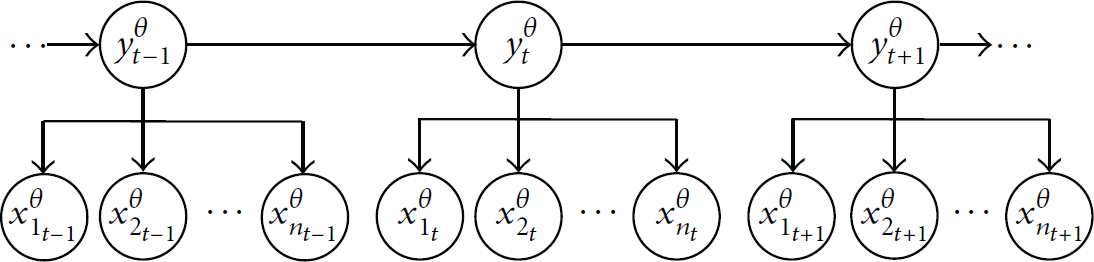
3.3. Learning the Model Parameters
The model parameters are apparently learnt from learning samples. To estimate the parameters from the sequences of observation Baum-Welch (BW) based algorithm is used [24, 25]. In BW method, for a given sequence of observations, an HMM with n states and an initial model
The probability of being in state 


Second layer of HMM (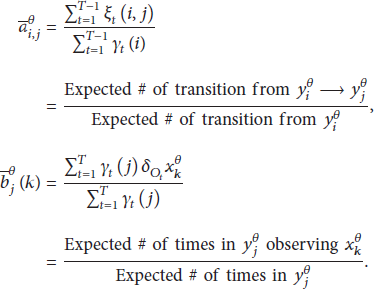
3.4. Inferring the Best State Sequence
To infer the best sequence of groups as well as activities we have used Viterbi algorithm which has been successfully applied with HMM to solve many activity recognition problems [24]. Viterbi algorithm can find out the best sequence efficiently using dynamic programming and discard a number of paths at each time step. The computational complexity of Viterbi algorithm is less than other algorithms (direct calculation, forward-backward). Inference is done in simultaneous manner: the groups and the activities are estimated simultaneously based on Viterbi algorithm.
4. Experimental Setup and Results
We evaluate the performance of the proposed 2-layer HMM in recognizing activities of ADLs and compare it with three well-known classifiers: naïve Bayes, CRF, and HMM using three real datasets. Sensor data were segmented in time slices of length
Details of group information for Kasteren datasets: activity classification based on location data.
Raw. This feature uses the sensor data directly as it was collected from the sensor network. The value is 1 when the sensor fires and 0 otherwise.
Change Point (CP). This feature indicates when a sensor changes value. The value is 1 when a sensor state goes from zero to one or vice versa and 0 otherwise.
Last-Fired (LF). This feature indicates which sensor fired last. The sensor that changed state last continues to value 1 and changes to 0 when another sensor changes state.
We accommodate three distinct features, Raw, Change Point (CP), and Last-Fired (LF), and four combined features: Raw + CP, Raw + LF, CP + LF, and Raw + CP + LF. The combined feature representation is a concatenation of the feature matrices. Figure 6 shows the three distinct features.
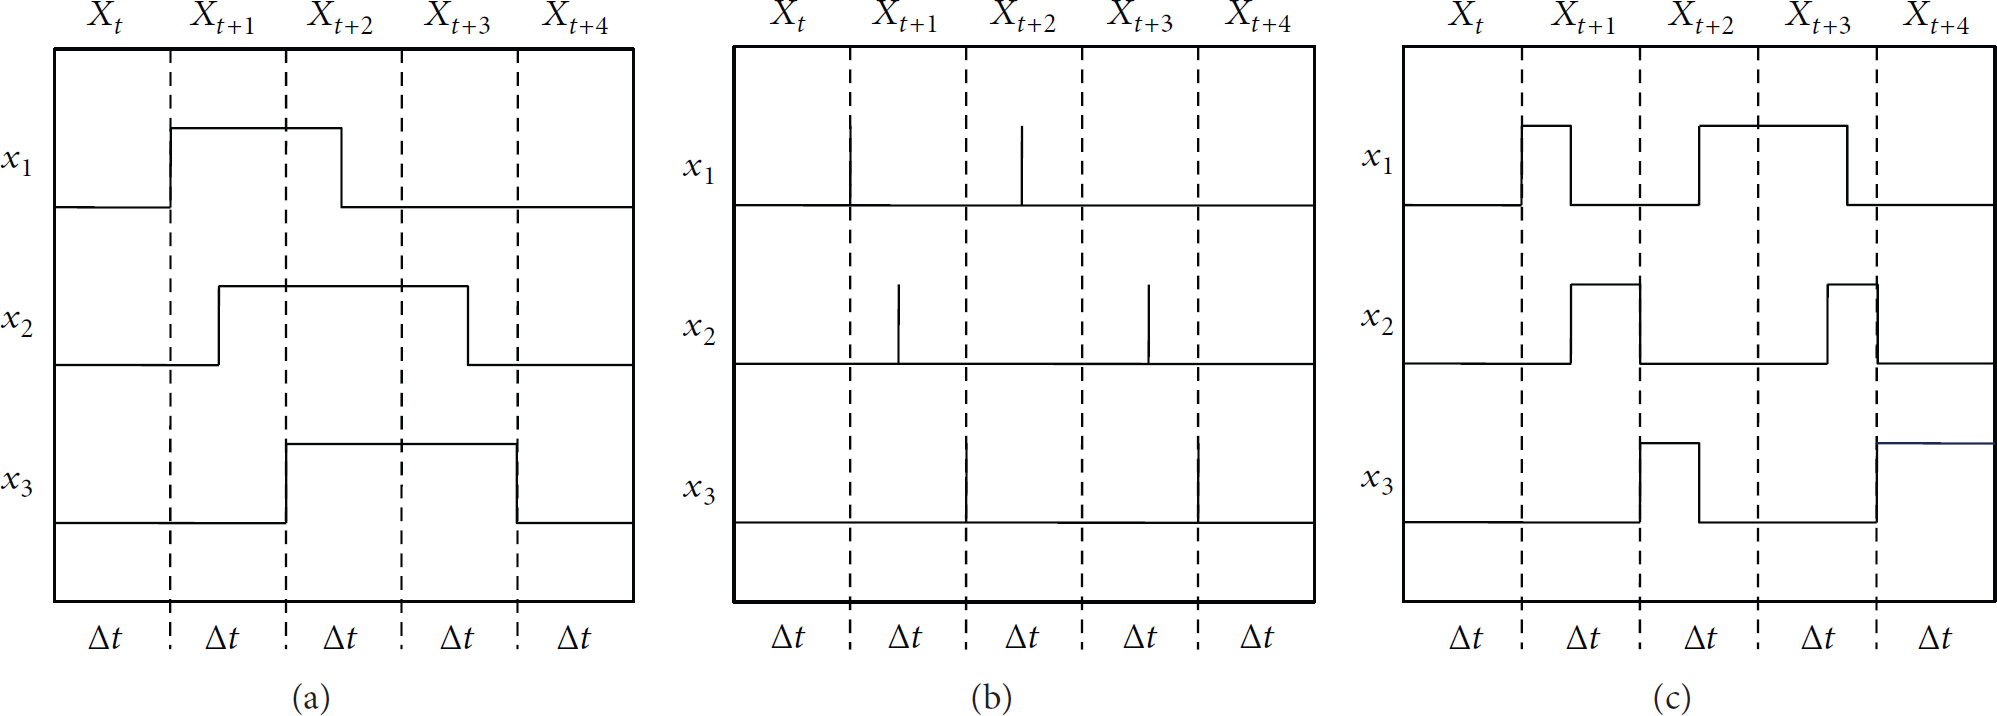
Feature representations of (a) Raw, (b) Change Point, and (c) Last-Fired.
The data were split into a test and training set using a “leave one day out” approach in which one day of sensor data is used for testing and the remaining days are used for training. The process is repeated for each day and the average performance is measured. The performance of the proposed 2-layer HMM is evaluated using precision, recall, and F-measure. F-measure data were expressed as a mean ± standard deviation and significance was analyzed using Student's t-tests. Statistical significance was considered as 
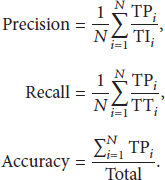
Confusion matrix showing the true positives (TP), total of true labels (TT), and total of inferred labels (TI) for each class of activity.

Confusion matrix of two-layer HMM using “Change Point + Last-Fired” feature for House-A of Kasteren dataset.

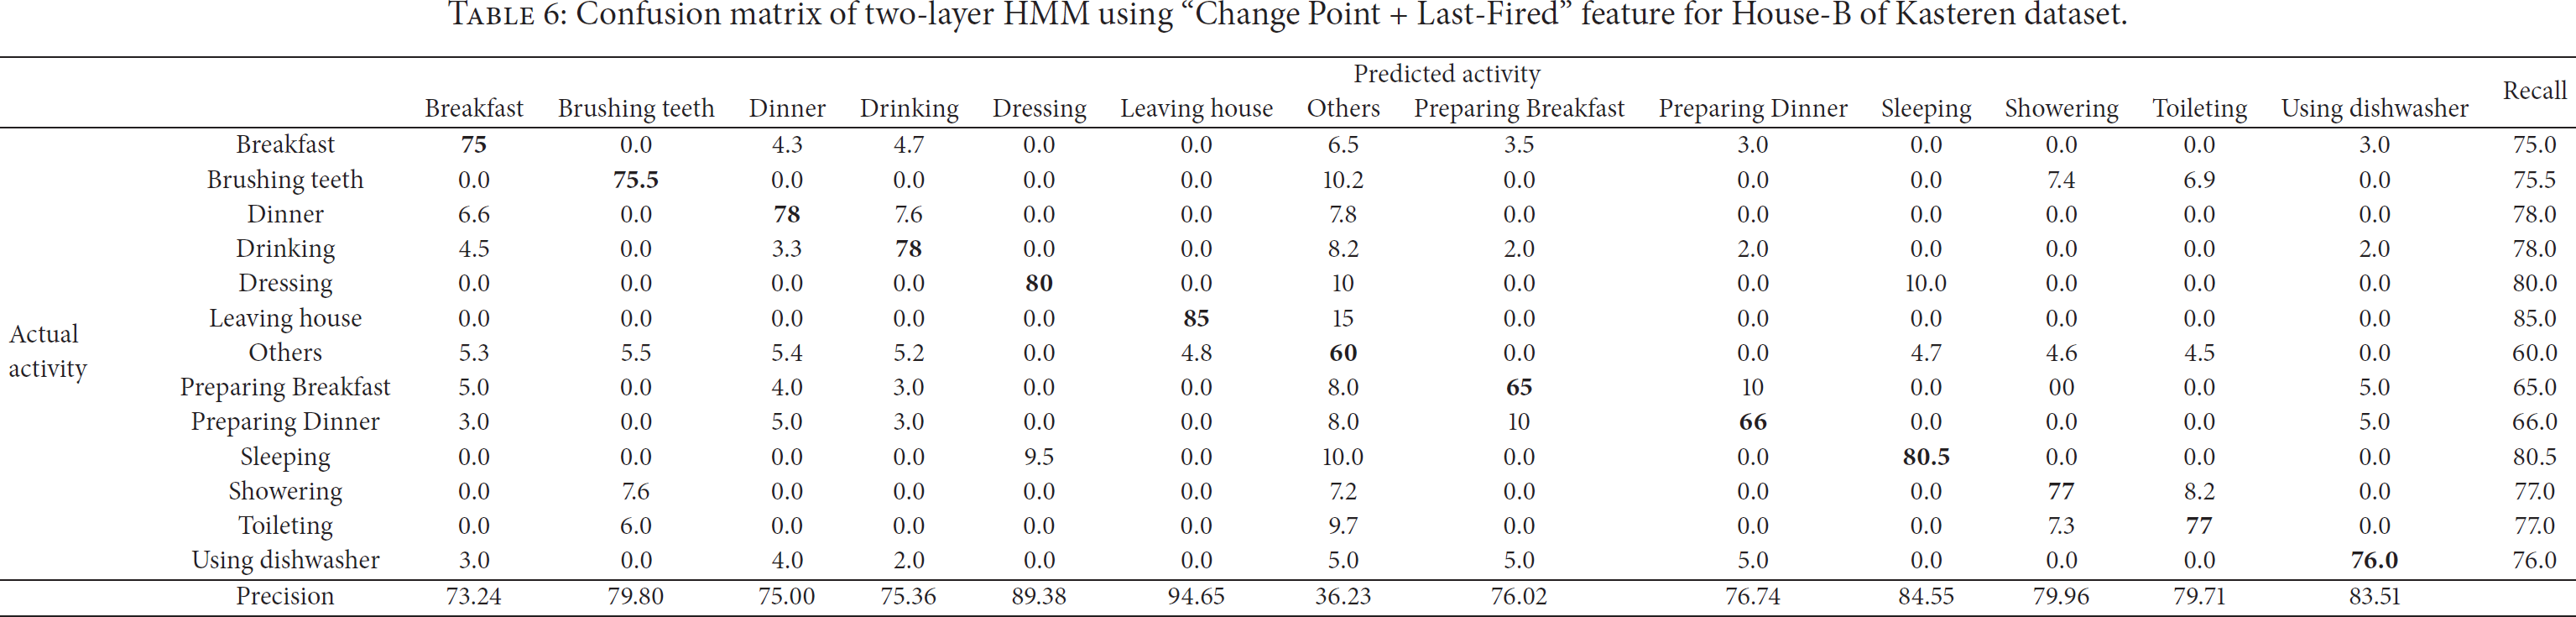
Confusion matrix of two-layer HMM using “Change Point + Last-Fired” feature for House-B of Kasteren dataset.
Confusion matrix of two-layer HMM using “Change Point + Last-Fired” feature for House-C of Kasteren dataset.

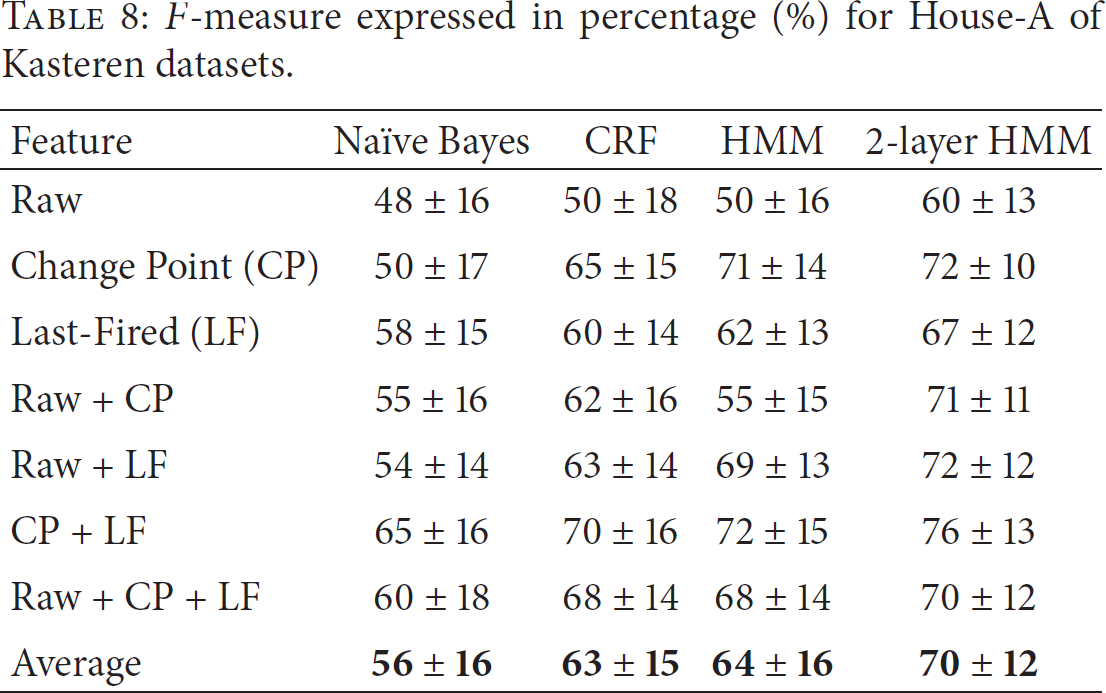
The average F-measure values for the three datasets are tabulated in Tables 8–10. Rows in the tables correspond to the different distinct and combined features whereas columns represent the experimental results for each activity recognition model. In case of the “Change point + Last-Fired (CP + LF)” feature the highest F-measure value is achieved. F-measure data are expressed as a mean ± standard deviation and significance is analyzed using Student's t-test. Statistical significance is considered as
F-measure expressed in percentage (%) for House-A of Kasteren datasets.
F-measure expressed in percentage (%) for House-B of Kasteren datasets.

F-measure expressed in percentage (%) for House-C of Kasteren datasets.

The experimental results for House-A of Kasteren datasets are similar to House-B of Kasteren datasets. The 2-layer HMM achieves the best F-measure value for all datasets using distinct feature “Change Point (CP)” and combined feature “Change Point + Last-Fired (CP + LF).” The average performance of each activity model for all datasets is shown in Figure 7. From Figure 7 we can conclude that the 2-layer activity model outperforms the other activity models.
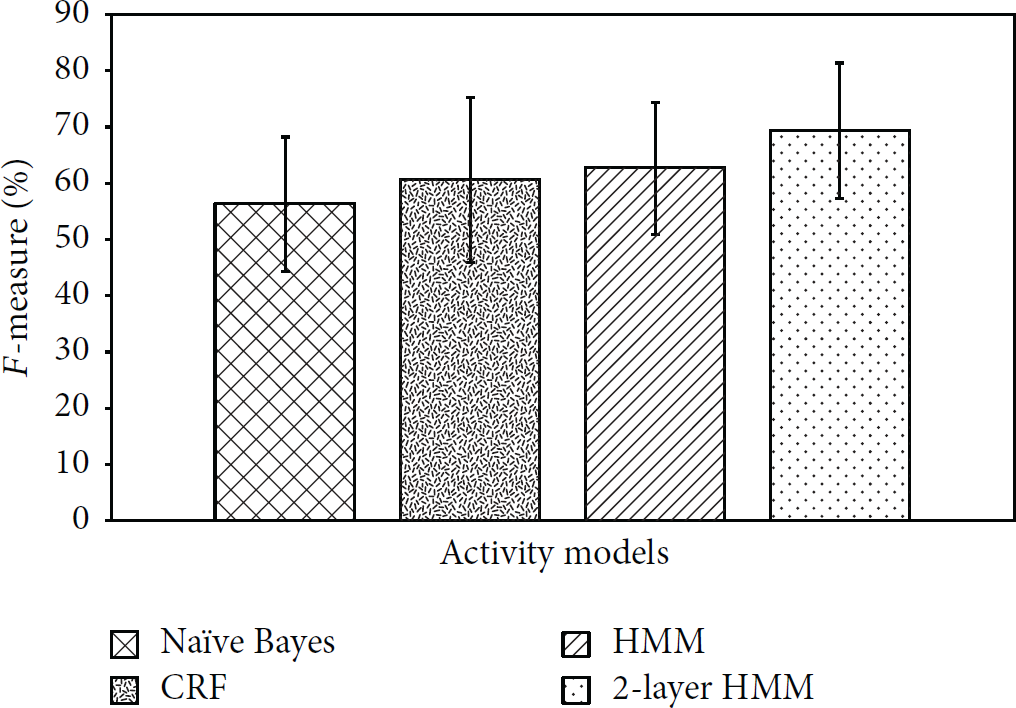
Performance comparison with the existing systems.
Time complexity arises while calculating the joint probability of each state sequence with the observed series of events. For example, an HMM having N states will need
Using 2-layer HMM we can reduce the number of hidden states as well as the number of symbols in each hidden state. Comparison of time complexity for HMM and 2-layer HMM is tabulated in the following table. We calculate output sequence length L, multiplying the number of symbols emitted in corresponding layer by the number of time slices with time duration of 60 s. In House-A of Kasteren dataset, the number of hidden states and the number of observation symbols in each state for the HMM are 10 and 14, respectively. Then time complexity can be calculated as
Comparison of time complexity (

5. Conclusion
We have presented new approach to recognize ADLs using binary sensors in home environments. We proposed 2-layer HMM using location information in first layer and object used information in another layer. We used three real datasets to evaluate the recognition performance of the proposed model and then make a comparison with the other activity recognition models. For evaluation we considered F-measure, a measure that considers the correct classification of each class as equally important. F-measure data were expressed as a mean ± standard deviation and significance was analyzed using Student's t-test. Statistical significance was considered as
Footnotes
Conflict of Interests
The authors declare that there is no conflict of interests regarding the publication of this paper.
Acknowledgment
This work was supported by the Industrial Strategic Technology Development Program (10041788, Development of Smart Home Service based on Advanced Context-Awareness) funded by the Ministry of Trade, Industry & Energy (MI, Korea).