
Abstract
Aiming at the synthesis process through the ethylene polymerization by virtue of fluidized bed reactors, this paper proposed a different approach for agglomeration monitoring and early alarming in polymerization reaction with Gaussian test of wavelet packet entropies from low-frequency audible acoustic signals. In comparison to high-frequency acoustic emission signals, audible acoustic signals can reduce the signal bandwidth, simplify the signal processing circuit, facilitate the real-time measurement, and fault detection. Compared with the approach based on regression modeling and pattern recognition, this approach can overcome the defects of false alarm and missing alarm caused by inadequate samples and weak generalization capability of diagnosis model and is easy to be implemented. Experiments in a pilot plant have verified the effectiveness of the approach, and earlier warning could be realized compared with the existing approaches on the production apparatus (material level detection and temperature measurement).
1. Introduction
For its merits such as high heat and mass transfer efficiency and uniform mixing of reaction particles, fluidized bed reactor (FBR) is well established and widely used in industry, especially large-scale continuous production. However, in actual polymerization practice, the hydrodynamics may be changed drastically due to the static electricity and the low heat exchange capacity, which will lead to particle aggregation, melting sheeting, agglomeration, and even unscheduled shutdown of the plant. Therefore, the early warning approach of gas-solid fluidized bed agglomeration has always been a research topic of great interest. Data management and information processing play the key roles in industry [1]; we need to design a method to find the clues of aggregation from the information collected by the sensor through the information processing. A number of techniques to detect agglomeration have been proposed, such as fluctuating pressure measurements [2, 3], temperature measurement [4], electrostatic measurement [5], radiation measurement [6], and acoustic emission (AE) measurement [7], of which the AE measurement has been considered as an attractive technique for monitoring fluidized beds due to its nonintrusive, rapidness, safety, and low cost. Based on the use of piezoelectric acoustic emission sensors (with resonance frequency of 30 kHz, 70 kHz, and 150 kHz, resp.), Whitaker et al. [8] reported a novel monitoring technique for a particle distribution measurement of a high shear granulation process and obtained the particle size distributions (PSD) from the acoustic signals by the partial least squares (PLS). Tsujimoto et al. [9] developed a high-frequency (140 kHz) acoustic emission sensor to monitor the particle fluidization in a fluidized bed granulator and established a correlation between the average amplitude of the acoustic signal and bed height and gas velocity. Based on PLS regression, Halstensen et al. [10–12] implemented in-line measurement of particle size distribution of a fertilizer production process based on high-frequency acoustic emission signals (0–250 kHz) with high precision and realized the discrimination of normal state and agglomeration state by principal component analysis (PCA). Based on the multiscale decomposition analysis of acoustic emission signals and the mechanism of acoustic wave generation inside fluidized bed, Yang et al. [13, 14] established the Hou-Yang model to realize the in-line measurement of the distribution of particle size (average deviation less than 15.8 per cent). Salehi-Nik et al. [15] processed the acoustic emission signals (50 kHz–1.5 MHz) with the signal statistical distribution characteristics and realized the regime monitoring of gas-solid fluidized bed. Hansuld et al. [16] used PLS-DA and sound waves in audible range for process monitoring and end-point control in high shear wet granulation and verified in a lab-scale plant. Weiguo et al. [17] used reduced support vector domain description (RSVDD) method to build agglomeration diagnosis model to improve training speed for industrial practice, this method needs to design a diagnostic model by setting a certain false alarm rate. In summary, the main research objects of above literatures are fluidized bed dryer or granulator, and the involved reactions are mainly physical reactions including heat transfer, drying, film covering, and granulation. Meanwhile, pilot plant or lab-scale plant is the main reactors, and the purpose is to create an association between acoustic signals and PSD.
Aiming at the synthesis process through the ethylene polymerization by virtue of fluidized bed reactors, this paper proposed a different approach for agglomeration monitoring and early alarming in polymerization reaction with Gaussian test of wavelet packet entropies from low-frequency audible acoustic signals. In comparison to high-frequency acoustic emission signals, audible acoustic signals can reduce the signal bandwidth, simplify the signal processing circuit, and facilitate the real-time measurement and fault detection. Compared with the approach based on regression modeling and pattern recognition, this approach can overcome the defects of false alarm and missing alarm caused by inadequate samples and weak generalization capability of diagnosis model and is easy to be implemented. Experiments in a pilot plant have verified the effectiveness of the approach, and earlier warning could be realized compared with the existing approaches on the production apparatus (material level detection and temperature measurement).
2. Experimental Equipment and Acoustic Signal Acquisition
Figure 1 is the schematic diagram of fluidized bed agglomeration acoustic monitoring system for the overall structure, which consists of a pilot plant of the polyethylene fluidized bed and an acoustic signal acquisition system.
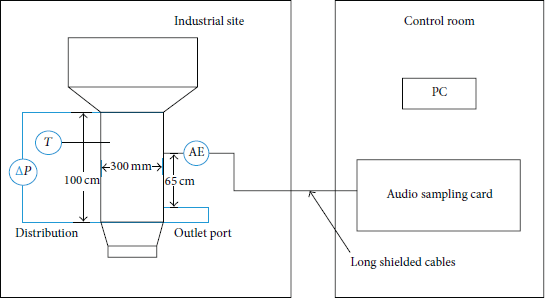
Schematic diagram of the experimental apparatus.
2.1. Polymerization Chemical Equation and Control Condition
As a kind of polymerization kettle, the equipment uses gas phase production technology and is made of carbon steel, with a design pressure of 6.0 MPa and design temperatures of 0–130°C. The feed stocks of the reaction include ethylene, butylene, and hydrogen in gaseous state, and the product is polyethylene of powder state. The catalyst is solid ALEt3 powder and the cocatalyst is alkyl aluminum. The main chemical reaction equation can be expressed as

The reactor control conditions are set as follows: the temperature is 85°C; the pressure in the reactor is
2.2. Existing Detection Equipment for Agglomeration
The current agglomeration detection is based on material level signal and temperature signal. The material level measurement is conducted through the differential pressure detection (its installation location is shown in Figure 1) inside FBR, and the height of material level is controlled by a single loop PID system which can open the outlet valves if the level is higher than the set point. If the material level cannot drop due to the agglomeration block larger than the outlet port diameter, the device must be stopped and dismounted to get the agglomeration out. Furthermore, a platinum resistor is introduced as a temperature sensor (its installation location is shown in Figure 1), which can send a warning signal when a large temperature change is detected.
This device is a pilot plant for investigating different manufacturing process of different-type PEs. Since the particle distributions are different for different products, the main purpose of agglomeration detection is to avoid the explosive polymerization clogging the outlet by product (the diameter of the outlet is 50 mm). In this work, an acoustic approach is proposed to avoid the above fault, and some comparisons are made with the existing approaches in terms of time consumption and alarm accuracy.
2.3. Sampling System of Acoustic Signal
The acoustic signal sampling system consists of acoustic sensor, long shielding cable, soundcard sampling system, and PC. A piezoelectric ceramic sensor is used here as the acoustic sensor and pasted on the upper wall of the outlet port covering with silicone rubber. Silicone rubber can prevent the influence of external interference on measurement results because of owning the ability of sound insulation. What is more, piezoelectric ceramic piece has many advantages, such as high sensitivity, good stability, high and low temperature resistance, and low cost. In this system, acoustic signal sampling is conducted through independent soundcard. Monitoring program calls for soundcard driver every sampling and storage interval, the sampling time is 1.486 s, the sampling rate is 44.1 kHz, and the sampling precision is 16 bits. The sampling system collects 65536-point data continuously and stores them once the sampling is completed (the sampling and storage interval is 9 s), data sampling and storing is repeated without break. To some extent, it is also a kind of “Big Sensing Data” [18], if early alarming can be alerted with downsampled data that will be a good progress.
3. Feature Extraction of Agglomeration Based on Wavelet Packet Entropy
3.1. Feature Analysis of Acoustic Signal in Frequency Domain and Its Preprocessing
Figure 2 shows original acoustic signal and its power spectrum of the material particles detected by the acoustic sensor (under the normal condition of which the gas velocity is 0.71 m/s, the reaction temperature is 86°C, and the internal pressure is 1.9 Mpa). In Figure 2, (a) is the original acoustic signal, (b) depicts the total and the part (0–335 Hz) of the power spectrum of the original acoustic signal.
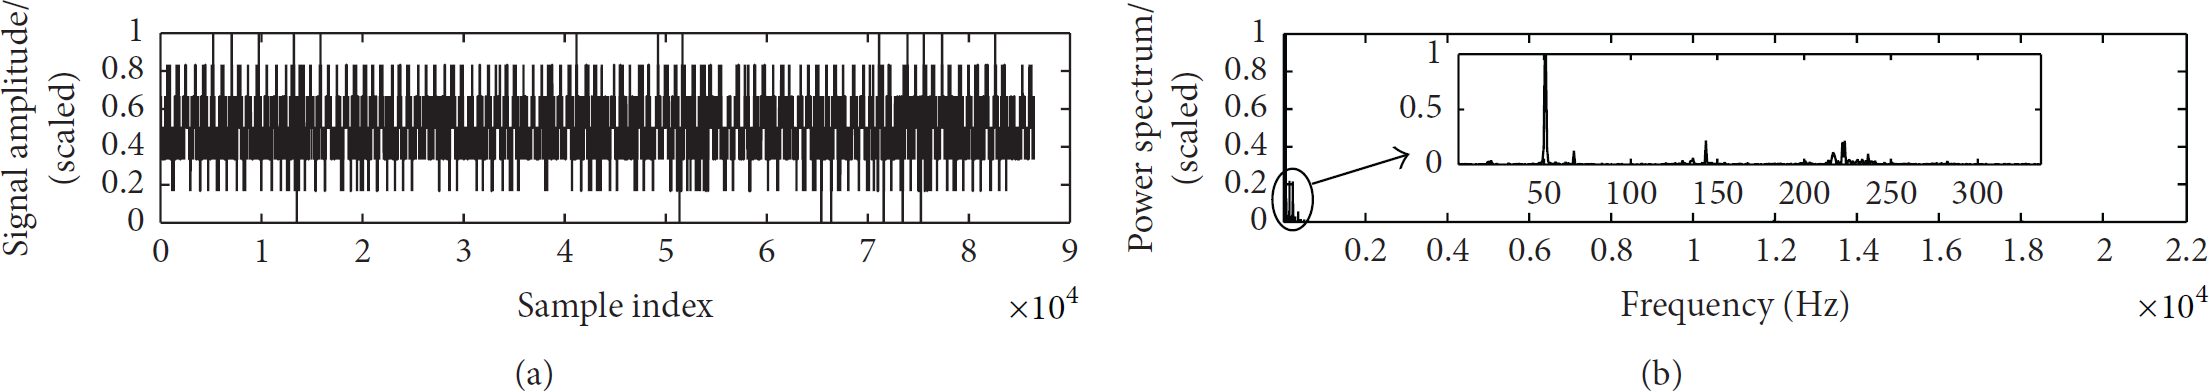
Acoustic signal and its power spectrum in the normal state.
In the synthesis process which uses fluidized bed to manufacture polyethylene, original acoustic signal and its power spectrum of the material particles detected by the acoustic sensor are shown in Figure 3 in the condition of particle aggregation and forming agglomerates. In Figure 3, (a) is the original acoustic signal, (b) depicts the total and the part (0–335 Hz) of the power spectrum of the original acoustic signal.
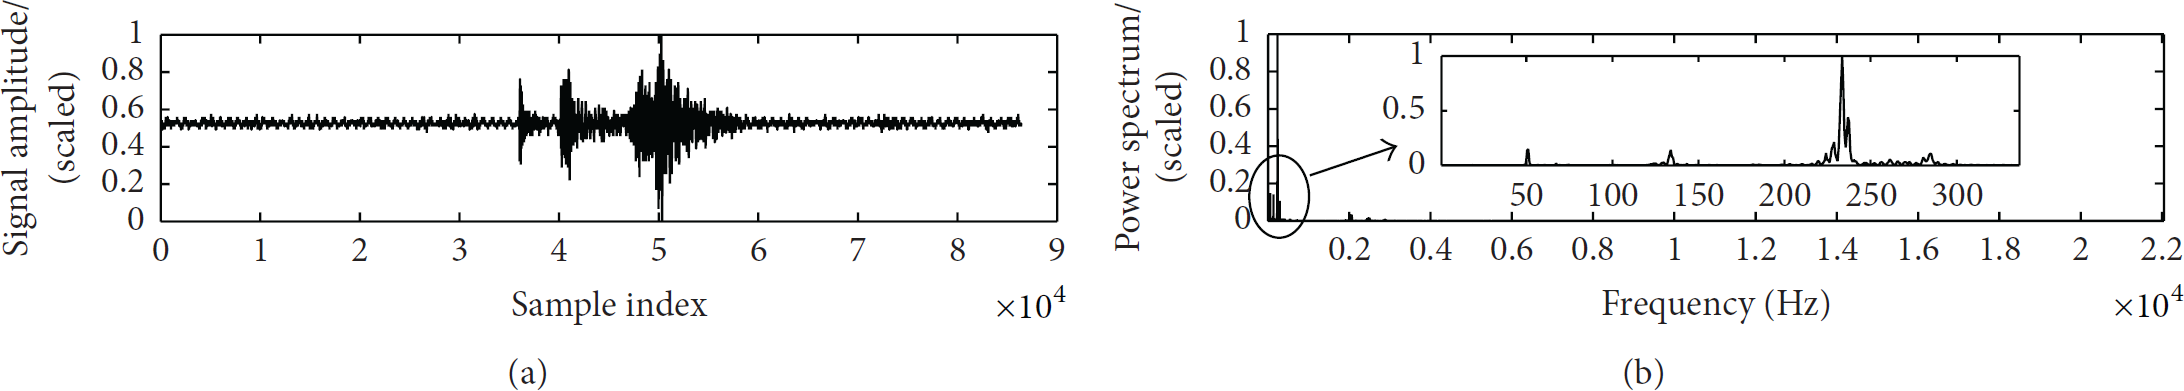
Acoustic signal and its power spectrum in the agglomeration state.
Power spectrum can characterize the change of signal energy with frequency. Figures 2 and 3 show that the original acoustic signal energy is concentrated in 0~300 Hz with apparent 50 Hz power frequency interference in the normal state. While in the agglomeration state, the acoustic signal energy in 200–300 Hz has increased significantly. The main energies of the two kinds of signals are all concentrated in the low-frequency band and the energy in high-frequency band is less.
In order to effectively reduce the information redundancy and reduce the sampling rate, analyze the energy distribution of acoustic signal in frequency domain with integral method. Define power spectrum sequential energy ratio as

Figure 4 is a comparison of sequential energy ratios of power spectrum in normal and agglomeration state. Table 1 lists the accumulations of power spectrum energy ratio of the former 2048, 4096, 8192, and 16384 corresponding to five normal samples and five agglomeration samples (all the signals are processed with 50 Hz notch filter).
The accumulations of power spectrum energy ratio of different frequency bands.

Note: 1–5: normal signal, *6–10: agglomeration signal.

Comparison of sequential energy ratios of power spectrum in normal and agglomeration state.
It can be seen from Figure 4 and Table 1 that, on the premise of 44.1 kHz sampling rate and 65536 points of sampling data, the energy of the former 8192 power spectral line (corresponding to 0–5.5125 kHz frequency band) accounts for more than 90% of the whole frequency band signal energy for the agglomeration acoustic signal. Based on this, the sampling rate can be reduced to 11.025 kHz. Resampling the acoustic signals shown in Figures 2 and 3 with 11.025 kHz sampling rate (decimation with 1 : 4), their power spectrums were compared with the old power spectrums as shown in Figures 5 and 6.

Power spectrums comparison between original and downsampled signal in normal state.
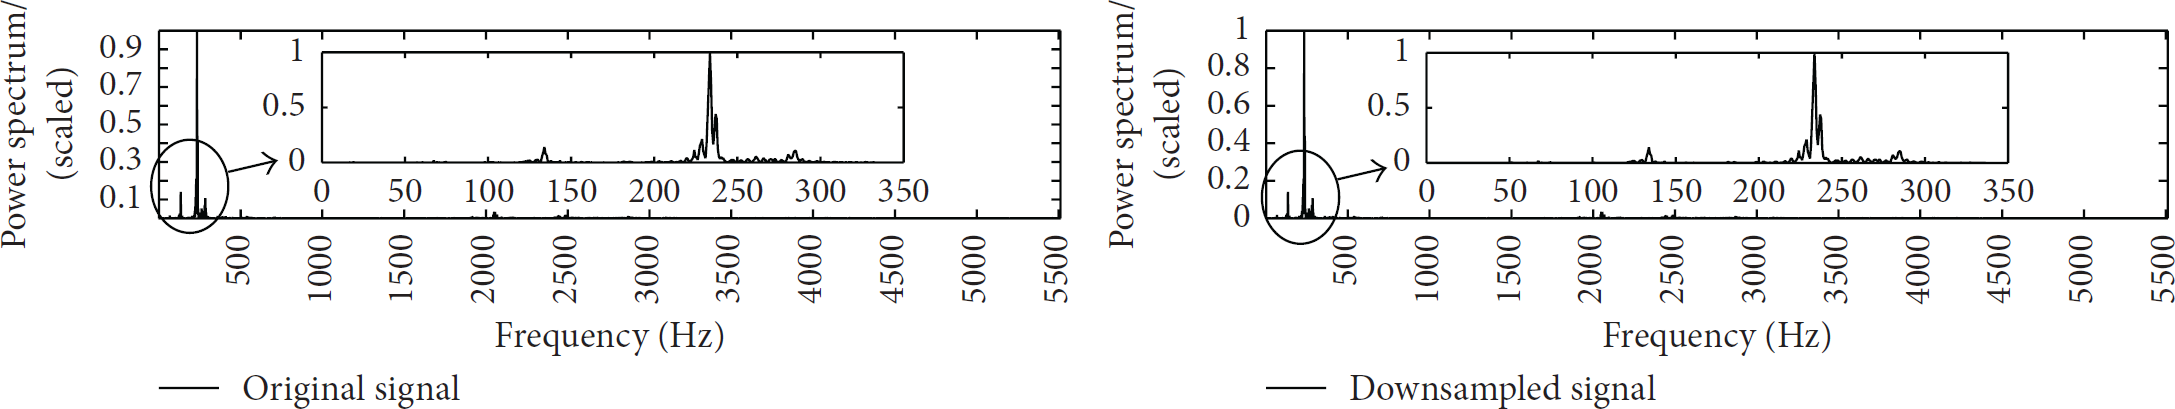
Power spectrums comparison between original and downsampled signal in agglomeration state.
Figures 5 and 6 show the power spectrums comparison between original and downsampled signal in agglomeration state. It can be found that the power spectrums of original and downsampled signal are very similar. In accord with the premise of Nyquist sampling theorem, downsampling has not changed the feature of acoustic signal in frequency domain.
Through the above analysis, it can be concluded that the sampling rate can be reduced to 11.025 kHz for the agglomeration monitoring with acoustic sensor, and the acoustic signal should be preprocessed with 50 Hz notch filter rather than other commonly used filters [19] because of the strong power frequency interference. In the subsequent signal processing, all signals were resampled with 11.025 kHz sampling rate and processed with 50 Hz notch filter.
3.2. The Theory of Wavelet Packet Entropy
In information theory, entropy is used to express the average output information quantity of information sources. It can provide useful information about the potential dynamic process. Entropy can also be viewed as a measure of averaging signal uncertainty and complexity. Shannon entropy theory pointed out that, for a nondeterministic system, if random variables X with limited quantity were taken to represent its state characteristic, the probability of 
The basic idea of wavelet packet entropy is to process the wavelet packet coefficient matrix into a probability distribution sequence, which is used to reflect the order level of the probability distribution signal and the energy ratio distribution of each wavelet packet. Changes in the signal can be observed under different scales with wavelet packet decomposition. Assume that each frequency band as an information source; then the reconstruction coefficient of wavelet packet in each frequency band is equivalent to the message of one information source. In this way, the wavelet packet entropy of the acoustic signal can be calculated with the wavelet packet reconstruction coefficient, which is also called the multiscale wavelet packet entropy.
3.3. Determination of Wavelet Packet Decomposition Scale
Scale of wavelet packet decomposition needs to be solved first for wavelet package entropy calculation. One kind of determination for wavelet packet decomposition scale is comparing the difference between power spectrum centroids before and after agglomeration. The total energy of the acoustic signal is defined as the accumulation of all power spectrum lines:


When fluidized bed changes from normal state to agglomeration state, the energy of acoustic signal in different frequency band will change accordingly, leading to a shift of power spectrum centroid.
A comparison of power spectrum centroids before and after agglomeration is shown in Figure 7. The corresponding acoustic signals are sampled at 44.1 kHz sampling rate from 6:30 to 8:30 a.m., 09/03, 2013, and processed with 50 Hz notch filter.

Comparison of power spectrum centroids before and after agglomeration.
It can be found from Figure 7 that the power spectrum centroids of normal signals fall in the range from 4000 Hz to 5600 Hz. Once agglomeration occurred, the centroids shift to lower frequency.
Downsampling the original acoustic signals mentioned above with 11.025 kHz sampling rate, signal processed with 50 Hz notch filter, a new comparison of power spectrum centroids before and after agglomeration is shown in Figure 8. It can be found that the power spectrum centroids of normal signals fall in 500 Hz–800 Hz range and shift to higher frequency when agglomeration occurred.

Power spectrum centroids comparison of downsampled signal before and after agglomeration.
The agglomeration occurring time (the outlet is clogged by product) are marked in Figures 7 and 8, respectively. It can be found that there is shift of power spectrum centroid up and down occasionally before the agglomeration occurred, such as (a) time in Figure 7 and (b) time in Figure 8. Tracing the signals at (a) and (b) time, their waveforms are similar to that shown in Figure 3, but there were no stop records of fluidized bed at these times. The reason is that the condition of particle aggregation occurs frequently in the process of polymerization in a fluidized bed, as the size is small and at an early stage, the agglomeration would dissipate by itself along with the reaction and the collision with the bed wall and other material particles. Agglomeration would occur at any time in the process of polymerization in a fluidized bed. As long as the agglomeration is accidental rather than a continuous occurrence, it will dissipate on its own and would not affect the normal operation of the fluidized bed.
Figures 7 and 8 show the power spectrum centroids comparison of downsampled signal before and after agglomeration. It can be further found that the power spectrum centroid of agglomeration signal corresponding to 44.1 kHz sampling rate shift to lower frequency, but it shift to higher frequency when resampled the original signal with 11.025 kHz sampling rate. This phenomenon precisely indicates that the acoustic signal energy is concentrated in the range of 500 Hz–5000 Hz after agglomeration, and data acquisition with 11.025 kHz sampling rate is reasonable.
It can be found from Figure 8 that the minimum shift of power spectrum centroid before and after agglomeration is bigger than 200 Hz, so if the frequency subband of wavelet packet decomposition is less than 200 Hz, normal and agglomeration state can be discriminated. Under the premise of sampling rate 11.025 kHz and the wavelet packet decomposition scale 5, the frequency domain resolution is up to 172 Hz and can meet the requirements of frequency resolution.
3.4. Voiceprint Extraction Based on Wavelet Packet Entropy
The step of voiceprint feature extraction based on wavelet packet entropy is as follows.
(1) The signal is decomposed and reconstructed by S layer wavelet packet, and the reconstructed signal of the wavelet packet is obtained.
(2) Calculate the power spectrum of each frequency reconstruction signal and the energy ratio.
Defining energy of a reconstructed signal as follows:
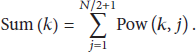
In (6), k stands for the band index of the wavelet packet reconstruction signal; 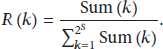
Figures 9 and 10 show the wavelet packet energy ratio of the acoustic signal in normal state and agglomeration state. Here, db1 wavelet is applied and scale S is 5 (namely, there are 32 energy ratios). In normal state, as shown in Figure 9, the energy of acoustic signal mainly concentrates in the former four-band (0~689 Hz) range, which is about 70% of the total energy and the former two bands account for about 50% of total energy, and the energy is uniformly distributed among the high-frequency parts. Under agglomeration state, as shown in Figure 10, the energy distribution of the acoustic signal was no longer in a stable state and energy centroid shifted to high-frequency part. The energy ratio of the former four bands downs to 58.8%, the energy ratio of the former two bands downs to 45%, and the energy is no longer uniformly distributed among the high-frequency parts.

Energy ratio of each band of the acoustic signal in normal state.
Energy ratio of each band of the acoustic signal in agglomeration state.
(3) Since 
Figure 11 shows the wavelet packet entropy of acoustic signals before and after agglomeration calculated according to (8) (corresponding to the same acoustic signals as Figure 8). What is shown in Figure 11 is that the wavelet packet entropy of the acoustic signal in normal state is roughly stable (more or less in Section 3.3) and occasionally shifts up and down with the change of working conditions, and as the agglomeration-dissipation exists in the synthesis process, there are sudden changes in wavelet packet entropy occasionally, but the overall trend is stable. When agglomeration occurs frequently, the wavelet packet entropy of the acoustic signal will change obviously, indicating the internal degree of difference of acoustic signals increased, the acoustic signal is no longer in the original steady state, and large fluctuations occurred.

Wavelet packet entropy of acoustic signal before and after agglomeration.
4. Fluidized Bed Agglomeration Diagnosis Based on Gaussian Test
Sometimes the agglomeration will dissipate due to the collision with the inner wall of the reactor, so a sudden change in wavelet packet entropy will easily cause false alarm only with a threshold, and operational conditions adaptability of the fluidized bed agglomeration diagnosis is difficult to be guaranteed. Wavelet packet entropy sequences of acoustic signals under normal working condition are relatively stable and can be considered as they obey Gauss or quasi-Gauss distribution. Once agglomeration occurred, there are sudden changes in wavelet packet entropies and they deviate from the Gauss distribution. In this paper, the wavelet packet entropies of acoustic signals are processed and the agglomeration diagnosis of the fluidized bed is implemented with the Gaussian test.
The higher-order cumulant of Gaussian signal (third-order or above third-order) is 0; the characteristic of higher-order cumulant can be used to judge the Gaussianity of a signal [20]. Kurtosis is defined as a fourth-order cumulant of random signal and can be a criterion used to measure signal Gaussian. For a zero mean signal, kurtosis is defined as
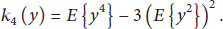
Normalize the signal y, then 
Therefore, diagnosis of fluidized bed agglomeration can be implemented with the Gaussian test of wavelet packet entropy sequence calculated from acoustic signals within a period of time. The step of fluidized bed agglomeration diagnosis based on Gaussian test is as follows.
Set T as the sampling period of the signal and take M signal sampling periods as a diagnosis period; that is, the length of the monitoring time window is The wavelet packet entropy For overcoming the wavelet packet entropy drift over time, use formula (11) to calculate the absolute difference To avoid the false alarm caused by the phenomenon of the agglomeration-dissipation in the synthesis process, smooth the In the diagnosis period

Figure 12 is the kurtosis output corresponding to the wavelet packet entropy shown in Figure 11 (moving average window
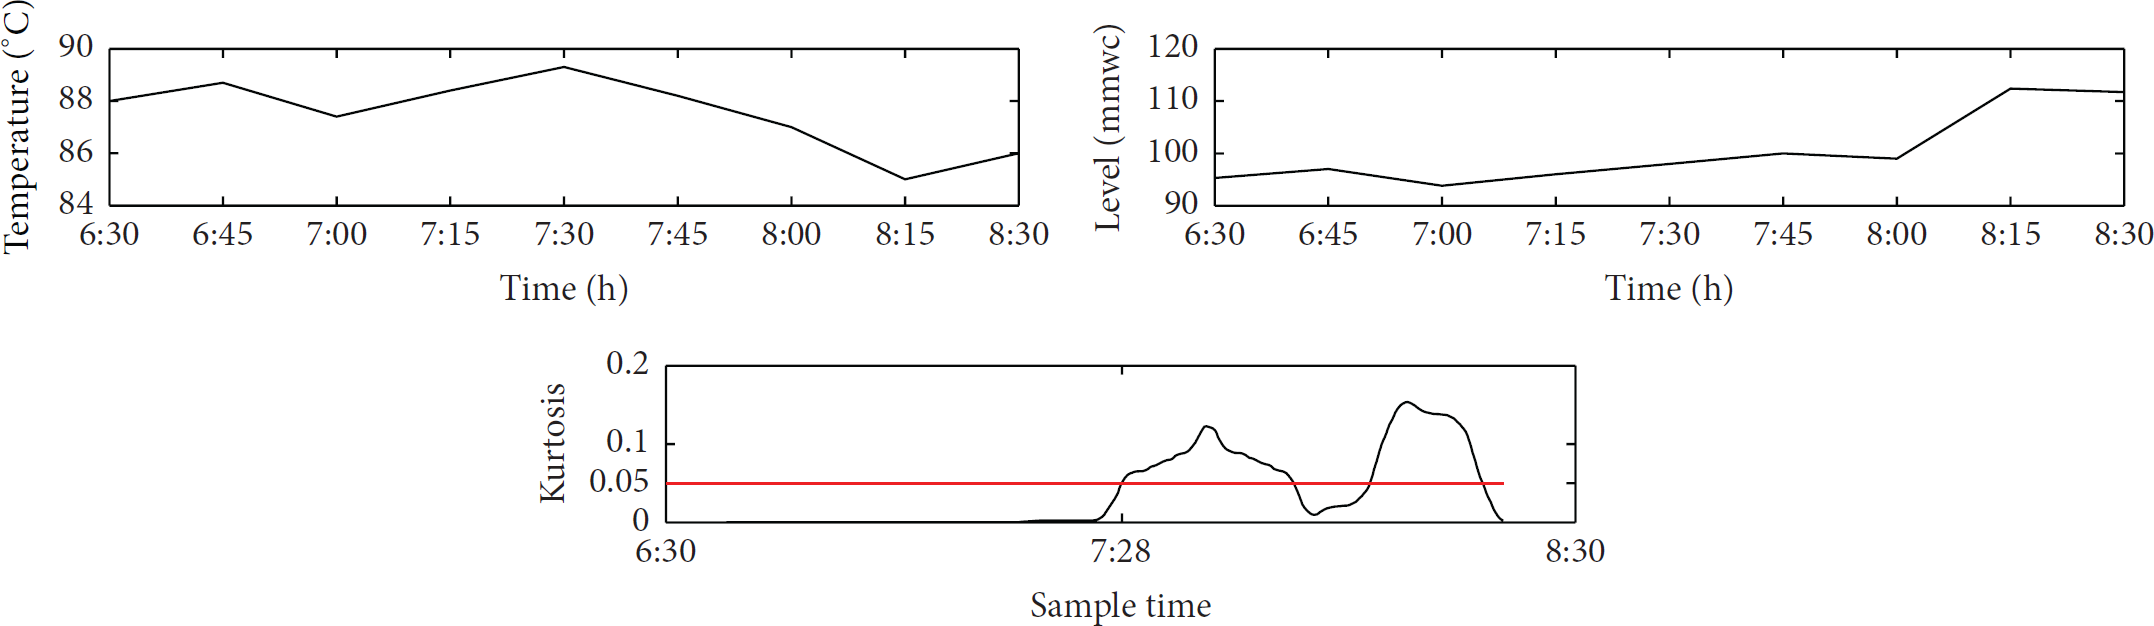
Comparison of kurtosis with material level and temperature (March 9, 2013, 6:30–8:30).
5. Validation Test
In this paper, a pilot polyethylene fluidized unit in SINOPEC Research Institute of Chemical was used as the experimental platform. The apparatus of production was about 2.0 kg/h, the reaction temperature was 86°C, the total pressure was 1.9 Mpa, ethylene (HPLC) was 35%, and alkyl aluminum stroke was 20%. The experimental device and sensor used in this paper are shown in Figure 13.

The experimental device and sensor for fluidized bed.
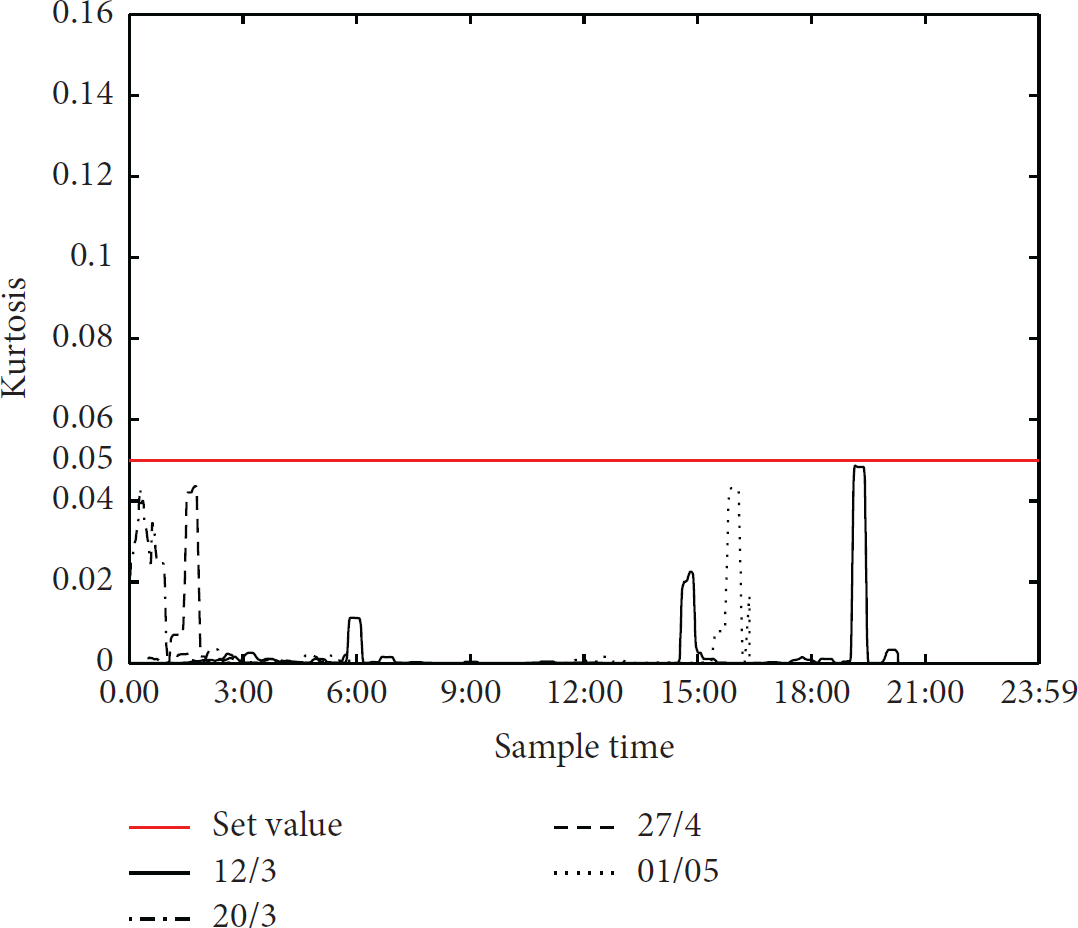
There were four stop records caused by material agglomeration, respectively, on 30/4/2013, 2/5/2013, 5/5/2013, and 23/7/2013. The corresponding output of kurtosis alarm with agglomeration is shown in Figure 14, the stop recording and the warning time are shown in Table 1. The corresponding kurtosis output of the stop records without agglomeration is shown in Figure 15.

The corresponding output of kurtosis alarm with agglomeration.
The corresponding output of kurtosis without agglomeration.
By Table 2, the approach had a higher sensitivity for agglomeration detection and could alert warning signal of agglomeration in time. Compared with the existing temperature signal and material level height signal, it could alert early warning signal about 18–45 min ahead of the existing signal. And the time of early warning is related to the characteristics of material and the operation conditions. The agglomeration diagnosis approach mentioned in this paper has a short delay time and the capability of early warning. It is convenient for operators to adjust the process technical parameters in time and prevent the device from stopping caused by alarm lag to guarantee the continuity of polymerization reaction.
The stop records of fluidized bed and warning time.

6. Conclusions
The experimental results of the polyethylene fluidized bed reactor show that the fluidized bed agglomeration diagnosis based on wavelet packet entropy and Gaussian test can get the early warning of 18–45 min ahead of existing detection methods, no regression model, and pattern recognition is needed. This approach overcomes the time delay problem existing in the existing agglomeration detection based on temperature and material level, makes it easy to adjust the technical parameters, avoids stopping operation problem, and ensures the polymerization reaction continuously, which can improve the production efficiency and the quality of the product. This paper provides a new approach for early warning and monitoring for the safety and stable production of the fluidized bed reactor.
Footnotes
Conflict of Interests
The authors declare that they have no conflict of interests regarding this work. They declare that they do not have any commercial or associative interest that represents a conflict of interests in connection with the work submitted.
Acknowledgments
The authors gratefully acknowledged the support from the State Key Laboratory of NBC Protection for Civilian (SKLNBC2014-10); the National Natural Science Foundation of China (61403017); and the Fundamental Research Funds for the Central Universities (YS0104).