
Abstract
An ISO/IEC/IEEE21451 smart sensor network for distributed measurement of pavement structural temperature (PST) is proposed in this paper. The proposed network architecture is a star network based on GPRS communication, adapting to the measurement environment of PST. The proposed network node consists of autonomous power supply system, network capable application processor (NCAP), and smart transducer interface module (STIM). The design of hardware and software is based on ISO/IEC/IEEE21451-1 and ISO/IEC/IEEE21451-2 standards. A human-computer interaction website is designed based on B/S three-layer architecture. Users having access rights can access the PST data using a browser connected to the internet. The proposed system has been used in the experimental research of the PST distribution of asphalt and cement pavement. The experimental results demonstrate that the proposed smart sensor network can adapt to the distributed fieldwork and unattended measurement environment of PST. The validity and reliability of the system have also been verified.
1. Introduction
The pavement structure is continuously affected by a variety of environmental factors [1–3]. The consequence of such influence is mainly reflected in the complex distribution of pavement structural temperature (PST). The PST will directly or indirectly affect the bearing strength and performance of the pavement [4, 5]. Under different temperature conditions, the forms of pavement distress such as low temperature cracking and high temperature rut and upheaval will be different [6, 7]. There is a big difference in the distribution of PST in different regions. Accurately acquiring the distribution of PST can provide extreme temperature parameters for road designers, ensuring that the designed road will not be damaged under extreme environmental conditions. In recent years, many researchers have carried out a lot of research on the distribution of PST, mainly through the statistical analysis method and theoretical analysis method to establish the prediction models of PST [8–11]. No matter which method is used, a large number of measured PST data is needed, in order to supply PST data to road construction. Furthermore, extensive and long-term actual observation is also an effective method to supply PST dada to road construction.
At present there are no dedicated PST acquisition devices in the market. Most researchers obtain PST data using versatile data acquisition devices connected with temperature sensors. Among these versatile data acquisition devices, some require manual data reading and recording, some need that staff go to the scene regularly to copy the data stored in the local end, and some need cable data transmission and external power supply. These data acquisition devices could waste a lot of human and material resources and lead to a serious lag in the information acquisition time. These shortcomings of versatile data acquisition devices limit its large scale application in the field of data acquisition of PST. In order to save human and material resources, the PST observation should bear four characteristics: unattended, long-term observation, real time, wireless data transmission, and remote data access. From this point of view, an ISO/IEC/IEEE21451 smart sensor network is proposed in this paper, which can be used in the distributed measurement of PST in a wide range.
Sensor network is the base of ubiquitous sensor network (USN) and internet of things (IoT). It is a hot research topic in the current academic field [12]. In order to solve the problem of interchangeability and interoperability between sensors of different vendors, ISO, IEC, and IEEE jointly launched ISO/IEC/IEEE21451 series standards (known as IEEE1451.x previously), which provide a new idea for the network, intelligence, and standardization of sensors [13]. These standards extend the concept of smart sensor and define the network as an essential feature of smart sensor [14, 15]. Following the guidance of these standards, the smart sensor is divided into two parts: network capable application processor (NCAP) and smart transducer interface module (STIM). It achieves the interchangeability and interoperability between sensors of different vendors through special transducer electric data sheet (TEDS). Over many years of efforts, from ISO/IEC/IEEE21451-0 to ISO/IEC/IEEE21451-7 eight standards have been developed [14–20], among which ISO/IEC/IEEE21451-1 and ISO/IEC/IEEE21451-2 have been used in this paper. ISO/IEC/IEEE21451-1 defines a network information object model for smart sensors. Its purpose is to develop standardized connecting method for smart sensors using existing network control technology, through the definition of a common object model for the component of a networked smart sensor, together with interface specifications to these components [15]. In this standard NCAP is defined, which mediates between TIM and a higher level digital network, providing the software and hardware interfaces for connecting to network of sensors and also serving as a front-end controller in the networked control system. ISO/IEC/IEEE21451-2 defines TEDS and serial interfaces for point-to-point communication between transducers and NCAP, known as the transducer independent interface (TII) [16].
ISO/IEC/IEEE21451 series standards received great attention from the beginning and having been developing since then [21, 22]. At present these standards have been used in many fields including intelligent transportation, health management, internet of things, and ecological agriculture [23–30]. The reason why the authors choose ISO/IEC/IEEE21451 series standards in this paper is that they separate the sensor network and sensor function design and thus achieve interchangeability, interoperability, and scalability. If the other physical quantities, such as pavement structural stress, road surface salinity, and pavement structural humidity, are required to be measured in the future, we can quickly realize this measurement work by just adjusting part of the STIM in hardware and software implementation and adding these measurement systems to the smart sensor network proposed in this paper, meanwhile leaving the whole system structure unchanged.
2. Measurement Context and System Architecture
The purpose of measuring PST in a region is to establish the PST database by means of extensive and long-term actual observation on PST and to provide temperature data for the building of new roads and maintenance of old roads. To be accurate, we should choose many measuring points in this region, so as to reflect the features of longitude, latitude, and altitude as much as possible. But these measuring points are not necessary to be distributed too close to each other. Measurement personnel can choose the measuring points arbitrarily based on actual situation and actual demand. For example, the measurement interval can be selected to be 30 kilometers, 40 kilometers, or above 40 kilometers, according to longitude, latitude, altitude, and surrounding ecological environment of the region of interest. In order to save human and material resources we can make full use of old roads in this region, on which we can select some representative measuring points. Compared to local smart sensor network, due to the poor measurement environment and long distance communication, it is a challenge for the large scale distributed measurement of PST.
To be economical and practical, wired communication is obviously inappropriate because of the long distance, large scale, and distribution features of the measurement of PST. In contrast, wireless communication is reasonable choice. There are many wireless communication technologies available, such as ZigBee, WiFi, Bluetooth, GPRS, and satellite communication technology. ZigBee, WiFi, and Bluetooth are of short distance wireless communication. On the other hand, satellite communication is too expensive though it can satisfy the requirements of long distance, large scale, and distribution communication for PST measurement. So these kinds of communication could not be used in this paper. GPRS is a packet oriented mobile data service on the 2G and 3G cellular communication system's global system for mobile communication, providing support for end to end and wide area wireless IP connection. GPRS is very suitable for the application of frequent transmission of a small amount of data, with the advantages of real-time online, billing according to data traffic, fast log-in, and high speed transmission. GPRS can be used in NCAP, as a networking tool, because GPRS devices can be seamlessly connected to the internet. So GPRS technology is adopted in the application system of PST measurement in this paper.
There are mainly three schemes for networking between GPRS devices and central server. A schematic diagram of GPRS network schemes is shown in Figure 1. The first is public static IP scheme. In the first scheme, GPRS data transmission terminal initiates connection to the central server which has a fixed IP address. It establishes the communication between the two sides according to the fixed IP address and related port number. This scheme is reliable and stable, but the cost of applying the fixed IP address is large. The second one is domain name resolution scheme. A domain name should be applied for the central server from domain name service (DNS) providers. And the central server has access to the internet through asymmetric digital subscriber line (ADSL) broadband service and gets a dynamic IP address which should be reported to DNS server. GPRS data transmission terminal initiates the connection to DNS server according to the domain name of the central server and then accesses the IP address of central server through the service provided by DNS server. The system stability of this scheme is limited by the stability of DNS server. The third scheme is called access point name (APN) special network scheme. Namely, the central server accesses the mobile internet through dedicated router and an APN special line of 2 M bandwidth, using mobile internal fixed IP address. Within the special line a Remote Authentication Dial-In User Service (RADIUS) server should be established; that is, only the users who passed the authentication can have access to the special network. And an end to end encryption is applied to the communication between the users and RADIUS server to ensure the user's communication security. The third scheme is better than the other two in terms of real time, stability, and security. But it is also much more expensive than the other two schemes. In addition, in these three network schemes the central server may access the network through wireless modems at the server sides. But this wireless way is not used in this paper, because it is not as stable as wired way. Considering the stability, reliability, and cost of the system, the first GPRS network scheme is adopted in the smart sensor network for the distributed measurement of PST in this paper.
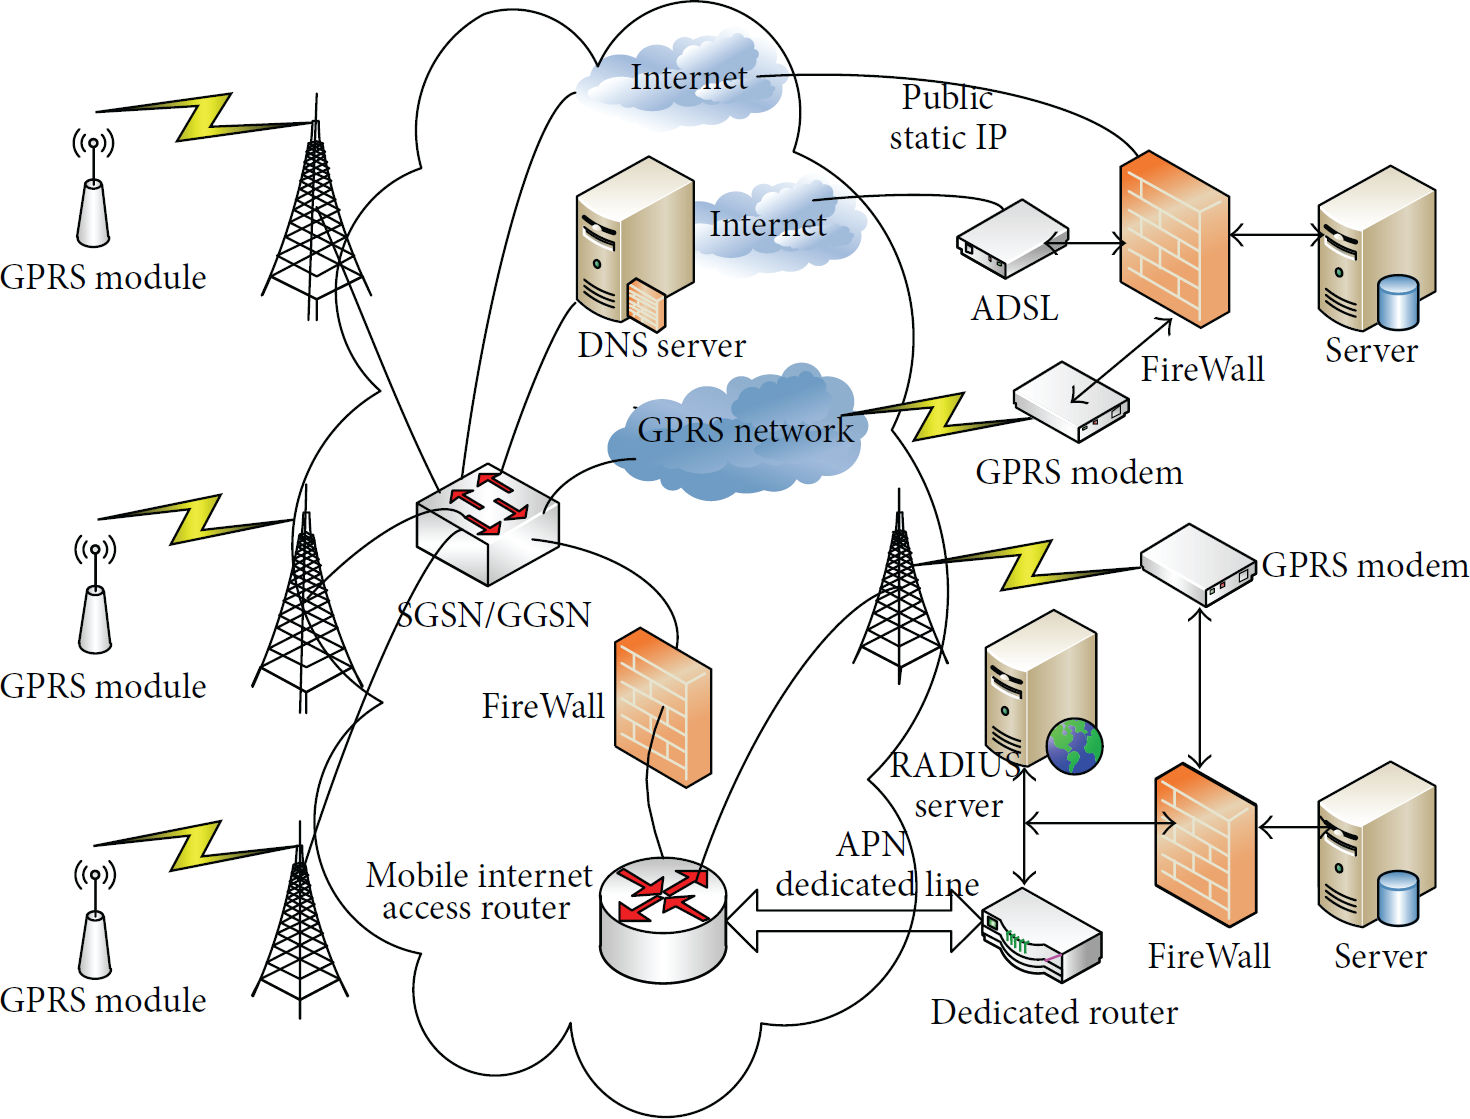
Schematic diagram of GPRS network schemes.
According to the above analysis, the system network architecture shown in Figure 2 is proposed. It satisfies the demands of long distance communication, long-term, and real-time data acquisition and remote data access for the distributed measurement of PST. The system network comprises two parts. One part is the smart sensor network based on ISO/IEC/IEEE21451 series standards for distributed measurement of PST. The other is a network of distributed human-computer interaction and management information system. The smart sensor network is a star network consisting of some smart sensor subnodes and a main node, realizing the collection, transmission, and storage of PST. The network between the subnodes and main node adopts the public static IP address scheme discussed above. The main node and subnodes communicate with each other using client/server (C/S) communication mode. Each field data acquisition device for PST measurement, as a subnode in the system, realizes the client function in the C/S communication mode. The main node in the star network is actually a software program installed in the central server, realizing the server function in the C/S communication mode. The network of human-computer interaction and management information system can also be viewed as a star network which is composed of browser users and a data query website. The data query website is the main node in the star network, providing web service for PST data query to users. Each browser user is a subnode in the star network which communicates with the main node using browser/server (B/S) communication mode. Users can initiate the access to the website by the web service, using a browser connected to the internet, so as to realize the information query and management of PST. The SQL database in Figure 2 is the common part of the two star networks. In the smart sensor star network the database is used to store the PST data, while in the human-computer interaction star network it is used to provide queried data. The two star networks are independent of each other in the system. The system architecture proposed in this paper makes full use of the internet and GPRS public network resources. Basically, China has a comprehensive internet and GPRS network infrastructure. As a result, the distributed measurement of PST can be widely used, not subject to time and space constraints.

System network architecture.
3. Networked Smart Sensor Node Hardware Implementation
Smart sensor node is the basic component of the smart sensor network and is the most front end of the distributed measurement system of PST. According to the application environment and characteristics of the distributed measurement system of PST, the hardware block diagram of the smart sensor node based on ISO/IEC/IEEE21451-1 and ISO/IEC/IEEE21451-2 standards is proposed and shown in Figure 3. It is composed of three parts: power supply system, NCAP, and STIM.

Block diagram of the proposed smart sensor node.
In order to adapt to the poor working environment (fieldwork, unattended) of smart sensor node, an autonomous power supply system is presented. It can provide a 12 V DC power supply for the system. The power system consists of solar panel, battery, and solar power controller. During the daytime, under the action of photovoltaic effect, solar panel generates current which charges the battery under the control of the solar power controller. No matter in the daytime or at night, the battery provides a stable 12 V DC power supply for the load under the control of solar power controller. When the battery voltage is too high (or too low), the charging (or discharging) will be stopped by the solar power controller so as to prevent the overcharging (or overdischarging) for the battery. The autonomous power supply system makes full use of solar energy and can provide a power supply for the smart sensor node continuously. Thus the problem of power supply for the system in unattended fashion has been resolved.
The NCAP mediates between the STIM and smart sensor network and provides local intelligence. So it should have the function of network, CPU processor, and interface with STIM on hardware implementation. As shown in Figure 3, NCAP consists of network interface circuit, CPU processor, transducer independent interface (TII), and power conversion circuit. The GSM/GPRS integrated chip SIM900A is selected as the wireless network interface chip, by which the NCAP can achieve seamless connection with internet. SIM900A is a dual-band GSM/GPRS engine that works on frequencies of EGSM 900 MHz and DCS 1800 MHz. It comes with embedded TCP/IP stacks. It can realize self-initialization, automatic connection with internet, and transparent data transmission at receiving corresponding AT commands. The peripheral circuit of SIM900A is composed of SIM card, antenna, communication circuit with CPU, and state indicating circuit. The ARM chip STM32f103ze which is produced by STMicroelectronics is used as the processor CPU in the system. Its peripheral circuit is composed of watchdog circuit, RS3232 interface circuit, NOR flash memory circuit, JTAG interface, and communication interface circuit. Power conversion circuit converts 12 V power supply provided by autonomous power supply system into 5 V, 4 V and 3.3 V power supply. CPU and its related circuits use 3.3 V power supply. SIM900A and its related circuits use 4 V power supply and TII uses 5 V power supply. Picture of NCAP is shown in Figure 4.

Picture of NCAP.
STIM is actually the controller of sensors or actuators connected to it, facing directly objects to be measured or controlled. And STIM is controlled by NCAP module by means of a dedicated digital interface called TII. The picture of STIM is shown in Figure 5. The STIM for the PST measurement is composed of CPU, temperature sensors, watchdog circuit, real-time clock, JTAG interface, power conversion circuit, and TII. ARM chip STM32F103VE is used as the CPU processor. The one-wire digital temperature sensor DS18B20 produced by Dallas Semiconductor Corporation is used in this paper. Its interface is very simple. Unique one-wire interface only requires one port pin to realize the two-way communication with the processor. It does not need signal conditioning and amplifier circuit. It has an operating temperature range from −55°C to 125°C and is accurate within ±0.5°C over the range of −10°C to +85°C. The DS18B20 digital thermometer can fully meet the system measurement requirement. The picture of STIM is shown in Figure 5.

Picture of STIM.
TII is the interface connecting STIM and NCAP. TII is a 10-line interface compatible with the ISO/IEC/IEEE21451-2 standard. The transducer interface lines connecting STIM and NCAP fall into four groups: data line, triggering line, support line, and interrupt line. DOUT, DIN, DCLK, and NIOE are data lines. NTRIG is triggering line. NINT is interrupt line. And the rest, POWER, COMMON, NACK, and NSDET, are support lines. The physical lines of the TII are described briefly in Table 1. From Table 1 and Figure 3, the external power supply is provided by POWER and COMMON lines. DOUT, DIN, and DCLK three lines use the serial interface SPI1 of STM32. And the rest of signal lines use the GPIO pins of STM32. Except for the POWER and COMMON two lines, the rest of signal lines use level conversion circuit to make themselves conform to the nominal 5 V dc CMOS logic.
Definition and function of TII.

4. Software Implementation of Smart Sensor Node
ISO/IEC/IEEE21451-1 and ISO/IEC/IEEE21451-2 two standards are adopted in the software implementation of the NCAP. The STIM adopts ISO/IEC/IEEE21451-2 standard in software implementation. The system software function block diagram is proposed in this paper and shown in Figure 6. As seen from Figure 6, the system software implementation of smart sensor node includes the software implementation of subnode NCAP, main node NCAP, and STIM.

System software function block diagram.
The subnode NCAP mainly achieves functions of two aspects: control of the STIM and communication with the main node NCAP. As shown in Figure 6, the software of the subnode NCAP is mainly composed of the underlying driver of STM32F10x, uC/OS-II operating system and implementation of IEEE1451.1 object classes, tasks, interrupt, and on-chip software of GPRS module. uC/OS-II operating system provides multitasks operating environment. These IEEE1451.1 object classes are the concrete software implementation of the ISO/IEC/IEEE21451-1 standard under the uC/OS-II operating system and STM32 hardware platform. These tasks and interrupts are the concrete implementation of the whole function of the subnode NCAP. GPRS on-chip software, with embedded TCP/IP protocol, plays a role of client in the underlying C/S communication mode. According to the IP address and port number of the main node NCAP, it can initiate the communication connection with the main node NCAP which plays a role of server in the underlying C/S communication mode. The subnode NCAP can realize the transparent data transmission by transmitting related AT commands to GPRS module. There are four tasks in the process of subnode NCAP: starting task, STIM discovery task, NCAP communication control task, and system measurement control task. STIM discovery task determines the hot-swap of the STIM by detecting the high or low level of the NSDET line of TII. If it is low, it can be determined that STIM has been connected to the subnode NCAP. The subnode NCAP will control a relay to power on STIM with a +5 V power supply, through the POWER line of the TII. Then the subnode NCAP will read the data of Meta-TEDS, Channel TEDS, and Calibration TEDS and change the frequency of DCLK line of the TII according to the content of Meta-TEDS. In contrast, it can be determined that STIM has not been connected to the subnode NCAP. System measurement control task achieves the acquisition and local storage of PST data by the control to the STIM. It reads the real-time clock repeatedly. Every ten minutes, it will invoke sensor parameter's UpdateAll operation to control the acquisition and transmission of PST in the STIM. The temperature data obtained from the STIM will be numbered continuously and stored in the subnode NCAP local terminal. Then the task will inform the NCAP communication control task by a semaphore to transmit the data to the main node NCAP based on publish-subscribe communication mode. The main function of the NCAP communication control task is to control the communication processes between the subnode NCAP and the main node NCAP. These communication processes are based on client-server or publish-subscribe communication modes, which are defined in ISO/IEC/IEEE21451-1 standard.
The main node NCAP is actually a software program running on the server. Its main function is to control the communication with its subnodes and achieve the transmission and storage of PST data from subnodes. There are mainly three threads in the main node NCAP. One is the NCAP node discovery thread, another one is the NCAP communication control thread, and the last one is the database access thread. NCAP node discovery thread determines the presence of the subnode NCAP by publishing a publication whose PubSubKey is PSK_REQUEST_NCAPBLOCK_ANNOUNCEMENT. The database access thread is used to access the SQL database. The data coming from subnodes will be clarified and stored in the related data tables in the database. It will check the missing data according to the continuity of data number. If there is missing data, the thread will inform the NCAP communication control thread to ask the related subnode NCAP to retransmit the missing data based on client-server communication mode defined in ISO/IEC/IEEE21451-1 standard. The main function of the NCAP communication control task in the main node NCAP is also to control the communication processes between subnode NCAPs and the main node NCAP.
Client-server is a communication model defined in ISO/IEC/IEEE21451-1. The operation of asking for missing data by the main node NCAP from the subnode NCAP is accomplished in such a way of communication. Take this as an example to demonstrate the communication process of client-server model. In the main node NCAP, the database accessing thread searches for the numbers of missing data regularly. If some missing data numbers are found, it will inform the NCAP communication control thread via thread communication to start the client-server communication. This kind of communication happens between two objects. The one asking for service is the main node NCAP's IEEE1451_FunctionBlock object database_access_block (called client object), owning its IEEE1451_ClientPort object measurement_data_client_port (called client port). The service provider is the subnode NCAP's IEEE1451_FunctionBlock object database_access_block (called server object), owing the service operation read_flash_measurement_data (called target operation). According to the missing data number, the target operation reads the data stored in the local flash memory in the subnode NCAP.
Client-server communication is performed by the execution operation in the client side together with the perform operation in the server side. Its communication model is shown in Figure 7. From Figure 7, it can be divided into four parts according to the flow of information. Part one (refers to (1), (2), (3), and (4)) is the transmission of arguments to the server object. These arguments include server operation id, sever input arguments, a reference to sever output argument array, and target server object's object dispatch address. Part two (refers to (5), (6), and (7)) is the invocation of perform operation of the target server object denoted by target server object's object dispatch address in the server side. In the perform operation the target operation asked by client side is invoked according to the server operation id. Part three (refers to (8), (9), and (10)) is the return back of the output arguments of server side. Part four (refers to (11), (12), and (13)) is the data processing for the returned data from the server side.

Client-server communication model.
Publish-subscribe is another communication model defined in ISO/IEC/IEEE21451-1 standard. Its communication model is shown in Figure 8. Subnode NCAPs use this communication mode to transmit PST data to main node NCAP. Take this as an example to demonstrate the communication process of publish-subscribe model. From Figure 8, this kind of communication also happens between two objects. The one initiating the communication is IEEE1451_Dot2TranscucerBlock object measurement_transducer_block (called publisher object) in the subnode NCAP, owning its IEEE1451_PublisherPort object measurement_publisher_port (called publisher port). The other side of communication is IEEE1451_FunctionBlock object database_access_block (called subscribe object) in the main node NCAP, owning its IEEE1451_SubscribePort object measurement_subscriber_port (called subscriber port). When the subnode NCAP obtains PST data, the publisher object will encode them into the publication's contents and invoke the publish operation in its associated local publisher port. Using the network infrastructure, the publish operation results in the delivery of the publication to the subscriber side in the publication domain, with the publication key, publication domain, publication topic, and publication content marshaled into the on-the-wire format. On the subscriber side, the network infrastructure will demarshal the publication and deliver the publication to all the subscriber ports, when having received the publication completely. Then the subscriber port will check if the received publication passes the port's filter tests; that is, its domain, key, and topic match those of the subscriber port. If it does, the port invokes the subscription callback operation. In this paper, within the subscription callback operation MeasurementPublication, the passed-in publication is decoded and the PST data is stored in database. And the publish-subscribe communication process has been finished.

Publish-subscribe communication model.
In this paper, the function of STIM is to accomplish corresponding actions under the commands of NCAP. So we use state diagram to demonstrate the function of the STIM. From Figure 6, after being powered on, the STIM enters the initialization state, in which the TII interface, real-time clock chip DS1302's control interface, and 9 DS18B20 sensors' control interfaces are initialized. After initialization the STIM enters quiescent state waiting for the triggering. If a triggering signal arrives on the BTRIG line of TII, the STIM enters the state of triggered. If the triggering signal is canceled in advance, the STIM will go back to quiescent state. Otherwise, the STIM will accomplish the whole triggering process over the two states of acknowledge trigger and remove acknowledge. Then it goes to the state of receive data in which the address data will be received first. A full address is 2 bytes long. One byte is functional address, the other is channel address. Given the functional address, the STIM can understand what kind of command required by the NCAP needs to be executed, such as reading one sensor, reading all the sensors, and reading or writing TEDS. The channel address identifies which channel the command is applied to. Channel address 0 identifies all the channels that are implemented, while other channels' address denotes a concrete channel. After analyzing the command, corresponding operations will be executed. Then the corresponding data will be transmitted back to the NCAP. And the STIM goes back to quiescent state. In this paper, the acquisition and transmission of PST re realized under the reading global transducers command.
5. Human-Computer Interaction
PST data can be easily transmitted to and stored in the database based on the ISO/IEC/IEEE21451 smart sensor network. But users cannot interact with these data conveniently. In order to facilitate the engineering technical personnel to view the PST data, a data query website based on B/S mode is developed. Thus, users can access the PST data conveniently using a browser connected to the internet. The block diagram of human-computer interaction website based on B/S mode three-layer architecture is shown in Figure 9.

Block diagram of human-computer interaction website based on B/S mode three-layer architecture.
From Figure 9, the architecture of the system architecture includes three parts: web layer, business logic layer, and data access layer. The function of the web layer is to receive the inputs from users and output the response of the system in the form of web pages. In this system, the web layer mainly includes user management pages, temperature data query pages, and PST distribution curve display pages. Through the web layer, users can observe the distribution and change trend of the remote PST in real time using a browser connected to the internet. The business logic layer realizes all the system business logic, including the management of user information, the data query of PST, and the drawing of PST curves. Data access layer achieves the access to the database. Through data access layer, the system can realize the reading of PST data and the addition, modification, and deletion of the user information tables. The human-computer interaction system is developed on the platform of ASP.NET2.0 and SQL Server2005.
6. Engineering Application of the Distributed Measurement System
Qinghai province is located in China's western region and is part of the Qinghai-Tibetan Plateau known as the rooftop of the world. The average elevation of Qinghai is 3500 meters above sea level. The highest elevation is 6860 meters and the lowest elevation is 1650 meters. Qinghai has a plateau continental climate, with characteristics such as low temperature, large temperature difference between day and night, less and concentrated rainfall, long sunshine, and strong solar radiation. These altitude and climate characteristics of Qinghai have a great impact on the PST distribution and pose a great challenge to the road construction in this region. China research institute of highway ministry of transport used the distributed PST measurement system based on ISO/IEC/IEEE21451 smart sensor network to do research on the distribution of PST in this region. Eight preliminary test road sections are selected. Take a typical section as an example to illustrate the installation and use of the distributed PST measurement system. Engineering personnel selected a 400-meter-long section in a 50-kilometer-long asphalt road. Half of the section is constructed to be cement test road and the other half is constructed to be asphalt test road. In this way we can compare the difference of the distribution of PST of cement road and asphalt road that are located in the same geographical environment and under the same weather conditions.
The test road section is located in Maduo county, Qinghai Province, with an altitude of 4300 meters. Both the asphalt test road and the cement test road are selected to be three-layer pavement structure. Their concrete structural characteristics are shown in Tables 2 and 3, respectively. Two ways of installing temperature sensors can be selected. One way is to cut the test road whose construction has been finished to required depth using cutting machine and then install the sensor to corresponding location. The other way is to install the temperature sensors to required depth in the construction process of the test road. The latter way is adopted in this paper. The asphalt test road was arranged in 8 temperature sensors among which the number of sensors in pavement, cement stabilized macadam base, bedding course, and below the bedding course was 4, 1, 1, and 2, respectively. There was also one temperature sensor used to measure the air temperature around the asphalt test road. Same as the asphalt test road, there were also 8 temperature sensors used to measure the PST of cement test road and one sensor used to measure the air temperature around the cement test road. The layouts of temperature sensors in the test roads are shown in Figure 10.
Pavement structure of asphalt test road.

Pavement structure of cement test road.


Layouts of temperature sensors (marked red color) in test roads.
The temperature in the region where the test roads located can reach minus tens of degrees centigrade in winter. In order to reduce the impact of harsh environment on the measurement system and ensure the reliable operation of the system, it is required to bury part of the equipment into ground. Thus, the system can avoid the impact of the high temperature in summer and the low temperature in winter. The control system and battery are installed in the cement nest located one meter below the ground. And we need to do a good job of waterproof and dry processing. The solar panel is installed on a tower fixed on the ground vertically, with its surface facing the south and forming an angle of 45 degrees with the horizontal direction. Thus the maximum photovoltaic effect can be obtained. Picture of field use of subnode is shown in Figure 11.

Picture of field use of subnode.
After the distributed PST measurement system has been installed, and the main node NCAP program has been started, the PST data will be automatically acquired, transmitted, and stored in the database under the action of the ISO/IEC/IEEE21451 smart sensor network proposed in this paper. Using the internal information service (IIS) manager in the sever to start the human-computer website based on B/S three-layer mode, authorized users can access the PST data through a browser connected to the internet.
Figure 12 shows the changing curves of PST of asphalt test road queried through a browser. The horizontal axis is time axis, with corresponding time from December 5, 2014, to December 10, 2014 (six days). The vertical axis is temperature. As shown in Figure 12, the nine temperature curves are the data curves of the nine sensors installed in the asphalt test road shown in Figure 10. From Figure 12, the PST changes along an analogous sinusoidal curve whose heating time is shorter than cooling time. The period of the curve is 24 hours, and amplitude changes with the change of weather conditions. In one period, with the increase of depth, the lag time of PST increases gradually, while the amplitude of the curve gradually decreases and eventually approaches a stable state. In the shallower position the shape of the PST curve is more similar to the shape of the air temperature curve. This is because the shallower the depth is, the bigger the influence by the solar radiation and atmospheric temperature is. The shallower the depth is, the greater the local fluctuation of the PST curve is. The deeper the depth is, the smoother the PST curve is. This is mainly because the nearer it is to the road surface, the greater the PST is affected by the environmental conditions such as wind, rain, and snow. When the depth exceeds a certain threshold the PST almost becomes a straight line, and the seasonal temperature is the main factor that affects its temperature.

PST curve of asphalt test road.
Figure 13 shows the PST curves of the cement test road. From Figure 13, the PST curve at certain depth of the cement test road is also an analogous sinusoidal curve similar to PST curve of the asphalt test road. From the comparison of the ninth curve of the cement test road and the asphalt test road, we see that the shape, the amplitude, and the local fluctuation of the two curves are almost the same. This demonstrates that the influence of the environment on the two test roads is the same since the two roads are next to each other. On the other hand, it also shows the consistency of sensors and the validity of the measurement data. From the comparison of the eighth curve whose sensors locate in the same depth, we can find that the peaks of the curve of the asphalt test road are much higher than those of the cement test road and the troughs of the curve of the asphalt test road are slightly lower than those of the cement test road. This is because the heat absorbing capacity of the asphalt concrete is higher than that of the cement concrete.

PST curve of cement test road.
In addition, users can obtain the average value, the maximum value, and the minimum value of the PST and can also obtain the changing rate value (per hour) and the maximum and minimum value of changing rate of the PST through the website. The question of how to use the PST data during the construction and maintenance of roads is left to the technical personnel of civil engineering.
7. Conclusion
On the basis of fully analyzing the measurement environment of PST, an ISO/IEC/IEEE21451 smart sensor network for distributed measurement of PST is presented in this paper. The proposed system is a star network, comprising some wireless smart subnodes connected with PST sensors and main node which is a software program running on the central server. The smart sensor node in this paper is composed of NCAP whose network interface is a GPRS module, STIM whose interface with NCAP is TII, and autonomous power supply system based on solar energy. The human-computer interaction network presented in this paper is also a star network, composed of some browser users seen as subnodes and a human-computer interaction website based on B/S mode which can be seen as a main node. Authorized users can access the PST data through the human-computer network using browsers connected to the internet. The proposed system makes full use of public resources such as internet and GPRS network. The proposed system has been used in the experimental study of PST on asphalt and cement roads. The experimental results demonstrate that the system can adapt to the distributed, fieldwork, and unattended measurement context of PST. The validity and reliability of the system have been verified.
Footnotes
Competing Interests
The authors declare that they have no competing interests regarding the publication of this paper.
Acknowledgments
The research was supported by National Natural Science Foundation of China (61273165), the Basic Research Foundation of Beihang University (YWF-4-ZDHXY-13), and the Project “Research on the Quality and Safety Intelligent Process Control and Remote Monitoring Technology of Highway Engineering” (2011318223710) funded by the Ministry of Transport, China.