
Abstract
With the emerging concept of smart grid, a customer's building facility is able to consume, generate, and store energy. At the center of the facility, an energy management system is required to perform an efficient energy management and to enable smart grid interoperation. However, the existing EMS is designed only for the management function and does not support the interoperation. To resolve the issue, this paper designs the interoperation function and proposes a new EMS model, named Premises Automation System (PAS), that also inherits the existing management function. To identify functional requirements, we bring out four design aspects out of energy services. Then, we design two categories of interoperable energy services to achieve customer interoperation. To demonstrate the feasibility of PAS, we implement and deploy a testbed in a campus. We conduct experiments with a microgrid scenario and present interesting measurements and findings.
1. Introduction
Smart grid is a nationwide project to modernize the 100-year-old power infrastructure by integrating the state-of-the-art information technology for two ultimate goals: (1) balance the power demand (consumption) with the supply via active interoperation amongst energy resources and (2) accelerate the use of environment-friendly renewable energy sources.
In the smart grid context, building facilities, including industrial, commercial, and residential sectors, have been primary energy consumers; they consume 72% of total energy in the US [1]. In the future, the facilities will be capable of generating and storing energy with potential inclusion of Electric Vehicles (EVs), solar panels, and batteries. To manage such complicating energy resources, research community has developed an intelligent energy management system (EMS). Its eventual goal is to maximize energy efficiency in a building and to minimize the electricity cost by making the best use of energy resources available in a building. To this end, the EMS communicates with individual building equipment to collect its energy data and to control them separately: fine-grained management. The EMS, then, analyzes the data collection so as to detect any inefficient building operations and failures.
From the smart grid perspective, the customer's building facility becomes the most important entity to interoperate, as its energy capability (demand, generation, and storage) dramatically increases. For instance, when the bulk power source confronts shortage of power supply, the customer is able to reduce current power consumption, which can prevent blackouts. The EMS in the facility is required to support such smart grid interoperation by enabling customer energy resources to interact with other systems outside the facility. However, the existing EMS has been designed as a standalone system without any consideration of the interoperation aspect.
To resolve the issue, we propose a new design of EMS, named Premises Automation System (PAS). PAS aims at accommodating both the customer need of efficient energy management and the grid need of customer interoperation. To address the customer need, PAS inherits fundamental design issues from the existing EMS model. It connects to customer energy resources that use heterogeneous communication protocols and technologies and manages them in a fine-grained manner. To address the grid need, we first review existing and potential energy services that realize the customer interoperation and then classify them into two categories: grid service and customer service. In a grid service, the customer facility receives and consumes service data delivered from smart grid, while the facility provides service data to the grid in a customer service. For each category of service, we examine functional requirements of the EMS in the four aspects of service data type, communication interface to realize the service, required intelligence (data processing and knowledge generation), and security and privacy.
To demonstrate the feasibility of PAS, we develop and deploy a testbed in our campus. In the testbed, PAS connects to and manages various types of energy resources, consumes an automated Demand Response service, generates valuable energy forecast data, and provides energy services to smart grid based on the proposed service model in a secure manner. We run experiments to evaluate these functionalities under a microgrid scenario and illustrate interesting measurements and observations.
The rest of the paper is organized as follows. Section 2 describes smart grid and its interoperation with customer facility. It also introduces four aspects to consider in the design of smart griddable EMS. Section 3 proposes the PAS design that addresses fine-grained energy management, grid energy service, and customer energy service. The PAS testbed is implemented and illustrated in Section 4, which is followed by experiments with the microgrid scenario in Section 5. Finally, we conclude the paper in Section 6.
2. Smart Grid and Customer Interoperation
2.1. Smart Grid
Smart grid aims at making the existing power grid more intelligent and interoperable by allowing bidirectional flows of information and electrical power. By integrating the state-of-the-art information and communication technologies to the power infrastructure, energy resources with embedded sensors generate valuable data that is, then, shared with all other resources in smart grid. Such information flow enables smart grid to monitor status of power generation and consumption accurately and respond quickly to potential failure. Smart grid also allows a bidirectional flow of electricity, compared with today's power grid-electricity flows from central bulk generators to end consumers. Various types of renewables can be installed on the consumers' side and supply power back to the grid reversely. On top of the information and power network, the operational goal of a smart grid system is to maximize interoperations amongst energy resources so as to balance the power demand with the supply, which eventually makes the power grid more reliable and sustainable. To facilitate the interoperations, National Institute of Standards and Technology (NIST) presents a conceptual model consisting of seven domains, each of which represents a high-level grouping of smart grid entities having similar objectives [2].
2.2. Customer Domain
In the conceptual model, the customer domain represents customer facilities (e.g., office, campus, and home) that consume more than 70% of total energy in the US. Traditionally, a building automation system controls facility equipment for the purpose of occupant comfort and optimal business operations. Today, the introduction of smart grid changes the customers' awareness and expectation about their energy management. They want to see breakdowns of energy usage and to take actions to reduce energy costs. Moreover, they are interested in instrumenting new types of energy resources like solar panel within the facilities. To meet the emerging customer needs, recent research on the customer domain has developed an advanced energy management system (EMS) to build a smart building. It performs fine-grained energy measurements and controls, say, at individual home/office appliance level. It optionally analyzes the collected data and controls equipment in a way to maximize the energy efficiency inside the customer facility.
Although the existing EMS research makes the customer facility more intelligent to satisfy the customer needs, it has barely taken the grid need of interoperation into consideration. As the customers' capabilities of energy consumption, generation, and storage increase, it becomes of the most importance to interoperate with the facility for the purpose energy balance in smart grid. And the EMS is expected to play a gateway role interconnecting the facility to other domains for the interoperation. Thus, the design of the EMS must be enhanced so as to enable customer energy resources to interact with other smart grid entities outside the facility, that is, supporting customer interoperation.
2.3. Customer Interoperation and Energy Service
Customer interoperation is an interaction of the customer facility with external domains in which the customer's own resources are engaged. Such interoperation is well realized by energy services, and we refer to a couple of literatures that present use cases of energy services [3, 4].
Design Aspects for Smart Griddable Energy Management System. The interoperable energy services are divided into two categories: grid service and customer service. In the grid service, a customer facility receives and consumes service data delivered from an external domain. For instance, the facility becomes a client of a service that a local utility company provides. In the customer service, the customer facility plays as a service provider, and external domains use facility's services as clients. Each category of service is characterized by four aspects that must be considered in customer interoperation:
Service data could be energy measurement, energy forecast, control message, conventional information such as weather forecast, and power price. Service interface enables interdomain communications under which there are three issues of interface abstraction, data representation, and interaction model. Intelligent unit performs interpretation of external data, knowledge generation, and decision making to take energy-related actions. Security addresses the most critical security concern at each category of energy service.
Taking these aspects into consideration, the following section designs a smart griddable energy management system, named Premises Automation System.
2.4. Related Works
Interoperation among heterogeneous systems in the smart grid field has been one of the most critical engineering problems and many research ideas have been proposed. While researchers have addressed and evaluated excellent interoperation models, few of them verify the feasibility of their models throughout experiments on real world testbeds and extensive data analysis. Warmer et al. [5] discuss the potential of Service-Oriented Architecture (SOA) in an emerging smart house environment. Authors see the Internet and web services as the key to enable the interaction between the house with its smart devices and the supply companies and electricity service operators to exchange supply bids and Demand Response (DR) related data. They insightfully summarize the concept of how web services drive radical changes in the energy system. Morvaj et al. [6] develop a simulation model for analysis of interactions within an envisioned smart city in order to demonstrate basic features of several smart houses. The proposed model acts in accordance with expected behavior, according to current and future features of smart grid including utilization of renewables, energy control on demand and supply side, and price-based signaling. Patti et al. [7] present the design and implementation of a service-oriented infrastructure composed of a middleware, a database, and a network interface layer for public space monitoring. The proposed scheme highlights providing an effective and hardware independent user interface. For interested readers, we refer to a survey paper [8] that reviews architectures and concepts for intelligence in future electric energy systems.
3. Premises Automation System
This section examines the design issues of PAS under two service categories. We also investigate issues on the management of customer energy resources so that PAS satisfies both the customer needs and the grid needs. For better understanding, we illustrate a system architecture in Figure 1.

An information system architecture around the customer domain, including PAS, a premises network, energy resources, external domains, service providers, and energy services. This figure does not show the electricity flow.
3.1. Management of Customer Energy Resources
PAS, as an energy management system, must be able to manage internal energy resources. This subsection briefly discusses two fundamental issues.
3.1.1. Accessing to Heterogeneous Energy Devices
A customer facility consists of a number of pieces of building equipment (energy resources) from various vendors. They often use proprietary data formats, contexts, and communication protocols, and PAS must cope with such heterogeneity to make all the energy data generated within a facility understandable in a unified manner.
To address the issue, many organizations recommend using standardized data representation models. Examples include ANSI C12.19 data model for smart meters [9] and ZigBee Smart Energy Profile (SEP) in the home area network context [10]. However, most legacy systems still generate data in the proprietary format. PAS must be able to handle and transform such data into a standard format. Standardization efforts touching this issue include Facility Smart Grid Information Model (FSGIM) [11], Open Building Information Exchange (oBIX) [12], and Web Service for Building Automation and Control Networks (BACnet/WS) [13]. In academia, researchers have developed programmable APIs that allow us to access customer energy resources in a unified manner [14]. Haggerty et al. [15] leverage the SensorML scheme [16] and define a data model that fits to tiny sensor devices embedded into energy resources.
3.1.2. Fine-Grained Measurement and Control
Energy resources in the smart building are equipped with embedded systems, and PAS gathers detailed information from them. Such information includes power usage, status of the resource, and availability of load shedding and shifting. Fine-grained measurement benefits building management in many aspects. A building owner is informed of a breakdown of energy usage, which motivates him to take actions for energy savings. Detailed data can be further processed together with other sensory data, say from occupancy sensors, for more efficient building operations. PAS also controls the energy resources individually. Say, the building owner is required to reduce 50 KW of power for 2 hours. He does not want to stop the entire building operations. He would rather find unnecessary or less prioritized energy loads first and perform customized controls. A new type of energy resource also necessitates the fine-grained control. For instance, smart appliances such as washer and dryer are able to shift their operations, and an LED light adjusts its brightness levels.
Many smart building researches have been devoted to the capability of measurement and control. Plug-load meters, which can do energy metering and control for plug-type loads, have been developed in projects [17, 18]. Bellala et al. analyze time series data of energy usage in a commercial campus, from which their algorithm detects anomalous usage periods representing unusual power consumption [19].
3.2. Grid Energy Service
3.2.1. Service Data and Communication Interface
In most grid services, smart grid sends conventional information data to the customer facility that, then, makes use of the information to trigger actions and to generate meaningful knowledge.
For instance, a Demand Response Automation Server (DRAS) provides a DR service by generating Demand Response (DR) event signals to notify customers of status changes on the power supply side [20]. Then, PAS accepts and understands the service signals, delivers event information to appropriate energy resources to control, and sends a DR event report back to the DRAS. Many standardization efforts have defined communication protocols for such grid services. Examples include Energy Interoperation (EI) [21], Open Automated Demand Response (OpenADR) [20], IEC Common Information Model (CIM) family of standards, and Weather Information Exchange Model (WXXM) [22]. The design of the service interface for the grid services is straightforward. To become a service consumer, PAS must develop communication counterparts of the grid services.
3.2.2. Intelligent Unit
It is imperative that PAS translates the contexts of the grid services into the semantics that are being used within the customer facility. Upon receiving a DR signal from smart grid, PAS may control a group of energy resources according to a preprogrammed rule. In this procedure, the most demanding intelligences in PAS are an accurate interpretation of the grid service data (DR signal) and a decision making of how new information affects the operations of energy resources. For instance, a DR signal in OpenADR can deliver different forms of information. It may include real-time power price, expecting the customer to react to the price change. He may decide not to change the building operations if the benefit of staying overwhelms the increased energy bill. The DR signal may deliver a specific amount of energy curtailment that the customer must be enforced. To respond to the signal, PAS curtails and/or shifts less critical energy loads so as to minimize impacts on building operations while satisfying the grid's requirement. Or, it may decide to use on-site generations.
Another intelligence required in PAS is to create new knowledge and service based on grid service data. Zhu et al. estimate energy harvesting by a solar array given a weather forecast [23]. Then, they develop a control algorithm that determines when and how much energy to store in a local battery storage to minimize the electricity bill. In [24], given EV owners' charging profiles and real-time power price, the authors develop a Vehicle-to-Grid (V2G) scheduling algorithm that works at a large scale EV charging structure.
3.2.3. Security
Most grid service data is open to public and thus is not often encrypted. Instead, message integrity is of the most importance. That is, it must be ensured that the messages are not tampered in transmit. For instance, a DR signal delivers the changes of power price over time that must be transparent by law. Altered price data, but, may mislead the customers' increasing energy consumption on emergency, which causes shortage of power supply and blackouts. PAS must take care of this issue.
3.3. Customer Energy Service
3.3.1. Service Data
In the customer energy service, the facility serves as a service provider to external domains. Unlike the grid service, PAS transmits data that is directly related to energy resources, which is classified as follows:
Energy measurement represents the instantaneous capability of power consumption, generation, and storage. In addition to current, voltage, power, and energy values, we include power quality data (e.g., reactive power) in this category. Resource status represents current status of an energy resource. In addition to simple on/off equipment, an LED light has two status types of brightness and temperature, whereas the status of a power storage is indicated by State of Charge (SOC) [%]. Command message is service data delivered from external domains to control a resource or to change its configuration. Energy history is a collection of historical data of energy measurement per each resource. Energy forecast is an estimation of future energy activity on each energy resource.
3.3.2. Service Interface
PAS provides service data to external domains via service interfaces. It also accepts messages that eventually change the status of energy resources. To this end, a couple of public reports mention an Energy Service Interface (ESI) as a gateway actor [2, 25], and Hardin defines it conceptually [4]. After examining it deliberately, we bring three fundamental design issues to help us determine what and how specific communication interfaces are implemented.
First, PAS must consider interface abstraction that determines the appropriate level of internal details that it exposes to external domains. High level of abstraction exposes internal business logics with less details, while low level of abstraction exposes more details of internal operations. A well-designed abstraction transmits only the necessary service data to external domains, while shielding them from changes occurring within the customer facility. Next, PAS must represent service data in a standardized format. To address the issue, smart grid takes a Canonical Data Model (CDM) approach. A data producer transforms its output to a standardized information model, and then a consumer transforms it back to its own terminology. Standard data models discussed in Section 3.2 can be good candidates for the CDM. Last, PAS must support efficient interaction models that determine how PAS communicates with external systems. Recently, a web service (WS) has been paid attention due to its interoperability and scalability. For instance, OpenADR specifies two types of bindings (SOAP and HTTP) and two types of message exchange patterns (PUSH and PULL). Recent literatures actively exploit the Representational State Transfer (REST) style [26] that defines data and service as an object and transfers the object's state via HTTP's methods.
3.3.3. Intelligent Unit
In the customer service, PAS is required to compute energy forecast. Since the facility is the most dynamic energy entity, predicting its energy activity is essential to achieve energy balance in smart grid.
PAS performs demand forecast. In the past, large customers such as manufacturing factories and tall office buildings consumed most customer power. But as power hungry equipment such as air conditioning and Electric Vehicle has been installed within smaller customer facilities, it becomes more difficult that smart grid estimates energy demand accurately. In this sense, an accurate demand forecast from each customer facility is necessary for smart grid to plan future power generation. PAS also performs generation forecast. Although the renewables in the customer facility represent clean energy sources, they still suffer from being variable or intermittent. As smart grid relies on them, such unpredictability may threaten the energy balance. Accurate generation forecast can mitigate the risk. Unlike demand and generation forecast, storage forecast is often computed from them today. But if the battery in an EV can be used as power storage in the future, storage forecast will be more meaningful service data and its computation will become more complicated as vehicles move around.
An analysis of big data collection of energy measurement, history, and forecast is recently attracting huge attention. But it does not necessarily contribute to customer interoperation, so we leave it as a future research.
3.3.4. Security
In the customer service, we primarily consider two security requirements, confidentiality and access control. First, the customer facility generates a huge amount of energy data that is highly likely to disclose personal identifiable information of the occupants. Since PAS transmits it to external domains via insecure public networks, a strong data encryption mechanism must be considered. Next, PAS in the customer service permits only authorized users to read customer data and to control energy resources. A new challenge in the access control is how to cope with fine granularity that the smart building pursues. Each customer facility will include a myriad of equipment and energy resources, each of which can be accessible by external systems individually. Moreover, an access for data reading must be distinguished from that for resource control. This would make the access control rules in PAS too complicated. An access control mechanism must also comply with the service interaction model. Unfortunately, the existing WS-Security resolves the integrity issue only [27].
4. Implementation of PAS Testbed
To demonstrate the feasibility of the design issues, we implement and deploy a PAS testbed. We deploy various types of energy resources and develop a PAS system running the required functions as shown in Figure 1.
4.1. Energy Resources
The energy resources considered in the testbed are smart submeter, plug-load meter, smart equipment, EV charging station, and solar panel. Some of them are pictured in Figure 2.
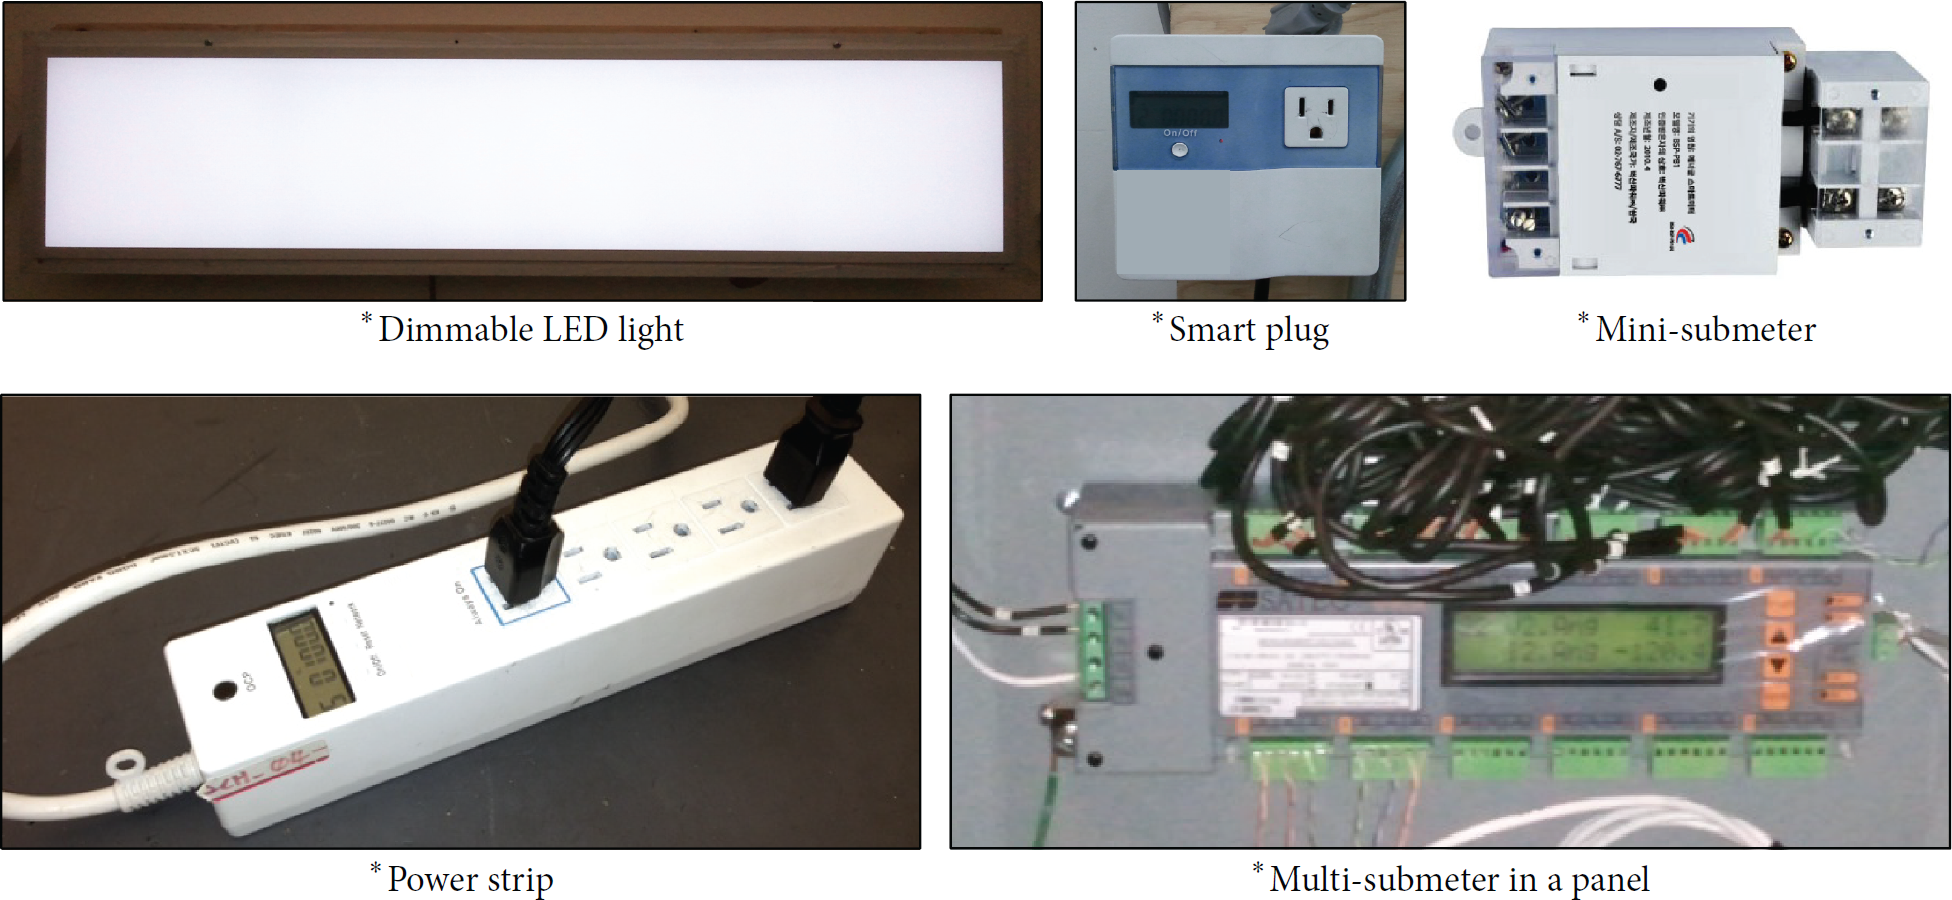
Energy resources in the PAS testbed.
Smart Submeter. Unlike a conventional smart meter that measures aggregated energy usage, a smart submeter provides fine-grained measurement and control. Our testbed deploys two types of submeters. We instrument a panel-level multisubmeter that simultaneously connects up to 36 single phase circuits within a panel [28]. Using it, we monitor two groups of energy loads, the lightings and power outlets at an office. We also install mini-submeters that are instrumented to single power lines [29]. It can directly connect to a light switch that turns on/off a set of fluorescent lights. These submeters use Current Transformer (CT) to convert current to voltage, and an embedded microcontroller calculates the real, reactive, and apparent powers and energy usage. They are also with relays, and the microcontroller switches the power upon requests.
Plug-Load Meter. As the plug-loads account for more than one-third of the total power consumption in a building [30], it is necessary to manage them carefully. To this end, we deploy two types of plug-load meters: smart plugs and smart power strips. Office appliances are plugged into them: computers, monitors, desk lamps, and network switches. The plug-load meter is functionally similar to a submeter, that is, energy measurement and control. It communicates with PAS using a ZigBee module. We note that ZigBee becomes one of the most promising technologies for wireless communications in a smart building system. The ZigBee protocol is patent-free and thus it costs low. ZigBee adopts collision avoidance schemes, providing communication reliability that is strongly required in wireless environment. It also allows ZigBee nodes to constitute a mesh topology, making the ZigBee network scalable.
Smart Equipment. Smart equipment represents such energy resources that must be accessed directly. Recent smart appliance, programmable thermostat, and LED light fall into this category. Each equipment has its own operation cycles beyond a simple on/off control and is able to adjust the operations upon external requests. The PAS testbed deploys dimmable LED panel lights that adjust their brightness and color temperature in 8 steps. Each light uses a ZigBee module to transmit its status and to accept control commands to/from PAS. PAS also connects to two types of smart appliances via the Ethernet: a clothes dryer and a refrigerator. PAS is able to change the strength of the heat (high, low, or no heat) as well as turn on/off the operation. The refrigerator adjusts the operating cycles of compressor, defrost, and fan. To measure energy usage, the mini-submeters are instrumented to their input power cables.
EV Charging Station. A number of charging stations have been deployed at campus parking structures in our sister project. A station powers several EVs via J1772 connectors simultaneously and supports multiple charging levels [31]. It is capable of measuring charging capacity as well as charging rate. Each station sends the charging data in real time to a management server in our laboratory that controls the stations based on subscribers' profiles and preference. PAS communicates with the stations via the server. Because of low penetration of EVs, however, we could not collect enough data for our experiments. As a complementary work, we simulate charging activities based on measurements and obtain ample amount of data.
Solar Panel. PAS also connects to a Photovoltaic (PV) solar panel. We are currently installing a new one on the roof, and, instead, this version of testbed implements a virtual panel that follows the same hardware specification of the real device. Our virtual resource obtains the real-time solar radiation data (GHI (Global Horizontal Irradiation), DNI (Direct Normal Irradiation), and temperature
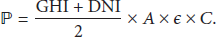
For voltage
Then, we pick
4.2. Intelligence
Resource Management. PAS maintains meaningful metadata regarding each resource. For instance, each mini-submeter is managed with a load type, location, and the load's priority. A resource owner configures the metadata, and thus the data keeps reflecting physical characteristics of the plugged load and user contexts. PAS also develops a control strategy. It prioritizes energy resources based on resource type, current status, criticality, and capacity and then determines groups of resources and corresponding control sets. Upon receiving a DR signal, PAS finds a predefined strategy corresponding to the DR event and executes the control set. PAS provides a scheduling function through which a user preschedules the operations of energy resources. The dimmable LED lights are now reserved to be ON only during office hours, while a user can still turn them on/off any time.
Forecasting. PAS performs both demand forecast and generation forecast on individual resource level. Among various forecasting models, PAS takes a persistence model for demand forecast. It estimates future demand fully based on historical data, which is highly effective in very short-term prediction, that is, one hour ahead. Due to its simplicity, it is widely used by public sectors. In particular, we extend a Customer Baseline Load (CBL) calculation that has been used by local utilities to calculate customers' curtailment on DR events. That is, given historical data over last 5 weeks, we put weights on the day and latest data and estimate the demand of the next hour.
For solar generation forecasting, PAS implements a hybrid model that integrates a persistence model and a statistical model to ensure high accuracy over both short-term and midterm predictions. As many articles recommend [33], hybrid models perform well in the time horizons ranging from 1 hour up to 36 hours, representing short- and medium-term forecasts, respectively. More specifically, our model takes Auto-Regressive Moving Average (ARMA) [34] as a mathematical model. The advantages of using the ARMA model and the persistence model are their simplicity, cost-effectiveness, and accuracy for timely forecasting. The purpose of the research is not to compete with a variety of solar forecasting tools that are academically or commercially available today, but to generate our own solar forecasting results using the simple, inexpensive, and effective methods, based on our campus environment, which can be extended for the laboratory-level microgrid.
The following equation describes the process to predict solar generation

4.3. Consuming Grid Service
Our testbed implements four grid energy services: DR, real-time pricing, weather forecast, and remote energy management. Due to space limitation, we describe two of them.
Open Automated Demand Response. We deploy an OpenADR 1.0 server that provides a DR service by exploiting the open source [36]. When a system manager issues a message, EventInfo, the server generates an EventState signal that represents a new DR event. It supports connections from both smart and simple clients. The smart client is capable of dealing with the EventInfo information within the EventState signal. Included in SmartClientDREventData entity, it contains event details. For instance, the eventInfoTypeID denotes an event type and takes one of values of
PAS implements both smart and simple clients and periodically “pulls” the EventState message from the DRAS. This PULL mode is often preferred over a PUSH mode, since the OpenADR client has more control over the communications, for example, firewalls. To address the security issue of the OpenADR, in particular the message integrity, we implement a Message Authentication Code (MAC) on top of the existing OpenADR. Following the NISTIR 7628 guideline [37], our testbed takes a hash-based MAC (HMAC) with SHA-256.
Power Price Forecast. Instead of using a Time-of-Use (ToU) tariff, PAS realizes a dynamic pricing mechanism by exploiting the wholesale market price provided by California Independent System Operator (CAISO) [38]. More specifically, PAS obtains three types of dynamic power price: Day Ahead Market (DAM); Hour-Ahead Scheduling Process (HASP); and Real-Time Market (RTM). The DAM provides an estimated power price of every hour for 24 hours ahead. The HASP and RTM provide an hour-ahead price estimation of every 12 minutes and 5 minutes, respectively. Our DR server also uses the same data as a unit power price for the DR service.
4.4. Energy Service Provider
Taking the design issues in Section 3.3, we implement the customer energy service.
4.4.1. Open Building Information Exchange
To follow the CDM approach, we take the oBIX specification [39], a standard to represent data in building information systems. Thus, external systems consume service data of the oBIX format.
The architecture of oBIX data representation consists of three principles: object model, contract, and XML syntax. First, the object model defines information of electrical and mechanical systems in a building as an object. Like the Object-Oriented Programming (OOP), each object is modeled by a set of value objects like “string” and “bool” and a set of op objects that defines an operation with input and output objects. Next, the object model allows inheritance to model complex energy data by means of a contract mechanism. Realized by is object, it establishes the classic “is a” relationship with various overriding rules. In this way, an object can represent not only a physical unit directly, but also a particular functionality as a collection of subobjects. Last, oBIX exploits XML to express its underlying object model. To this end, it specifies four syntaxes: each object type maps to one XML element; an object's children are mapped as children elements; the XML element name maps to the predefined primitive object type; and every other object is expressed as XML attribute.
With the principles, oBIX supports low level of abstraction. More precisely, the appropriate use of value and op objects determines the abstraction level of an energy object. This capability allows us to abstract energy services in a more flexible manner to satisfy various service requirements. Leveraging the oBIX specification, we implement data models at the lowest level. Example 1 represents a power object that contains power draw data of a smart plug.
Example 1
In a similar way, Example 2 illustrates a History object, a historical archive of a point's value over time. The is attribute in the obj element indicates that it is extended from a standard oBIX object obix:History. The example also shows that the query operation to read history records takes an argument whose object type is psxml:HistoryFilterEx and returns history records in the object of obix:HistoryQueryOut.
Example 2
4.4.2. Web Services
oBIX designs energy data in an object-oriented way. An interaction model is, then, required to map the object into an energy service. To this end, we implement WS that exposes service interfaces in an interoperable manner. In terms of WS, each energy object is accessed via a URI and passed around as an oBIX document. PAS implements the access methods via the HTTP binding in the REST style that realizes a resource centric access using a set of verbs.
More specifically, three request types in oBIX are mapped into HTTP methods: Read, Write, and Invoke. Read request uses GET for any object having href attribute and returns object data as an oBIX document. Write is targeting at an object having writable attribute and is implemented with PUT. Invoke supports operations on an object by using the POST method. An oBIX document is passed to PAS as an input in both Write and Invoke. In Example 3 the oBIX document represents a smart plug object, “plug1.” The ref tells the link to an associated subobject, “power.” The example also shows that the resource is controllable via two ways: Write and Invoke.
Example 3
4.4.3. Fine-Grained Access Control
Each energy resource distinguishes its values and operations, and web services expose them by implementing three actions to the resource. In this way, they realize “fine granularity of data access and resource controls.” For instance, a user accesses a Read interface to read energy usage of an air conditioning system, while he may turn it off via another interface. Fine granularity is a new challenge for the security mechanism, because different actions induce different levels of security violation.
To resolve the issue, we implement a fine-grained access control that executes authorization on the action level (i.e., Read, Write, and Invoke) [40]. It leverages the concept of a file system Access Control Entry. That is, each object maps to an attribute with three-digit privilege level. For instance, the object “plug1” is related to an attribute “plug1=111.” The first digit indicates permission of Read, and the following two digits indicate the rights of Write and Invoke, respectively. Each user maintains his own set of attributes in his private key. When the user tries to access the object by presenting his key having an attribute of “plug1=100,” he is permitted to read energy data, but not to change any values or control the energy resource.
5. Case Study: Microgrid
To evaluate the PAS testbed, we consider a microgrid scenario that we envision as a promising model of a customer facility that satisfies both the grid need and the customer need. From the grid perspective, microgrid is able to respond to the grid's signal, by reducing power consumption or by feeding power back to the grid in real time. From the customer perspective, it eventually pursues a Net-Zero Energy Building (NZEB) that can island the facility from a bulk power source by leveraging on-site generation. We run experiments to illustrate that PAS performs smart operations to achieve microgrid.
5.1. Fine-Grained Measurement and Control
Connected to various submeters and equipment, PAS can easily produce fine-grained measurement and execute individual resource controls. Since this paper focuses on customer interoperation, we omit graphs on simple measurements. Instead, this paper highlights an interesting experiment measuring the power quality of a refrigerator. Figure 3 illustrates a result on a randomly selected day. The reactive power and the power factor are computed by the phase difference (θ) between input voltage (

Reactive power and corresponding power factor on a refrigerator over 24 hours.
5.2. Knowledge Generation
For the demand forecast experiment, we train our persistence model with energy usage data of a smart power strip. A couple of office appliances are plugged into the strip. And two students come and go to use it to power their laptops. So, the usage pattern is more like irregular as shown in Figure 4(a). It consumes 95 Wh on average with max. of 286 Wh and min. of 26 Wh. The strip consumes energy more than the average for 294 hours out of 840 hours, which computes around 35% in the whole measurement. The standard deviation of the usage values is 40.45. Based on the training, PAS performs demand forecast for the next 24 hours as shown in Figure 4(b). The figure also draws bars representing real measurement in order to verify the accuracy of the forecasting. Our model forecasts energy demand of 90.2 Wh a day, but the strip consumes 97.8 Wh in real, which computes around 92.2% of accuracy. The highest accuracy appears at hour 13 with 97.6%, while the lowest one is 67.6% at hour 18.
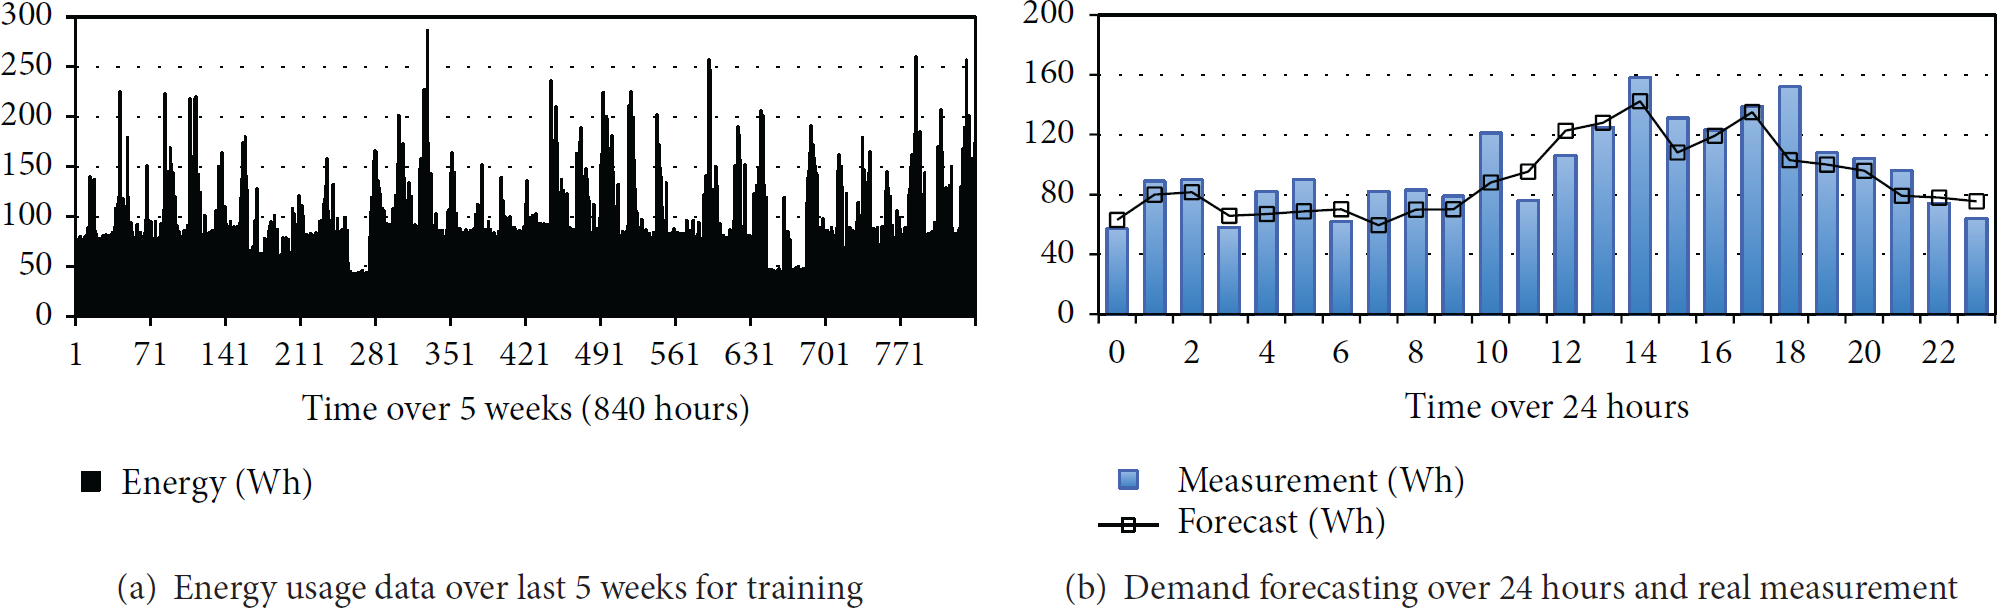
Demand forecasting of a set of energy loads.
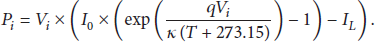
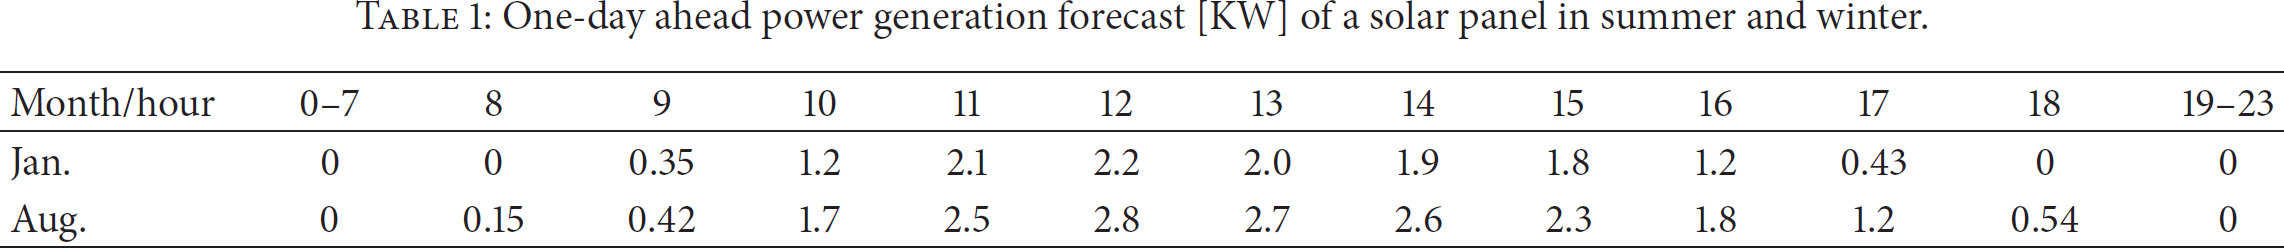
PAS performs a solar generation forecast using the ARMA model. The solar panel is fixed with an angle of 20 degrees, and its maximum capacity is 5 KW. The relationship among power, voltage, and current is as follows: maximum point voltage is 328 V; maximum point current is 10.58 Amp; open circuit voltage is 381 V; and short circuit current is 11.5 Amp. Table 1 shows two one-day ahead generation forecasts of the virtual PV solar panel in August 2012 and January 2013. During a winter day, the panel generates 13.2 KW of power for 10 hours with efficiency of 15.3%. In winter, it generates 18.7 KW of power for 12 hours with efficiency of 15.6%.
One-day ahead power generation forecast [KW] of a solar panel in summer and winter.
We measure the prediction accuracy through Mean Squared Error (MSE). For calculation, we take solar forecast data over one year from the ARMA model and obtain real measurement data from System Advisor Model (SAM) [41]. For comparison, we also implement a simple persistence model, run prediction, and compute MSE values. Figure 5 illustrates the error values [KW] over one year. Taking January as an example, the ARMA model shows better performance than the persistence model by 44.38%. The error in the ARMA model shows 0.0206 KW on average with max. of 0.028 KW in March and min. of 0.0121 KW in July.

Solar generation forecast: measure prediction error [KW] with 1 hour-ahead forecasting using MSE over one year.
5.3. Automated Demand Response: Real-Time Pricing
Next experiment runs a Real-Time Pricing (RTP) program in an Automated DR. A DR service manager acquires a power price forecast from a wholesale market in California. Figure 6 draws a curve of day ahead prices (DAM) over 48 hours. The wholesale market price is 41.7 [$/MWh] on average with max. of 54.27 and min. of 33.37 during the period. The manager, then, determines a retail market price based on the price and other factors. Say, a unit price is 4 [cents/KWh]. The star-marked line in the figure shows the changes of power price in the retail market. The DRAS takes the values and generates a DR event of the RTP program. Taking values on day 2 in Figure 6, the event starts at 7 am and lasts until 2 pm. During the event, the power price changes: it becomes 2 times, 3 times, and 2 times more expensive than the unit price. This event information is generated one hour before the event, so it is an hour-ahead DR program.

Smart grid interoperation: obtaining price forecasting from a wholesale market over 48 hours (from CAISO) and determining real-time power prices for a retail market.
Once PAS receives a DR signal and notices that the price goes up, it performs a predefined DR strategy. In this experiment, we register one LED light to our strategy so that the price change is seen through the brightness of the LED. As the price goes up, the LED gets dimmed proportionally. Since the power draw of the LED is proportional to the brightness level, we can easily observe the change of energy usage during the DR event.
5.4. Utilizing Distributed Energy Resource
Given the capabilities of both power generation and consumption, this experiment runs a simulation of a Battery Management System (BMS), showing that PAS manages an energy storage to achieve microgrid. To this end, we take our experimental data as shown in Table 2. Both the charging and discharging efficiency on the battery are 80%. That is, we lose 20% of power in the procedure of charging and discharging. The maximum SOC is 90%, that is, 22.5 KWh, while the minimum SOC is set to 20% (5 KWh). Whenever the panels generate power, PAS stores it to the battery. The energy loads draw power from the battery first. They use another source of power (e.g., from the grid) when the battery uses up the power stored.
Configuration for DER experiments. We measure data every 15 min.

Figure 7 illustrates the experimental results over 7 days (168 hours) in 2013. The square mark curve (blue) represents aggregated power generation by two solar panels: max. of 6,066.8 W and min. of 0 W. The star mark curve (red) represents aggregated power consumption: max. of 2,596.9 W and min. of 351.3 W. The solid line (black) represents the SOC of the battery that both the generation and consumption influence directly. Since the generation is usually greater than the consumption, the SOC often reaches to the maximum of 22.5 KWh. The panels generate 67.3 KWh of surplus power for 30 hours in total. On the other hand, the demand exceeds the power capacity of generation and storage from hour 100 to hour 103. This is mainly attributed to low power generation on day 4, which exemplifies the unpredictability of renewables.

Power generation, load, and battery SOC values.
6. Conclusion
To achieve the ultimate goal of smart grid, an EMS in the customer facility must satisfy both the customer need and the grid need. However, the existing EMS only considers an efficient energy management and does not communicate with other smart grid entities, which fails to achieve smart grid interoperation. To address the issue, this paper examined two categories of energy services that the EMS must support for customer interoperation. We designed the required EMS functions under four aspects of service data, service interface, intelligence, and security and then proposed a new EMS model, PAS. To illustrate the feasibility of PAS, we implemented and deployed a testbed in our campus. The testbed consists of a number of energy resources connected to PAS; data processing and service generation component; communication interface for service provision; and data protection mechanism. We ran interesting experiments on top of the testbed and demonstrated our measurements and findings. In the future, we will investigate further advancement of the EMS as a microgrid platform that can support an energy transaction.
Footnotes
Notation Description
Conflict of Interests
The author declares that there is no conflict of interests regarding the publication of this paper.