
Abstract
Node deployment is the key problem of wireless sensor network technology. For a directional sensor network, the perceived probability model reflects the quality of the network. The problem of the probability node deployment is too little of the distribution of the nodes asymmetrical. In this paper, we study the probability model of directional perceived nodes and propose an improved deterministic deployment algorithm based on particle swarm optimization to increase perceived probability. By analyzing the coverage probability of the monitoring area with different deployment models to obtain more serviceable environmental data of the monitoring areas, experimental results demonstrate that, compared with random deployment, sixteen percent is improved by the proposed algorithm.
1. Introduction
In recent years, with the rapid development of wireless multimedia technology, visual sensor nodes are receiving significant attention [1], which leads to the emergence of directional sensor network [2]. In order to ensure normal operation of the directional sensor network, the sensor nodes in internal target area need to deploy well.
The node deployment is the first step in wireless sensor networks [3]; it is directly related to accuracy, integrity, and effectiveness of the network monitoring information.
According to different methods of nodes deployment, wireless sensor networks can be divided into random deployment and deterministic deployment. When using directional sensing node for monitoring area coverage, it can be divided into Boolean model [4] deployment and probability model [5] deployment according to the node sensing model.
Most of the researches on directional coverage are focused on the Boolean model in random deployment. Gupta et al. [6] addressed the problem of optimal deployment in terms of the number of nodes required to achieve k-coverage in m-connected. The communication is the region over which a node can communicate with others. The object of study was omnidirectional nodes, and the characteristics of directional nodes are different from them. Li et al. [7] derived a variant of perceived direction of nodes and developed a node scheduling rule and distributed algorithm. In the three-dimensional space, Fan et al. [8] presented a distributed 3D localization scheme for an irregular wireless sensor network using multidimensional scaling. Greedy algorithm was proposed in [9] to solve the problem of random area maximum deployment. Sung and Yang [10] utilized the structure and characteristic of Voronoi cells and proposed a new solution for target tracking in visual/camera sensor networks. In [11], an observation correlation coefficient was developed to describe the correlations between images observed by cameras by studying the sensing model and deployment of cameras in the network and proposed a camera sensor activation scheme for target tracking in wireless video sensor networks. The aforementioned algorithms can adjust the location of nodes in random deployment but cannot be applied to deterministic deployment.
The Boolean model is an idealized model. In practical applications, sensor nodes have difficulty achieving full step type sensing; therefore, the probability model is more practical. The deployment of probabilistic sensing model mostly focuses on the random deployment. Jiang et al. [12] proposed a k-coverage distributed algorithm based on probability model to construct k working covers that provided probabilistic k-coverage for the whole target region. Li et al. [13] proposed a direction adjustable linear model, which was basic on the direction adjustable sensing model. A probabilistic sensing model for directional sensor node was designed in [14] based on the existing directional sensing models which were always affected by uncertain sensing ability on their edges of two sides. In [15], a node deployment scheme was presented based on the perceived probability model for the wireless network nodes which were randomly deployed. Sun et al. [16] proposed enhanced coverage algorithm to present the coverage probability of sensor nodes and the solution of expected values for coverage quality. The sector area formed when moving target nodes pass sensor nodes; it cannot be used on the fixed node deployment.
Random deployment is more economical and applicable; however, it cannot cover the monitoring region completely. It is generally applicable to the observation environment which does not strictly demand coverage. For a relatively fixed network status or application environment, node position information, and the node density which is known, the deterministic deployment commonly is used. Currently, there is less study about deterministic deployment of directional sensor. In [17], put forward a method for optimal deterministic deployment of target coverage. The target coverage does not guarantee the monitoring area to be covered completely. In order to obtain the integral monitoring information, area covering deterministic deployment should be investigated. Guo et al. [18] proposed a deterministic sensor node deployment method to use the least nodes to achieve the target coverage, using the least sensing probability with which a node can sense a target as the measure of the whole coverage level. The 0 and 1 were chosen as the limit of the perceived probability, respectively.
At present, little work has been done on probability model of deterministic deployment in area coverage of friendly accessible environment; the normalization algorithm cannot guarantee obtaining complete monitoring information when using probability model, so the study on the probability model of deterministic deployment has an urgent demand. In this paper, on the basis of satisfying the node communication, the deployment of probability perceived model of wireless image sensor node is investigated. In order to obtain effective quality information of the monitoring area, we optimize the limit of the perceived probability and provide an improved algorithm to improve the perceived probability.
The rest of the paper is organized as follows. In Section2, a probability coverage model is established. And a deployment method is selected in Section3. In Section4, the particle swarm optimization is introduced and an improved deterministic deployment algorithm based on the probability model is proposed. In Section5, simulation experiments are carried out and analysis of the main influencing factors is provided. Finally, analysis of the results is given in Section6.
2. Probability Coverage Model
The perceived probability model of directional sensing node [19,20] is usually defined in the two-dimensional space. The perceptive range is a sector with a node as the center and the perceived distance as radius as shown in Figure1. P denotes the position coordinates of nodes;

Nonrotating sector perceived probability model.
The mathematical expression of the monitoring probability of arbitrary point q in the sensing area is defined [21] as

3. Coverage Model
At present, there are two deployment methods that can achieve real-time complete coverage. One is the circular mode, which combines the sector sensing node into a circle. The other method is the tiled mode in which two relative nodes are a group and two nodes in the same position are a group as shown in Figure2.

The methods of deployment.
Circular mode can use regular coverage algorithm in the monitoring region. The circle which combined with directional sensing nodes was deployed in accordance with the equilateral triangle, square, rhombus, regular hexagon, and unregular equilateral hexagon deployment [22].
In the probability sensing model, to achieve the completely effective perception, single sensor node may not meet the demand. We set the threshold η, and when

For the monitoring area with

The pixels of monitoring area stack up to the sum of each pixel covered by

4. Proposed Algorithm
4.1. Particle Swarm Optimization
The particle swarm optimization algorithm was proposed by Kennedy and Eberhart in 1995, which is based on the social behavior of a flock of birds [25]. It is a new evolution algorithm. The algorithm flowchart is shown in Figure3.

The flowchart of PSO.
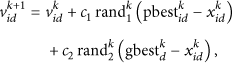
The dimension of the search space is D. Therefore, the position of particles in this space is given by a vector

4.2. The Regulative Algorithm of Deterministic Deployment
In order to obtain effective quality information of the monitoring area, it is necessary to increase the number of nodes for cooperative awareness. Furthermore, a regulative algorithm of deterministic deployment is presented.
The algorithm is composed of the following steps:
Divide the monitoring region into grid and calculate the number of sensors Initialize the increased node number Determine whether the minimum probability of each grid is less than the threshold probability η. If there is any numerical value less than η, Output the total number of the nodes in the monitoring area Let Compare Calculate Determine whether the increasing rate of the minimum probability of each grid is 0; if there is any increasing rate that is not equal to 0, jump to Step (6), otherwise output the results.
5. Simulation Results and Analysis
According to [26], when the value of the perceived angle is between 60° and 72°, circular deployment and tiled deployment have the same average overlap area. Therefore, in the experiments, the nodes were isomorphic in which sensing radius is 30 m, the range of communication radius is between 24 m and 60 m, the uncertain value
The number of the nodes according to radius proportion is presented in Figure4. The probability threshold η of different deployment methods is shown in Figure5.

The number of the nodes according to radius proportion.
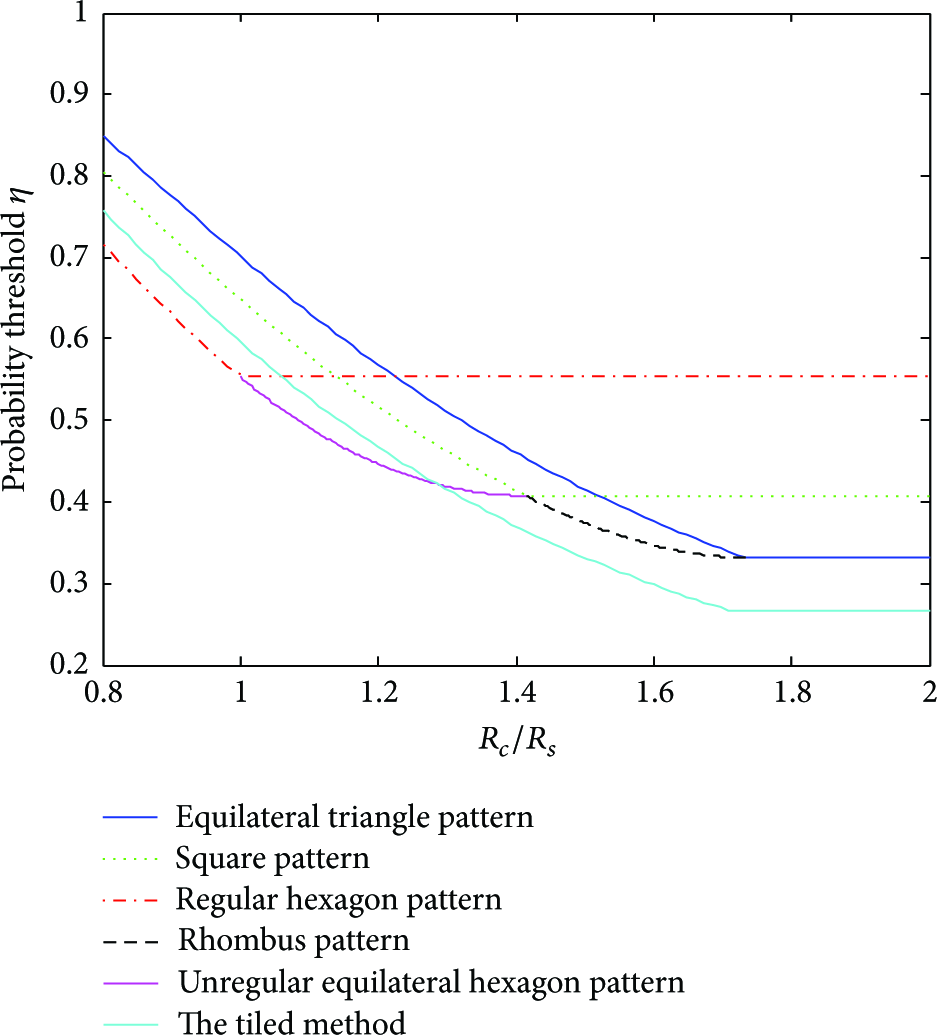
The probabilistic threshold according to radius proportion.
The perceived probability of the node to object is shown in Figure6. When the distance of object to node is less than 19.31 m, the perceived probability of the six deployment methods is the same, and when the distance is more than 19.31 m, the perceived probability in regular hexagon deployment mode is lasting 1; therefore, the regular hexagon deployment can achieve the Boolean model coverage (i.e., 0-1 monitoring).

The perceived probability according to different deployment.
According to the improved deterministic deployment algorithm based on probability model, the number of the nodes adjusted by probability threshold according to radius proportion is shown in Figure7. The regular hexagon deployment is greater than the threshold probability, which need not increase nodes. Under the condition of satisfying all the monitoring area which are perceived and nodes which can communicate with each other, when

The probability threshold according to radius proportion.
Adjust the position and direction of the node with PSO shown in Figure8(a), compared with random deployment, which is shown in Figure8(b); the proportion of overlapped area is small. When the increase amplitude of perceived probability is 0, the minimum perceived probability of improved PSO is 78.7%, and the initial deployment algorithm is 62.7%.

The comparison of nodes deployment.
For the same numbers of isomorphic nodes, the improved PSO algorithm optimized the probability threshold, according to the inductive characteristics of the probability model, updated the position of the nodes by judging the extremum, and improved the monitoring probability.
6. Conclusion and Further Work
This paper adopted the deterministic deployment of directional perceived nodes to achieve regional coverage. An improved deterministic deployment algorithm based on the PSO was proposed. The proposed algorithm is mainly used in the adjustment of the location and direction of the increased nodes to ensure that the coverage probability in the monitoring area is greater than the probability threshold, thus obtaining better monitoring information. According to the experimental results, the proposed algorithm improves the perceived probability compared with the initial deployment in the monitoring area and the coverage level of the regular hexagonal deployed is the highest. For the future work, we will focus on the convergence rate and positioning accuracy of the deployment algorithm.
Footnotes
Competing Interests
The authors declare that they have no competing interests.
Acknowledgments
This work was supported in part by project supported by National Natural Science Foundation of China (Grant no. 31300470) and project supported by the Fundamental Research Funds for the Central Universities (Grant no. 2016ZCQ08).