
Abstract
Network reliability of Wireless Sensor Networks (WSNs) is difficult to be evaluated because of its complexity, multistates, and dynamic characteristics. To satisfy the user's need of reliability evaluation for network transmission we propose some evaluation models and a dynamical evaluation framework. The evaluation models are mission-oriented and based on transmission paths (uplink and downlink). The dynamic evaluation framework can be on-demand customized and it will be autoupdated once the communication environment changes or the nodes fail. Finally, we simulated clustered and mesh WSNs with NS-2. Simulation result shows that the proposed evaluation framework was effective and accurate.
1. Introduction
Reliability of WSNs is strictly required in industrial intelligent monitoring, military reconnaissance, and so on. Reliability of data transmission determines whether the WSNs mission (e.g., measurement, monitoring) is successful or not. More accurate and effective reliability evaluation helps to make better selection of topology controlling and communication protocols for WSNs.
Generally, WSNs consist of numerous sensor nodes distributed randomly in a large-scale regional. Changeable communication environment and unexpected node failures dynamically affect WSNs. In addition, WSNs should complete a variety of missions during the operation. Therefore, it is difficult for fixed evaluation models to give a comprehensive evaluation of the reliability of WSNs.
Energy depletion or accidental damage will cause nodes failure. The failure of any one of the two ends will cause the link failure. Even if the node does not exhaust, communication may still be invalid because of multipath fading, interference, congestion, and other causes in the link between nodes. Communication not only has two states (normal and failure) but also has another state: multimode failures. Due to the above features, reliability evaluation of WSNs becomes a challenging problem.
2. Related Work
Most WSNs reliability assessments are based on graph theory and probability theory. Connectivity reliability [1–7] investigates the probability that the network is still connected for a given period of time under the case of some nodes or links failure. Performance reliability [8, 9] analyzes the end-to-end delay, packet delivery rate, and other network parameters. With the increasing of network scale, accurate analysis of network reliability has been proven to be an NP-hard problem in [10]. Therefore, many researchers propose approximate methods to calculate network reliability, such as graph transformation, delimitation, and network simulation. WSNs reliability is influenced by many factors such as component failure, environmental influences, task changes, and network update. These factors and network behavior are difficult to be described or calculated by mathematical models. Network simulation becomes an important method to analyze network reliability. Monte Carlo [7], Petri nets [5], Bayesian networks [11], and other simulation methods have been used.
WSNs have complexity, multistates, and dynamic characteristics. Existing assessment methods have three disadvantages. (1) Connectivity reliability and performance reliability are limited to the end-to-end perspective. However, there are a lot of redundant source nodes and different routing strategies in WSNs. Failure of a few nodes will not interrupt the network transmission. When monitoring the same event or parameter, the information collected by multiple source nodes is complementary and redundant in space and time. Packet delivery rate of single packet from end-to-end cannot accurately represent the integral transmission reliability of WSNs. Evaluating the reliability of WSNs from mission point of view can better meet the user's demand for business and services. However, it has not been paid enough attention, and there are many issues worthy of further research. (2) Most researchers focus on the reliability of uplink where the source nodes send the perceived information to sink. Reliability of downlink where sink sends the control information to the source nodes has not been paid enough attention. However, numerous studies show that loss of control message during the transmission has a significant impact on the control function. Severe cases may cause instability and collapse of the system [12, 13]. (3) The first step of Monte Carlo and stochastic Petri net modeling method is to generate random numbers which satisfy a certain distribution. The correctness of the choice of the distribution of random numbers needs to be tested. In case the inputted random number is different from hypothesis, the whole simulation (and its prediction results) may be wrong. In order to achieve the desired accuracy, the sample number of Monte Carlo sampling grows exponentially. Petri nets have the problem of “combinatorial explosion” in the face of a large and complex network.
Transmission is an important mission of WSNs, and the reliability evaluation from the perspective of transmission can better satisfy the need of network users. To provide a more effective and accurate evaluation for the transmission reliability in WSNs, this paper analyzes the transmission from two directions (uplink and downlink) and proposes a dynamic evaluation framework. The evaluation model proposed in this paper does not need to do a great amount of work to obtain the prior information. Evaluation data can be measured from the network. It avoids the energy consumption increased by the hypothesis test. Evaluation method proposed in this paper has obvious advantages to implement distributed online assessment in the resource constrained WSNs.
The rest of this paper is organized as follows. Section 3 describes the characteristics of WSNs transmission under the multisource background, and it defines the failure criterion of transmission in WSNs. Section 4 establishes the transmission reliability evaluation models for WSNs and Section 5 designs a dynamic evaluation framework which can be on-demand customized and dynamically updated with network changing. Section 6 describes the method that achieved the transmission reliability. Finally, Section 7 concludes this paper.
3. System Description
3.1. Transmission Reliability of WSNs
Before modeling transmission reliability of WSNs, the semantics of transmission reliability needs to be clear. However, reliability of WSNs has no unified definition [14]. Some researchers defined it by extending the connectivity reliability as follows.
Definition 1 (see [15]).
Reliability of WSNs is the probability that there is at least one path existing between the source nodes and the sink.
Definition 1 is defined from the perspective of network connectivity; the literatures [16, 17] define the WSNs reliability from the perspective of event as follows.
Definition 2 (see [16, 17]).
Event reliability is the ratio of the packets received by sink to the whole packets generated by the event.
Considering the different missions, this paper defines the reliability of WSNs from the perspective of transmission as follows.
Definition 3.
Transmission reliability is the ratio of the packets received by the destination node to the whole packets generated by the transmission for a given period of time.
Even in the same network the transmission reliability is probably different because it can be impacted by transmission mode, network traffic, the transfer path, and other factors. Therefore, this paper builds a virtual network diagram (directed graph) based on different mission in the actual network. The virtual network can effectively describe the different mission profiles.
3.2. Transmission Profile
The direction of data transmission in WSNs can be divided into two categories: uplink and downlink. The main mission in the uplink is to perceive the event or parameters by the large number of source nodes and send the sensing information to the sink through multihop relays. The main mission in the downlink is to transmit the control command. The sense or actuator nodes are required to be real-time and reliably controlled by sink in smart grid, intelligent transportation, industrial control, and other fields. The controlling content includes queries, network configuration, and some equipment commands of on and off.
3.3. Failure Criterion of Transmission in WSNs
Assume that

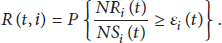
According to the previous analysis of transmission reliability, we can draw that the reliability of the ith transmission task at the time t in WSNs is as follows:
4. Evaluation Model of Transmission Reliability
Aiming at two typical topologies (mesh and clustered) in WSNs, this paper, respectively, analyzes the uplink and downlink data transmission process. The evaluation models are established based on the transmission path.
Clustered topology is widely used in a variety of applications due to its higher energy efficiency and scalability, as shown in Figure 1(a). Sensing area is divided into a number of clusters. Most clustered WSNs are designed with one cluster head, and the transmission between cluster head and members is single-hop [21]. In order to save energy, cluster members do not need to maintain the routing information. Cluster head maintains the routing information and transmits the perceived information to the sink through single hop or multihop. These heads of different clusters compose the backbone layer of WSNs. Figure 1(b) depicts a mesh topology; there are multiple source nodes randomly in the perceived area. Sink is the destination in uplink transmission. Multiple source nodes collect data packets independently and transmit them to the sink via intermediate nodes.
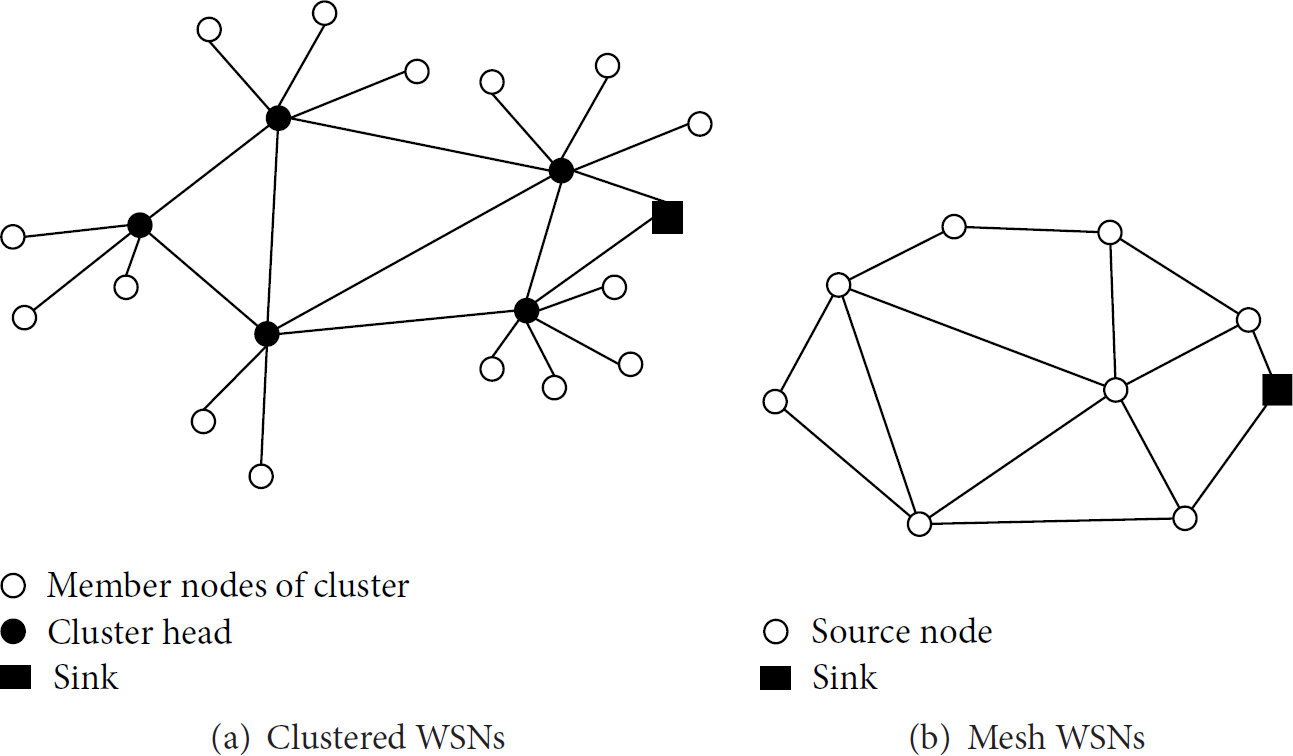
Two typical topologies of WSNs.
4.1. Evaluation Model of Transmission Reliability of Uplink
4.1.1. Evaluation Model of Uplink for Clustered WSNs
Because of the key role of cluster head in the network, the uplink and downlink are also divided into two phases by the boundary of cluster head.
Information perception is the first phase of the uplink transmission in clustered WSNs. Multiple source nodes send perceived information to the cluster head. For the same event or parameter, the information collected by multiple source nodes is complementary and redundant in space and time.
Reliability of cluster c to perceive the event or parameter i is indicated with

Supposing every cluster has only one cluster head,

In order to simplify the problem scale, based on two assumptions that (1) wireless sensor node does not have hardware failure and (2) the working environment conforms to the requirements of the premise, we assume that the reliability of the cluster head depended on two factors: node's residual capacity [22–24] and forwarding probability [25].
Recent studies on power consumption of sensor nodes reveal that voltage level greater than 2.4 volts is an indicator of good residual energy for a typical sensor node [26]. We choose

The second metric is the probability that the cluster head successfully forwards the message to the destination node. It is represented by
In the second stage of uplink in clustered WSNs, the cluster head will transmit the perceived information to the sink. Let m represents the number of paths in the minimal path sets from head of cluster c to sink. The second stage is considered successfully as long as there is at least one path whose packet delivery rate is greater than the transmission threshold


By comprehensive equations (5) to (8), when evaluating a single transmission task, we suppose there are L mission-related clusters in the sensing area. The reliability of uplink in clustered WSNs at time t is

4.1.2. Evaluation Model of Uplink for Mesh WSNs
In the uplink transmission of mesh WSNs, multiple source nodes transmit the sensory information to sink. So this stage is multisource single-sink networks. For an event or parameter, the packets sent by multiple sources are complementary and redundant in space and time. It is not necessary for sink to receive each perceived packet from source nodes. Different from the clustered topology, the efficiency of data fusion by intermediate nodes in mesh topology is low. To simplify the evaluation, this paper assumes the mesh WSNs do not deal with data fusion through intermediate nodes. So the uplink transmission reliability

Let l represents the number of paths in the minimal path sets from the source node


4.2. Evaluation Model of Transmission Reliability of Downlink
The mission in the downlink is to transmit the control commands. Sink is the only source in the downlink. The content of control commands includes queries, network configuration, and the on and off commands of some equipment. Downlink often requires a higher transmission threshold (99.99%–99.9999%). Multiple paths may exist between the sink and the destination nodes. Therefore, downlink transmission reliability of the mesh topology at time t is the probability that in the minimal path sets between sink and the destination node there exists at least one path whose packet delivery rate exceeds the downlink threshold


In clustered WSNs, the backbone layer composed of multiple cluster heads and the sink; it is also a mesh topology. Therefore (13) is also applied to assess the downlink reliability of clustered WSNs in the phase from the sink to the cluster heads.
In the clustered topology, after transmitted successfully by the sink to the cluster heads, the control information also needs to be forwarded to the destination nodes, so the reliability of clustered topology downlink is


5. Dynamic Evaluation Framework
Because reliability is changing with time, this paper proposes a dynamic evaluation framework. The framework consists of two main components: model generation and update management (Figure 2).

Transmission reliability evaluation framework.
Model generation module is responsible for customizing the evaluation model according to the needs. Update management module is responsible for monitoring the network parameters and the topology structure. When the changes are detected, it will trigger the model generation rerunning.
In order to make routing model scalable well, we designed an abstract class Intermediate_routing as an interface for routing algorithm. There is a pure virtual function routing ( ) in the Intermediate_routing. It achieves the specific routing algorithm in the derived class of the Intermediate_routing. We established a template library of routing based on some typical routing algorithms including Flooding, directional spread, multipath, and constraint-based routing (energy consumption, real-time, and reliable). Therefore no matter what kind of routing algorithms was evaluated, it only needs to call the routing algorithm in the template library and modify routing ( ) function. There is no need to readjust the routing model.
Based on the evaluation models built by Section 4, the steps of dynamic assessment framework on-demand customized are as follows.
Step 1.
Select the transmission categories (uplink or downlink) according to the requirement, and set the threshold of the corresponding fault criterion and the time domain of the assessment.
Step 2.
Use the statistical data (obtained from the simulation or the actual network), for example, the number of nodes, network topology, residual energy of node, and link quality in the network to initialize the network parameters, and generate a network topology model (physical topology).
Step 3.
Combine the network topology model and the routing model (selected from the template library) related to the assessment, and establish a virtual network (logical topology). It is the projection of the selected routing algorithm on the actual network.
Step 4.
Transform the virtual network graphics, and convert it to the corresponding metamodel according to the mapping rules between the transmission mode and the metamodel (Table 1).
WSNs mapping rules between transmission mode and metamodel.

Step 5.
Enumerate the minimal path sets of the virtual network and calculate the link reliability of each path based on the statistical data.
Step 6.
Choose the metamodels according to the logical topology of the transmission, and determine the order among the metamodels.
Step 7.
Generate the final customized reliability evaluation model, and calculate the evaluation results.
Step 8.
When the time reaches the next sampling period, or the network parameters or topology changes, turn to Step 2.
6. Simulation Analysis
We used a common network simulation tool NS-2 in order to accurately reflect the real network. It can easily configure the network and accurately simulate network traffic and packet error and easily collect simulation data such as delay, packet loss rate, throughput, and so on. Assuming that 150 sensor nodes were randomly deployed in the areas, main simulation parameters are shown in Table 2. The threshold of perception and transmission was set as 0.75 and 0.99, respectively. We modified the parent class TrafficGenerator of all traffic generators of NS-2 and added the mission ID into the class definition. Each mission flow had unique ID. We bound the mission ID to the business agent. The initialization function initpkt (
NS-2 simulation parameters.

Referring to the energy dissipation model (17) proposed in [27], we assume the radio dissipates coefficient 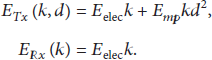
In the simulation, we let the initial energy of each node be 2 J; it will consume energy both in transmitting and in receiving packets. When energy of node is exhausted, the node is failure. Two cases were considered: (1) normal traffic load, of which packet size is 80 byte and packet generation rate is 50 Kb/s; (2) heavy traffic load, of which packet size is 200 byte and packet generation rate is 100 Kb/s. With the time increasing the failed node will increase.
To verify the validity and accuracy of the framework, this paper compared the following three metrics for mesh and clustered WSNs:
Simulation value: it was obtained by adding the mission ID to the packets and collected at the receiving node. Evaluation theoretical value: it was achieved by our proposed framework dealing with the simulation data. End-to-end packet delivery rate: the packets were collected and counted at the destination node without adding mission ID. And the values were calculated through the method of minimal path set.
In the simulation, we selected the CSMA protocol at link layer. At the network layer three routing protocols, multipath (MMSPEED [18]), cooperative routing multiple concurrent streams (FCRMG [19]), and Flooding, are selected for comparison. Periodic transmission was chosen as research subjects. Transmission reliability was evaluated from two directions (e.g., uplink, downlink), respectively.
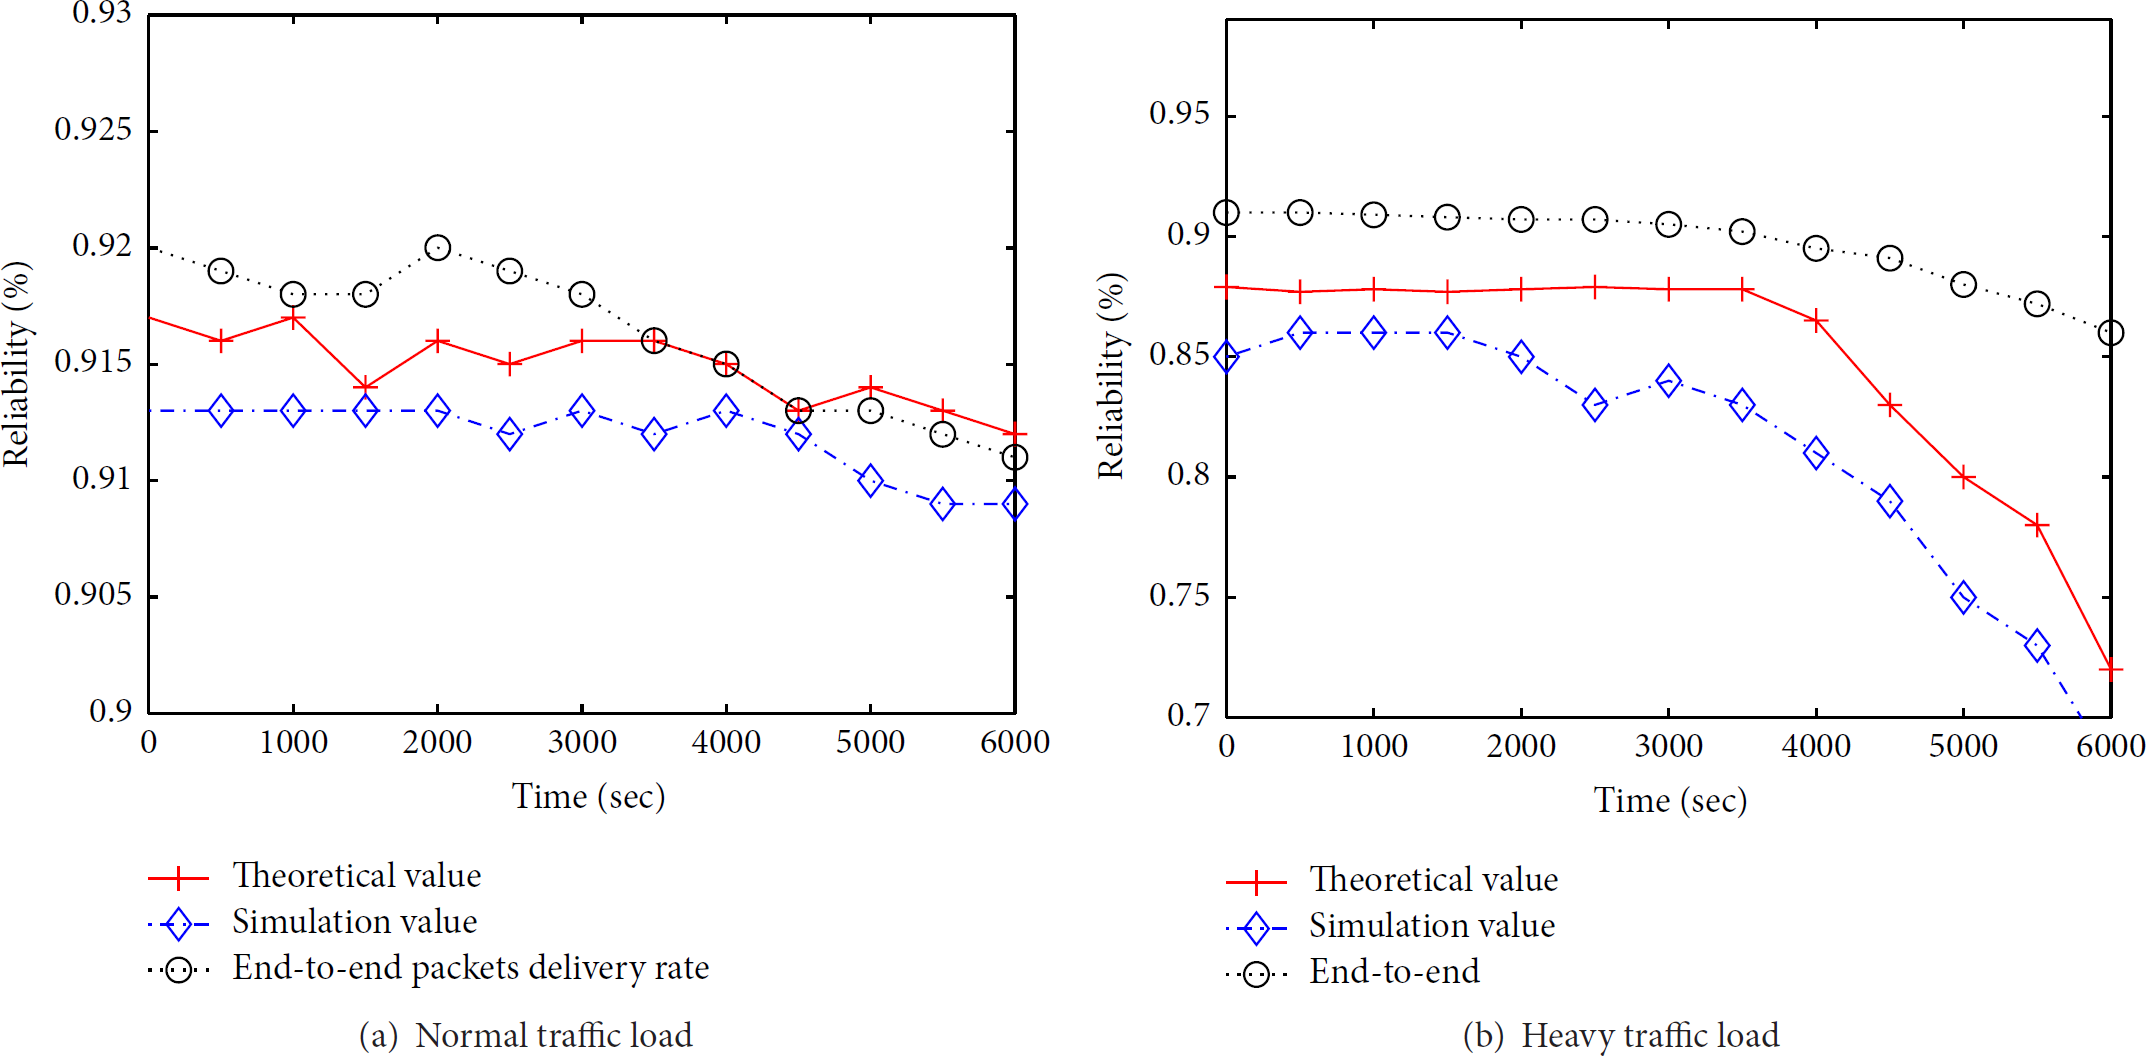
The uplink transmission reliability of clustered WSNs at different time is shown in Figure 3. In the simulation, we selected the single-hop and multiple access methods between the member nodes and the cluster head. And we used multipath routing MMSPEED from cluster heads to sink. It can be seen that, in the case of heavy traffic load, the evaluation theoretical value and the simulation value have obvious downward trend, because the congestion within the cluster is serious in the case of heavy traffic load. Due to each value on the curve of end-to-end packet delivery rate which was the average of packet delivery rate between the source nodes to the sink, the effect caused by network congestion is not obvious. Due to the mission ID which can make full use of the correlation of multisource information, the evaluation theoretical value and the simulation value are approximate.

Uplink transmission reliability (MMSPEED routing) of clustered WSNs.
The uplink transmission reliability of mesh WSNs at different time is shown in Figure 4. We chose FCRMG in simulation. FCRMG commanded each source node to select only one optimal path from all alternative collaborative paths of each traffic flow. In order to better reflect the characteristics of the WSNs with multiple sources, we slightly modified the routing so that each source node can select more alternative paths whose packet delivery rate is over the uplink transmission threshold. In the case of normal traffic load, the three curves remain relatively stable. Contrarily, they also show the downward trend. It can be seen that evaluation theoretical value and the end-to-end packet delivery rate are both higher than the simulation value in mesh WSNs, because both assume that the paths between multiple source nodes and the sinks are disjoint. However, in the case of real multisource environment, there may exist common links between the source nodes to sink. The link failure or data streams which conflict on the common link will result in more packets loss. For the large-scale network, the analysis of the network reliability of the multisource cases with consideration of the intersection paths is very difficult [28], and the network simulation method is better than the mathematical analysis.

Uplink transmission reliability (FCRMG routing) of mesh WSNs.
The downlink transmission reliability of mesh WSNs is shown in Figure 5. In simulation we selected the Flood routing. Since the reliability evaluation of downlink studies the end-to-end transmission, which is between the single source (sink) and the destination node, we can see from Figure 5 that the gap between three curves is small, and the impact of the mission identification is not obvious.

Downlink transmission reliability (Flooding routing) of mesh WSNs.
The downlink transmission reliability of clustered WSNs is shown in Figure 6. We also selected the Flood routing in simulation. Since the downlink transmission on cluster WSNs is also a single-source and end-to-end transmission, the gap between the theoretical value, simulation, and end-to-end packet delivery rate is small as well.
Downlink transmission reliability (Flooding routing) of clustered WSNs.
We analyze the data of two kinds of load cases. For the normal traffic load, the relative error between the theoretical value and the simulation value is 0.97%, which between the end-to-end connection reliability and the simulation value is 4.63%. For the heavy traffic load, the relative error between the theoretical value and the simulation value is 1.12%, which between the end-to-end connection reliability and simulation value is 6.27%. It can be shown that our evaluation model and framework are effective and accurate.
7. Conclusions
Considering both the single source (downlink) and multisource (uplink) we established the reliability evaluation model for network transmission. We designed a transmission reliability evaluation framework for WSNs; it can be customized according to the requirement of the assessment and updated dynamically according to the network status.
Using the evaluation framework we evaluated the transmission reliability of WSNs with typical topology: clustered and mesh. Comparing with the end-to-end packet delivery rate of WSNs, transmission reliability evaluation theoretical value is further closer to the simulation values, which verified the validity and accuracy of the evaluation framework.
Transmission reliability of different routing strategies in the uplink and downlink was evaluated, even for the same routing strategy whose transmission reliability was found to be different in the uplink and downlink. It demonstrates that the network should adjust the routing strategy adaptively in order to meet requirements for diverse mission. Furthermore, the reliability assessment results can be used as the input of other analyses, as planning method, or directly as the adaptive parameters. Reliability optimization can reduce the energy consumption of reliable transmission mechanism such as retransmission and multipath routing and reduce the delay caused by retransmission. This paper provides a theoretical basis for the design and optimization of the reliable transport to better meet user's demand for network services.
Certainly, the evaluation framework is built on the premise that the topology and routing are known or can be known. If topology or routing is unknown, it requires extra work to get related information. Our future research will focus on the evaluation in the unknown network.
Footnotes
Conflict of Interests
The authors declare that there is no conflict of interests regarding the publication of this paper.
Acknowledgments
This work is jointly supported by International Science & Technology Cooperation Program of China (Grant no. 2014DFB10060), National Natural Science Foundation of China (Grant no. 51504010), Specialized Research Fund for the Doctoral Program of Higher Education of China (Grant no. 20120111110001), and Key Projects of Anhui Province University Outstanding Youth Talent Support Program (Grant no. gxyqZD2016083).