
Abstract
The aim of this work is the development of a network of wireless devices to determine, along with a time-stamp, postural changes of users that are to be used in personalized learning environments. For this purpose, we have designed a basic low-cost pressure sensor that can be built from components easily available. Several of these basic sensors (of sizes and shapes chosen specifically for the task) are integrated into a posture sensor cushion, which is electronically controlled by an Arduino microcontroller board. This accounts for experiments involving either a single cushion to be used by an individual end-user setting approach or classroom approaches where several of these cushions make up a sensor network via ZigBee wireless connections. The system thus formed is an excellent alternative to other more expensive commercial systems and provides a low-cost, easy-to-use, portable, scalable, autonomous, flexible solution with free hardware and software, which can be integrated with other sensing devices into a larger affect detection system, customizable to cope with postural changes at required time intervals and support single and collective oriented experimentation approaches.
1. Introduction
The detection as well as analysis of postural changes is one of the least explored facets in the field of affective computing [1, 2] and in its application to personalized education [3]. The physiological signals that have been mostly recorded are based mainly on equipment detecting facial expressions [4] and vocal expression [5].
Charles Darwin became most likely the first person to scientifically explore emotions as the result of evolutionary processes [6]. Darwin's research on emotion was clearly focused on body language and on posture. Detection techniques have overlooked posture as a serious contender to facial expressions [7] and acoustic characteristics. It is surprising how the advantages of using posture for diagnosing the affective states of a user have been overlooked, given that human bodies are relatively large and are capable of multiple degrees of movement and thus can assume a wealth of unique configurations, which can be combined simultaneously and temporarily, potentially making posture an ideal channel for communication [8].
Posture [9] can provide information that is not available within the convention of nonverbal measures such as the face and paralinguistic features [10]. The biggest advantage of postural recognition is that body movements are unconscious and intentional and therefore are not susceptible to social strata [11].
Currently, mechanisms to detect postural changes are usually expensive, which greatly limits their use in affective computing. Among these commercial sensors we can find, for instance, the Tekscan Conformat pressure mat [12], a portable and lightweight system specially designed to fit the shape of the patient and support surface, with over 2,000 individual sensing elements providing accurate, high-resolution readings; the Spectra Symbol flex sensor [13], a simple flex sensor 4.5′′ in length, that increases its electrical resistance as the sensor is flexed; the Tactilus textile sensor [14], a paper-thin sensor to record the pressure distribution and magnitude; the range of Tekscan Flexiforce pressure sensors [15] and the Flexpoint flex sensors [16], all of them able to measure the force between almost any two surfaces; or the Papier pressure sensors [17], sensors that can be directly used or cut to the appropriate length and respond to a flexion or compression. Additionally, a wide range of sensors is available from the Meas-Spec film manufacturer [18], with sheets to produce simple transducers, speakers, and so on, and Sensitronics, which provides several devices that include matrix arrays of sensors [19]. In this context, many authors have reported the use of such commercial devices, either precision systems (such as [20, 21]) or more affordable ones (such as [22]).
Thus there is a challenge in affective computing as to be provided with a nonintrusive, low-cost, portable, autonomous, flexible system with free hardware and software. The purpose here is measuring pressure variations at various points (that reflect posture variations) mainly through pressure sensors while allowing the integration with other sensing devices which are indicative of meaningful affective users’ states in learning scenarios [23], such as doubt, loss of context or frustration, attention, and engagement, which may occur while carrying out learning tasks on the computer [24].
We have ruled out commercial solutions for two basic reasons: (1) their need to adjust the size of the sensors to the dimensions required by the measuring device; (2) their cost. Thereof we have developed our own simple, inexpensive sensor that can be manufactured with components easily available. Notice that our objective is to detect user's postural changes, not to measure the pressure at each point precisely. Thus great precision is not needed given that we only need to be able to reliably determine changes in recorded values which correspond to user posture movements.
To cope with aforementioned challenges our approach consists of combining several of these simple sensors so that they can be used together to form a posture sensor cushion. Individual sensors are controlled via open-design Arduino microcontroller board [25], being able to connect a virtually unlimited number of gadgets via XBee devices [26], which allows wireless connection under the ZigBee protocol [27]. Thus a network of sensors [28] can be created, which, when located in a classroom or building, allows postural detection individually or collectively. The resulting system has been incorporated into the MAMIPEC project (a project that deals with some key issues in affective computing, context awareness and ambient intelligence) [29], where it has been successfully integrated with other user information recording systems [30].
This paper has been organized as follows: Firstly, we describe the basic sensor element, its construction and main features. Then we illustrate how to connect multiple elements to form a sensor cushion capable of detecting variations in user's posture in Section 3. In Section 4 we report on how several of these cushions can be used to form a wireless sensor network to provide service to a classroom. Some real tests to detect the most common affective states in e-learning environments are described in Section 5. A price analysis is given in Section 6. Finally, we conclude with some conclusions from this work that will serve to support future developments.
2. The Basic Sensor
2.1. The Piezo-Resistive Device
After an initial survey on commercial options available in the market (whose main findings have been described in the previous section), our efforts have focused on creating a sensor that is able to provide detection measures at the least possible cost [31]. Since the objective is to detect postural changes, the search was oriented toward materials that make this behavior stand out.
The result of the search was Velostat materials [32], developed by Custom Materials (3M), consisting of a sheet of carbon-impregnated polymer. What makes the material interesting for our purposes was its piezo-resistivity, in which the material's electrical resistance varies as a function of the pressure placed on the film. This material provides great flexibility for low-cost developments, whereby the creation of custom sensors that can be easily tailored in terms of both shape and number to the device on which they are installed becomes feasible.
To create the sensor, additional materials are needed—such as conductive material (aluminum foil 0.2 mm) and covering (adhesive, transparent PVC), along with duct tape and flexible cable.
With this schema, a sensor consists of five layers:
two outer layers of transparent adhesive film, which give “body” to the sensor; two layers under the adhesive film of conductive material, which allow the sensor to detect pressure; an inner layer of piezo-resistive material, which provides an analog value, in the form of resistance, to the pressure on the sensor.
Sensor dimensions are shown in Figure 1, where X and U represent the dimensions of transparent self-adhesive material, Y and V represent the dimensions of conductive material, A and B represent the size of the tabs for connection of the sensor, and finally Z and W correspond to the piezo-resistive material.
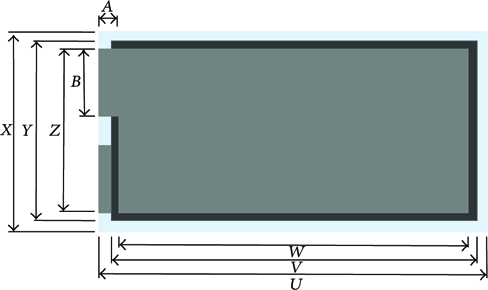
Sensor dimensions.
Once the materials making up the sensor have been assembled, it takes on the appearance shown in Figure 2. A typical sensor size costs (excluding the additional electronics required for measurements) under €2 (US $2.24; official exchange rate, 26/02/2015, €1 = US $1.1212). As will be seen below, it can be connected to any measurement device that has analog inputs: in our case, an Arduino prototype board.

Final appearance of the sensor.
2.2. Characterization of the Device
Before detailing the construction of the cushion, in this section we characterize the properties of the basic sensor introduced above. In particular, we determine the repeatability of the measurements, both for the same sensor in different experiments and for different sensors built with the same materials and under the same conditions.
Tests were conducted on three types of sensors that differ in their dimensions, as shown in Table 1.
Dimensions of test sensors.

As discussed below, the selected electronic control unit, Arduino Mega, has analog-digital converters (ADC) with 10-bit resolution (1024 discrete levels), representing a voltage measurement accuracy of 2.44 mv at a 5 V reference voltage. Henceforth the values shown are expressed directly as the digital value measured by the converter. (The corresponding value of the resistivity of the sensor can be directly calculated from Ohm's Law.)
2.3. Individual Trials
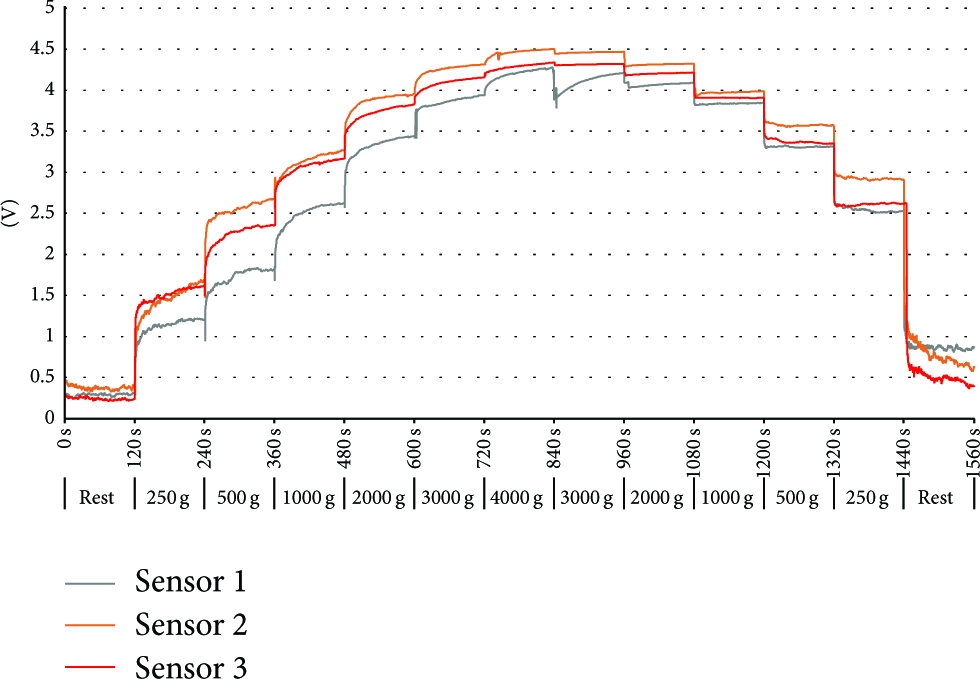
Individual tests were conducted on a representative sensor from each of the classes shown in Table 1. Values were recorded for a total period of 1560 seconds (24 minutes), using changes in mass loaded on the sensor between 250 grams and 4000 grams every 120 seconds.
The results obtained are shown in Figures 3–5. It can be clearly seen that the qualitative behavior of the sensors is very similar, although the sensitivity is lower for the smaller sensor (Type 3).

Individual results, Type 1 Sensor.

Individual results, Type 2 Sensor.

Individual results, Type 3 Sensor.
2.4. Testing Replicability
This consists in determining whether the sensors built in the same conditions and with the same materials yield the same results. These are shown in Figures 6–8. It will be seen that, regardless of sensor's sensitivity, all of them perfectly track changes in the variation of the applied load.
Replicability results, Type 1.

Replicability results, Type 2.

Replicability results, Type 3.
2.5. Testing Repeatability
In this case we arbitrarily chose one sensor of the kinds described in Table 1 and varied the mass loaded on it every 30 seconds, making 15 complete cycles. The results obtained are shown in Figures 9–11. The qualitative behavior is very similar, perfectly detecting changes in the pressure exerted on each of the sensors.

Repeatability results, Type 1.

Repeatability results, Type 2.

Repeatability results, Type 3.
2.6. Analysis of the Results
From these and other similar tests, not given here for space reasons, we observe that the qualitative behavior of the sensors is very similar, although their size affects their sensitivity. Sensitivity is greater at low pressures, so the sensor should be protected with a material (e.g., polyester foam) to distribute the pressure exerted by the weight of the user to a wide area. Additionally, this ensures that the analog input read limit is not exceeded, and that the input is not saturated.
It should be stressed that we do not need the sensor to give us an exact reading of weight or pressure being exerted upon it. We do not need a precision scale. To determine the posture of the person who is sitting on top of the sensing device, and the changes that occur to it, we consider the difference in the absolute values that are produced by the change in pressure on the sensors: the analysis of these variations allows us to determine changes in the user's posture.
From all this, we can conclude that the types of sensors described in previous sections, especially the larger ones, are suitable for developing a cushion capable of detecting changes in the posture of the user, as shown in the next section. Moreover, a great advantage of these sensors is that they can be easily replicated.
3. Posture Sensor Cushion
To account for all the aforementioned research requirements and to achieve the overall objective, that is, detecting user's postural changes, we need to create a device that integrates a group of sensors together with corresponding control mechanisms.
The number of sensors needed is to be closely related to the electronics of the device control. To create this particular sensing device, Arduino microcontroller boards were selected. In particular, the Arduino Mega 2560 rev3 board [33] was chosen, given that it is an open source electronic platform easy to use, affordable, and easily expandable through specific “shields.” The Arduino Mega 2560 has 16 analog inputs, allowing a uniform distribution of sensors in the seat and the back of the cushion, as shown in Figure 12. The connection of the electronics to the sensor is shown in more detail in Figure 13.

Outline of the system.
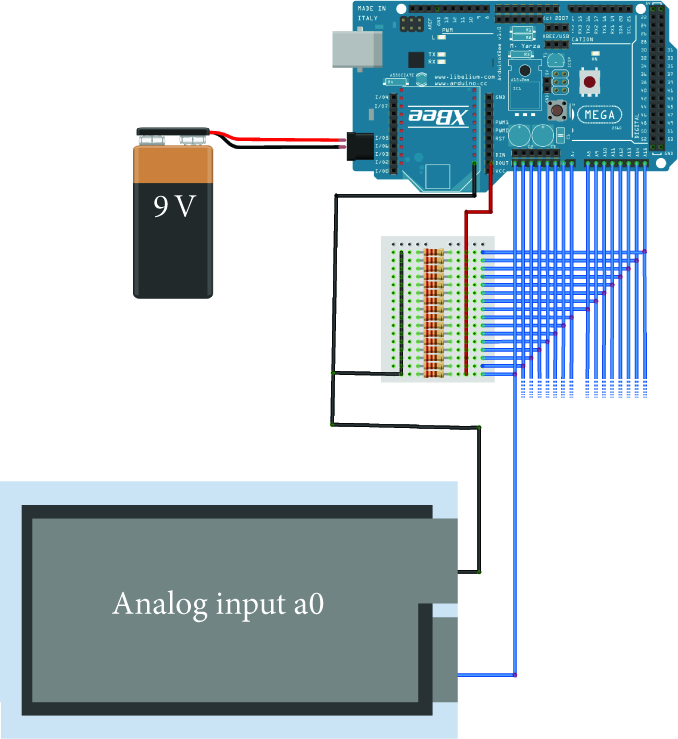
Detail of connection and electronics.
We have come up with a sensing cushion device to support our system. In particular, a cushion is used because it supports the device unity, flexibility, and portability, and thus the device can be installed directly on any typical office chair.
The final size of this support we came up with, that is, 95 × 45 × 6 cm cushion, should cater for the conditions and the size of the sensors that are to be integrated into it. Considering that the objective is to cover the largest surface possible, we implemented two groups of sensors, based on their location, as shown in Table 2.
Dimensions of the sensors.

Placing sensors on the backrest is performed as illustrated in Figure 14. The electronics of the device are housed in a box in the upper rear in order to avoid possible impacts, as can be seen in Figure 15.

Placing sensors.

Final appearance of the device.
4. Integration into a Wireless Sensor Network
In this paper we focus on detecting user postural changes that might indicate affective states that can be of interest in e-learning scenarios. The whole system allows testing on users individually or collectively, as it is required, because sensors are to be used in single-user or group-oriented (i.e., classrooms) experiments. Whatever the methodology used, the information recorded by the devices is stored centrally, along with a time-stamp, in either EDF+ [34] or plain text format. This storage is meant to allow further analysis of both individual or collective information, in addition to data mining.
To create the network of sensors, XBee ZigBee modules were used [35], thus offering wireless connectivity and allowing the system to interact with other devices. This communication mechanism was selected because these modules are easily integrated into Arduino boards.
To create the network device, mesh topology was used, which allows the integration of ZigBee communication devices in Device End mode. This consists of a passive network element that only sends information and is installed on each data capture device and a coordinator module, which receives data from each device and is responsible for network administration. The coordinator module stores the information received from each of the devices along with a time-stamp in a local storage system, an SD card, providing ease of portability.
Optionally, the device can be connected to a computer coordinator via USB to perform an online scan, using viewing software developed for this purpose, which allows the graphical interpretation of network devices in real time. In Figure 16 the data capture for four measuring pads used simultaneously is shown.

Visualization for four devices (green and yellow representthe lower pressure while orange and red represent the maximum).
This whole system was developed using Processing 2 [36], which provides a Java-based, easy to use GNU GPL-licensed open-source integrated development environment. Additionally, it allows for the generation of projects for popular operating systems and integrates seamlessly into the Arduino and ZigBee environments.
5. Tests in a Real Environment
Tests are currently being carried out in real end-user environments deployed within the MAMIPEC project [29]. This covers individual system testing approaches, or collective testing scenarios, as in [37, 38], individually and collectively, as well as integration testing with other recording devices (Figure 17).

Real-environment data measurement.
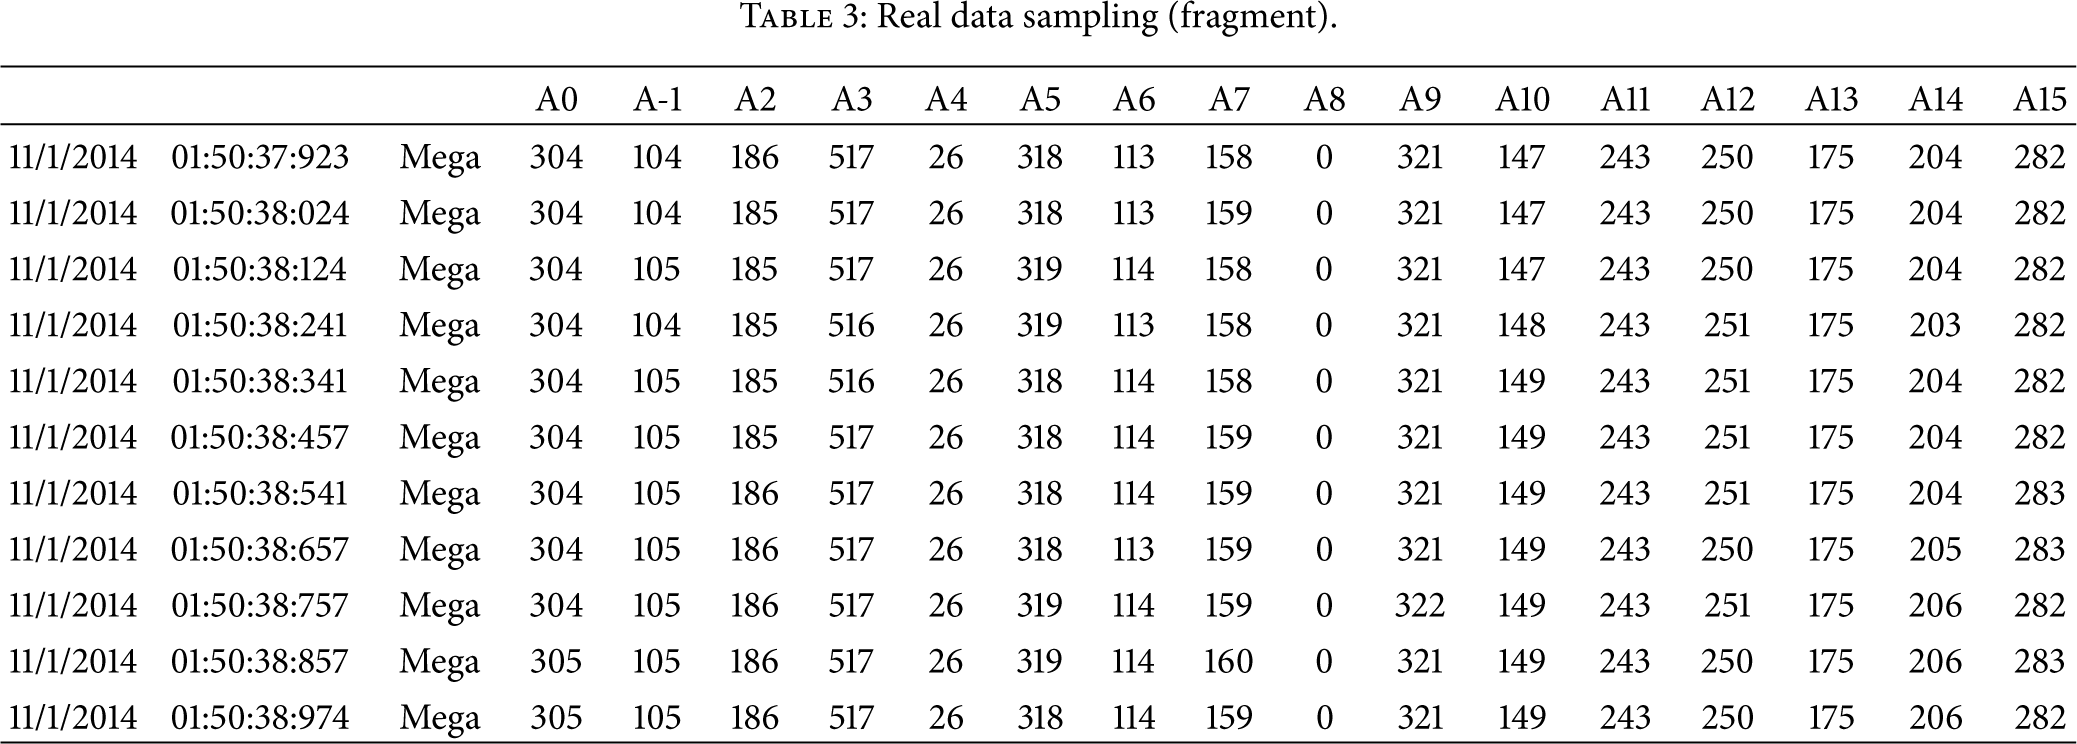
A sample of the “raw” results, where the value obtained is observed for each of the analog inputs for the Arduino Mega, is shown in Table 3. The sampling resolution that is reported here was suitable for initial testing and the device is prepared to serve as input for more complex situations, such as the aforementioned collective approaches. This data is to be integrated with the rest of the inputs from alternative devices that make up the test bed, where all these data are integrated in terms of different affective labeling approaches and data mining techniques (see [30, 39]).
Real data sampling (fragment).
At least 12 postures may represent the most common affective states in e-learning environments (see [9] for a more detailed description). For each posture, experiences have been made on a total of nine individuals, whose physical characteristics are summarized in Table 4.
Users’ physical characteristics.

In the following we show how these postures are visualized by the system for all the users.
(1) Standard. It is back support, sitting back with the feet completely flat. This posture is characterized by the body exerting pressure on the back and seat (Figure 18).
Posture 1.
(2) Lying (1). It is a posture denoting boredom, where subjects sit up on the air, sitting on the edge of the chair. The body exerts strong pressure on the upper part of the back and the front of the seat (Figure 19).

Posture 2.
(3) Tilt Forward. It denotes attention. Subjects sit back, leaning forward, feet under the chair. The body exerts a strong pressure on the front of the seat, without pressure on the back (Figure 20).

Posture 3.
(4) Normal Position, Feet under the Chair. This posture denotes attention, where subjects sit with their back supported, sitting back with their feet completely flat. In this position, the body exerts very little pressure on support and strong pressure on the front of the seat (Figure 21).

Posture 4.
(5) Sitting on the Edge. It is a stance denoting attention, where the subject sits on the edge of the chair, back and flat feet completely on the air. No pressure is observed on the back, showing a homogeneous distribution on the seat (Figure 22).

Posture 5.
(6) Legs Crossed. It is a posture denoting peace, subjects sitting normally with legs crossed. Depending on the crossed leg, the weight is concentrated on the right or left of the seat and slightly on an edge of the back (Figure 23).
Posture 6.
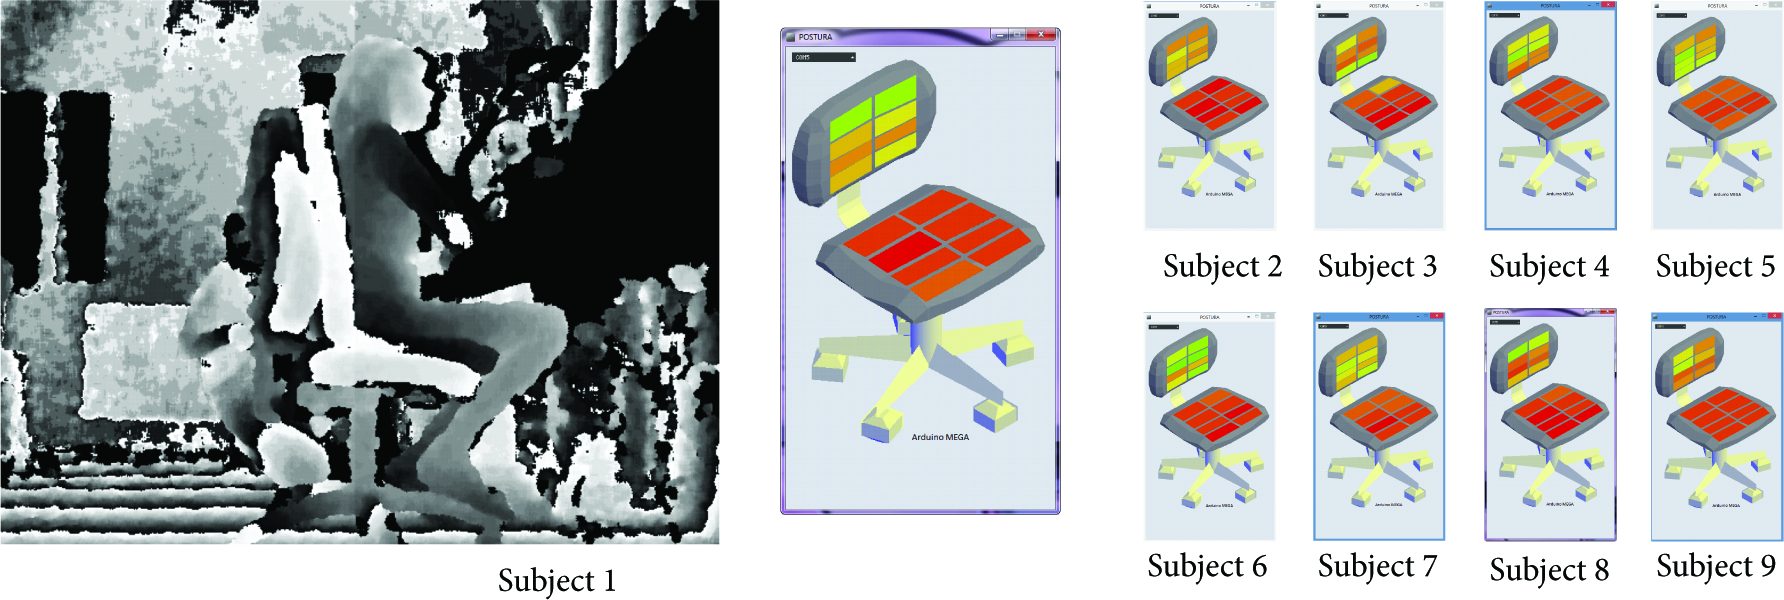
(7) Sitting on One Foot. This posture denotes lack of attention, the subject sitting in normal position, with one foot under the body. The weight is concentrated in the leg on which the body is supported (Figure 24). This position exhibits additional difficulty for detection. Two subjects have struggled to adopt this position and have not been able to register valid values, so they have been omitted.

Posture 7.
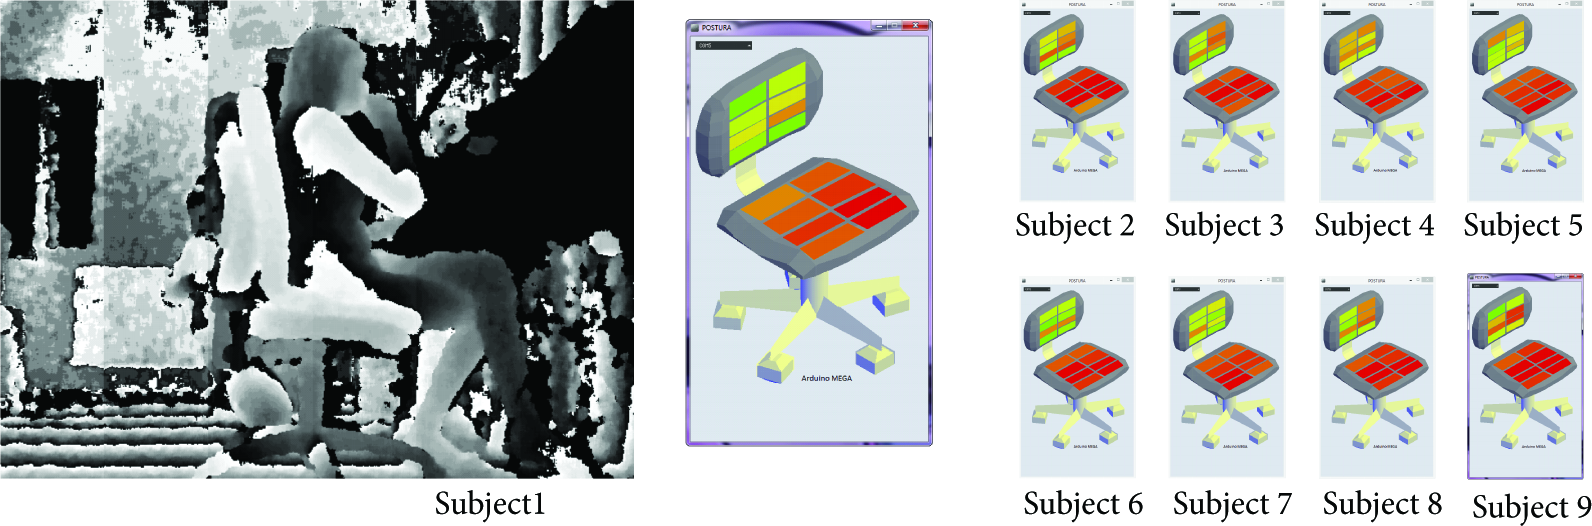
(8) Sitting on Two Feet. It is a posture denoting lack of attention, the subject sitting in normal position, both feet under the body. The weight is concentrated on the shape of the legs (Figure 25). This position, as the previous one, has additional complexity for detection. Moreover, most users were not able to adopt this posture.

Posture 8.
(9) Rocking Chair. This stance denotes boredom. The subject sits in normal position, rocking the chair back. The body exerts a strong pressure on the upper back and on the front seat (Figure 26).

Posture 9.
(10) Rigid Posture. It denotes nervousness/anxiety. The subject is sitting with the body upright. The body exerts considerable pressure on the seat but very little on the back (Figure 27).

Posture 10.
(11) Tilt Forward, Head in Hands. It is a posture denoting frustration, subjects supported against the table, head resting on the hands. There is a lot of pressure on the seat, but little on the back (Figure 28).

Posture 11.
(12) Lying (2). This posture denotes fatigue. Subjects sit in a reclining position. In this position a lot of pressure is exerted on both the seat and the backrest (Figure 29).

Posture 12.
This is a representative sample of the most common positions, but they can be combined, resulting in a large number of actual positions; moreover, it is important to note that there is a close relationship between the position and aspects such as gender or physiognomy.
Nevertheless, we see that the states of boredom, inattention, and fatigue have a lot of pressure on the seat and medium/high pressure on the back; the states of attention and tranquility have little pressure on the back and high pressure in the front seat, while the states of nervousness and frustration have little pressure on the back, but a lot of pressure throughout the seat. Thus, this sensor cushion allows the stances to be easily classified into three major groups in an initial, online, analysis; more information can be obtained with more complex algorithms or offline data mining.
6. Price Analysis
The posture sensor device we have developed actually turns into a very effective sensing device with respect to current commercial systems. As previously pointed out, and in order to deal with the low-cost requirement, a final solution was developed which consists of a 16-sensor device that can be developed for barely €133 (US $149; official exchange rate, 26/02/2015, € 1 = US $1.1212), including electronic and communication systems (the materials used in the development of such a device are shown in Table 5). On the contrary, the cost of a commercial system with similar features is about 6000 €/6727 $. Let us assume we need 30 measurement cushions for a whole class: the cost of deploying a total of 480 sensors involved adds up to 3993 €/4477 $ only.
Price breakdown.

7. Conclusions
In this paper we have come up with a network of posture sensor cushions for postural sensing that is being used in personalized learning environments. This is an inexpensive wireless device based on free hardware and software. The combination of a custom sensor, Arduino, and XBee electronics provides an extra benefit compared to commercial options, which are usually closed and difficult to integrate into more complex systems.
The sensors monitor the users’ affective states that are meaningful in learning scenarios, which can be easily classified into at least three major groups in real time ((1) boredom, inattention, or fatigue; (2) attention and tranquility; and (3) nervousness or frustration), while a deeper understanding can be achieved with more sophisticated algorithms or in further analysis.
The possibility of developing replicable measurement sensors allows the device to be adjusted to the needs of any given setting, providing significant value to the system. Although seemingly trivial, being adjustable to meet the needs of other measurement systems or the physiognomy of the user provides an important complement to a personalized education system. It also allows the modification of the device configuration, varying the number of dedicated sensors in each area (seat or back), depending on specific needs.
Finally, it does not escape the authors’ attention that the possibility to monitor people’ affective states is of special interest in many fields other than education. The flexibility and low cost of the proposed sensor make it an ideal candidate for such purposes.
Footnotes
Conflict of Interests
The authors declare that there is no conflict of interests regarding the publication of this paper.
Acknowledgments
The authors would like to thank contributions to the development of the system for the ADENU research team and their participation in the development and integration of the solution in the MAMIPEC project. They thus acknowledge the Spanish Ministry of Economy and Competitiveness for funding this project (TIN2011-29221-C03-01). They would also like to thank Inmaculada Blanco, Fernando Ramos, Leticia Escudero, Carlos de Castro, Manuel Martin, and Adela Colinas for their collaboration. This research was funded by Caja Rural de Zamora (Zamora Rural Savings Bank), which they would like to thank for making this work possible.