
Abstract
In recent years, with the development of wireless sensor networks (WSN), it has been applied in more and more areas. However, energy consumption and outlier detection have been always the hot topics in WSN. In order to solve the above problems, this paper proposes a timely anomaly detection algorithm which is based on the data fusion algorithm. This algorithm firstly employs the piecewise aggregate approximation (PAA) to compress the original data so that the energy consumption can be reduced. It then combines an improved unsupervised detection algorithm of K-Means and artificial immune system (AIS) to classify the compressed data to normal and abnormal data. Finally, relevant experiments on virtual and actual sensor databases show that our algorithm can achieve a high outlier detection rate while the false alarm rate is low. In addition, our detection algorithm can effectively prolong the life because it is based on data fusion algorithm.
1. Introduction
With the development of digital electronics and wireless communications, a new breed of tiny embedded systems known as wireless sensor nodes has emerged in the past decade. A wireless sensor network (WSN) which consists of a large number of cheap, tiny, battery powered sensor nodes equipped with limited on-board processing, storage and radio capabilities has provided a variety of applications, such as health monitoring, scientific data collection, environmental monitoring, and military operations [1].
Event-driven WSN applications [2] require timely data analysis and assessment in order to facilitate (near) real-time, efficient, and accurate critical decision making and situation awareness. However, the stringent resource constraints such as battery life, computational capacity, and communication overload may lead to unreliable and inaccurate sensor data, especially when battery power is exhausted. What is worse, these sensor nodes are usually deployed in harsh and unattended environments where the data may be unreliable because of noise, missing, redundant data, and so on. Therefore, how to ensure the accuracy of sensor data and find these unreliable data timely has become an urgent task in the applications of WSN [3].
To identify the unreliable data or malicious invasion, outlier detection is used in WSN, and some algorithms of outlier detection have been proposed [4–8], but almost none of them consider the problem of energy consumption during the process of detection. In this paper, we propose an anomaly detection algorithm which is based on the data fusion algorithm. To reduce the communication overload and prolong the life of battery, we firstly use the algorithm of PAA which is lightweight to compress the time series data of each node. Then based on the result of PAA, we combine an improved unsupervised detection algorithm of K-Means and AIS to effectively classify the normal and abnormal data. The improved K-Means algorithm is used to complete the classification of compressed data, and the AIS offsets the drawbacks of K-Means so that the detection result is global optimal. Simulations with two synthetic datasets and several real environmental datasets adopted in the paper [9] show that our adaptive outlier detection technique achieves high detection accuracy and low false alarm, and it saves the energy of network through data compression at the same time.
The rest of the paper is organized as follows. In Section 2, we review the characteristics of outlier detection and some existing outlier detection algorithms in WSN. In Section 3, we illustrate our improved K-Means and AIS algorithm which is based on compressed data in detail. In Section 4, we present our experimental results to validate the capabilities of our algorithm with a synthetic datasets and several real environmental datasets. Finally, we conclude the paper and discuss directions for future work in Section 5.
2. Related Works
In this section, we firstly analyze the challenges of outlier detection in WSN when compared with the traditional outlier detection techniques. In Section 2.2, we analyze the advantages and disadvantages of some recent outlier detection algorithms in WSN.
2.1. Challenges of Outlier Detection in WSN
Outlier in WSN, also known as anomaly, can be defined as, “those measurements that significantly deviate from the normal pattern of sensed data [13].” This definition indicates that an effective way for outlier detection in WSN is to define a normal behavior of sensor data and consider those sensor observations that deviate from the defined normal behavior of sensor data as outliers. However, conventional outlier detection techniques might not be suitable for sensor data in WSNs where there are more challenges for outlier detection [3].
Resource constraints: as said before, WSN has a stringent resource constraints such as battery life, computational capacity, and communication overload. Thus, compared to the most of traditional techniques which are computationally expensive and require much memory for data analysis and storage, how to minimize the communication load of WSN needs more attention. Distributed streaming data: during the lifetime of data collection, the underlying phenomenon which is being measured may alter, so the sensor data will be a nonstationary streaming distribution. It suggests that most of traditional outlier techniques with analyzing stationary offline data are not suitable for WSN and these algorithms which need a priori knowledge of the data distribution are also infeasible. Thus, a key of outlier detection in WSN is how to detect the distributed streaming data online. Large-scale deployment: massive sensor nodes may be deployed in the WSN. This requires the construction of an accurate normal profile that represents the normal behavior of sensor data so that the outlier detection techniques can still maintain a high detection rate while keeping the false alarm rate low.
According to the above analysis, an effective and efficient outlier detection technique for WSN should be able to identify outliers in a distributed and online manner with high detection accuracy and low false alarm, at the same time, satisfying WSN constraints in terms of communication, computational, and memory complexity [4].
2.2. Analysis of Several Previous Algorithm
Recently, many detection techniques have been proposed. Sun et al. [6] proposed a technique based on extended Kalman filter based mechanism to detect false injected data. The paper further applies an algorithm of combining cumulative summation and generalized likelihood ratio to increase detection sensitivity. This algorithm is practical on resource stringent hardware, but too much calculation fails to ensure the real-time detection. Salem et al. [5] presented an algorithm which combined the Mahalanobis distance (MD) and the kernel density estimator. The former is used for spatial analysis and the latter completes the identification of abnormal patterns. This technique does not require a priori known data distribution and can achieve good detection accuracy with low false alarm rate. A remaining problem in this technique is its high dependency on the predefined threshold of MD, while an appropriate threshold is quite difficult to figure out and a single threshold may also not be suitable for outlier detection in multidimensional data. Zhang et al. [4] took into account the correlation among sensor data attributes and proposed two distributed and online outlier detection techniques based on a hyperellipsoidal one-class support vector machine (SVM). The algorithm takes advantage of the theory of spatiotemporal correlation to identify outliers and updates the ellipsoidal SVM-based model representing the changed normal behavior of sensor data for further outlier identification. However, this technique ignores the communication capability of each node, where the spatial correlation is calculated by exchanging some parameters between neighbors. Bhargava and Raghuvanshi [7] proposed an anomaly detection algorithm based on S-transform and one-SVM (support vector machine). To reduce the data size, S-transform is applied to extract the significant components of the time series data, and then one-SVM is used to classify data into original and anomalous. This algorithm adopts compression transformation before outlier detection, but it needs to classify every extract components for final decision which generates heavy calculation. Some other outlier detection techniques in WSN also have been proposed [14–16]. Above outlier detection algorithms can detect outliers effectively, but they have not fully considered the characteristics of outlier detection in WSN, such as the constrained resource and the dynamic data flow. To solve these problems while also ensuring the detection accuracy high, we propose the outlier detection algorithm based on the data fusion. Firstly, we consider using improved PAA to save sensor energy and reduce the calculated amount in the following process of outlier detection. Then use an improved K-Means algorithm which does not need a priori knowledge of the data distribution to distinguish normal and abnormal data. Finally, the AIS algorithm is used to make the detection result by K-Means global optimal and the detection accuracy high. The advantages and reasons of selecting PAA, K-Means, and AIS for our outlier algorithm are shown in next chapter in detail.
3. Our Proposed Algorithm
In this section, we will present our outlier detection approach in detail. Figure 1 shows the diagram of our proposed algorithm. Firstly, we utilize the PAA to compress the original sensor data. Then the improved K-Means algorithm is used to complete the classification of compressed data, and the AIS offsets drawbacks of K-Means so that the detection result is global optimal. The two phases of compression and outlier detection will be discussed below in detail.

Flow diagram of our proposed algorithm.
3.1. Data Compression with PAA
To save energy of sensors, techniques of data compression have been used in WSN because most energy is consumed in data transmission [17–19]. However, due to resource constraints, a suitable compression algorithm for WSN should be efficient and simple. As a dimensionality reduction algorithm, PAA is more intuitive and simple when compared with these techniques such as Fourier transforms, wavelets, and so on [20]. What is more, the degree of compression can be changed by adjusting the compression ratio parameter. Thus, the PAA technique is adopted to compress the data in this paper.
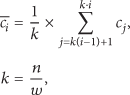
A time series C of length n can be represented in a w-dimensional space by vector:

And the ith element of
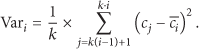
Obviously, the compression process of PAA is simple and fast, but this way of compression also introduces a problem that this technique compresses the data directly without considering the characteristics of data and the correlation between data, which may lead to some mistakes in the subsequent handling of compressed data. This problem also has an influence on the outlier detection behind. For example, the situation in which the value of data is greater than 10 is considered abnormal, and
Due to the energy consumption on acquiring the neighbor data, it is not encouraged to compress the data with PAA on the space. On the contrary, every sensor has a cache to storage previous data, so it is convenient to compress time series data with PAA in each node. A sliding window is used to implement the selection of data with k length, where k represents the compression ratio of PAA. According to (3) and (4), a binary array
3.2. Outlier Detection on Compressed Data
Based on compression result of PAA in the preceding subsection, we combine an improved unsupervised detection algorithm of K-Means and AIS to effectively classify the normal and abnormal compressed sensor data. Because reconstruction of the initial data is not needed, it will have good real-time performance. After all sensors sent their data to the Sink node, the improved K-Means algorithm which needs no prior knowledge of data distribution is used to complete the classification of compressed data, and the AIS offsets the drawbacks of K-Means so that the detection result is global optimal. We will introduce the process of outlier detection in detail in the following.
3.2.1. Classify by the Algorithm of K-Means
According to the definition of outlier in WSN, the key of the outlier detection is how to effectively separate the outliers from normal data. Classification is a process to classify sampled data into different classes or clusters. Some classification techniques, such as SVM and artificial neural network (ANN), have been utilized in the outlier detection in WSN [21–23]. As one of the simplest classification algorithm, the K-Means technique also has been proved to be effective in the outlier detection in other areas [24–26], which groups data with length N points into The K-Means do not need knowledge of the data distribution, and it is suitable for dynamic data. The calculation is simpler than other classification techniques, such as SVM and ANN.
However, there are two elements included in every compressed data, so we have an improvement on original K-Means algorithm to ensure that the K-Means algorithm can be combined with PAA algorithm. Suppose that the number of sensors in a WSN is N, and the improved steps of the K-Means in our algorithm are as bellow.
Select For every training data
Calculate the Euclidean distance:
Assign Repeat steps


After the process of classification, according to the definition of outlier, the ideal result is that the abnormal data will be assigned to the same cluster while the normal data will be assigned to the same cluster, because these outliers are deviated from the normal data Therefore, the less the result J is, the more precise the classification is. In addition, compared to the normal data, the number of abnormal data is relatively less, so these data in the cluster where the number of data is the least is the identified outlier.
3.2.2. Classification Improvement with AIS
As it is known that the K-Means algorithm depends on the initial centroids of the clusters and it is easy to fall into local optimum, so we still need to solve these problems to make the classification more precise. The AIS algorithm, which is also known as clonal selection algorithm (CSA) and a global optimal searching algorithm, is considered appropriate to offset the drawbacks of K-Means algorithm in the paper.
Clonal selection algorithm is an emerging intelligent algorithm which is inspired by the immune system. It uses the diversity of immune system to maintain population diversity so that it can avoid the “premature problem” in general optimization and get the global optimization [27–29]. The detail description of this algorithm is presented in this paper [30].
According to the defects of the K-Means algorithm, the purpose of CSA in this paper is to find the best initial centroids of the clusters, which ensure that the classification result is the global optimum and our outliers' detection rate is high. The application of CSA applied in our paper can be described as follows.
In our K-Means algorithm, the squared error function J in (6) is the judgment standard of classification result, so we choose J as the objective function and the affinity. Because our purpose is to find the best initial centroids of clusters, we define centroids of the clusters as antibody and randomly initialize multiple array of centroids as initial antibody group T:
For every antibody in T, we classify the compressed data with the improved K-Means and record the affinity J. Then we sort the affinity sequence by size. According to the reorder affinity sequence, we select some antibody whose affinity is at the top of the sequence as parent antibody group which is as the initial antibody group in the next round, because the good genes are more likely to be propagated to the next generation according to the genetics. Then clone these antibodies based on the size of affinities. Determine whether or not the classification result calculated with the antibody corresponding to the minimum J meets the end condition that the J is enough small. If meets, this antibody is the best initial centroids of clusters, which can ensure the classification result with K-Means is best. Otherwise, it will continue the following steps. Process these antibodies selected in step (4) with the operation of clone, crossover, and mutation to format a new diversity generation of antibodies group. If the number of iteration has been arrived, then the process is also finished; otherwise turn to step (3).

After the above process, we can find the more ideal initial cluster heads and get the more accurate classification than initial K-Means algorithm. As a result, the normal and abnormal sensor data will be selected to different cluster more effectively, so our algorithm can have higher detection accuracy while the false alarm is lower. However, an effective outlier detection algorithm in WSN not only need to have high detection rate but also need to satisfy the characteristic of sensor data and constrained resource. Compared to other algorithms, the advantages of our algorithm are shown in Table 1.
The comparison of characteristics.

As shown in Table 1, compared to other algorithms, our algorithm can satisfy more requirements of outlier detection in WSN.
3.3. Pseudocode of Our Algorithm
Based on the previous introduction of every part in our algorithm, Pseudocode 1 is used to describe the whole process of our algorithm.
Input: Original data from every sensor Output: abnormal sensor and outlier data For original data from every sensor (1) Compress data with improved PAA algorithm in each node and get compressed data ( (2) All nodes send the compressed data of the same time to the base station. (3) Initialize the antibody group T and set the initial number of iteration as 0. (4) While (The number of iteration has not been reached the specified value) (5) For each antibody in T: (6) Classify all the compressed data with improved K-Means algorithm and calculate the affinity J (7) End the classification. (8) Sort the all affinity by size and choose these antibody at the top of the reorder sequence as patient antibody group. Then clone these antibodies based on the size of affinities. (9) Determine whether or not the minimum J meets the end condition (10) If (it does) (11) Jump out of the loop of optimization and end the classification (12) Else (13) Process the patient antibody group with the operation of clone, crossover and mutation to format a new diversity generation of antibodies group. (14) The number of iteration plus one. (15) End the processing of optimization and select the antibody in first line as the best initial centroids of clusters. (16) Classify the compressed data with the selected antibody and pick out the abnormal compression data. (17) Judge the abnormal type based on the location of the abnormal data.
4. Experimental Evaluation
In order to evaluate the performance of our proposed algorithm, experiments were carried out based on two synthetic anomaly datasets and some real medicine datasets commonly used in anomaly detection. The name and detail source of these datasets are shown in Table 2. For comparison, the K-Means algorithm without AIS is used as baseline.
The experimental datasets.

4.1. Experimental Setup and Evaluation Metrics
Our simulation is conducted in MATLAB. We assume that knowledge of sensor node locations is available at the base station. We do not assume any specific routing or medium access protocol in this network or make any assumptions on the node density of the network because our algorithm is not for a particular application scenario.
Detection rate (DR) and false alarm rate (FAR) are used to evaluate the performance of our outlier detection algorithm. Detection rate is the ratio of correctly detected outlier data to the total number of outlier data. The false alarm rate is the ratio of the number of normal data which is incorrectly detected as outlier data to the total number of normal data.
The number of abnormal data is very few in general, so we will select the cluster where the number of data is minimum as outlier cluster and calculate the DR and FAR depending on these data in the outlier cluster.
4.2. Experimental Results
4.2.1. Decision of Related Parameters
As shown in the process of our algorithm in the chapter 3, the compression ratio K and the number
DR (%) under different K and

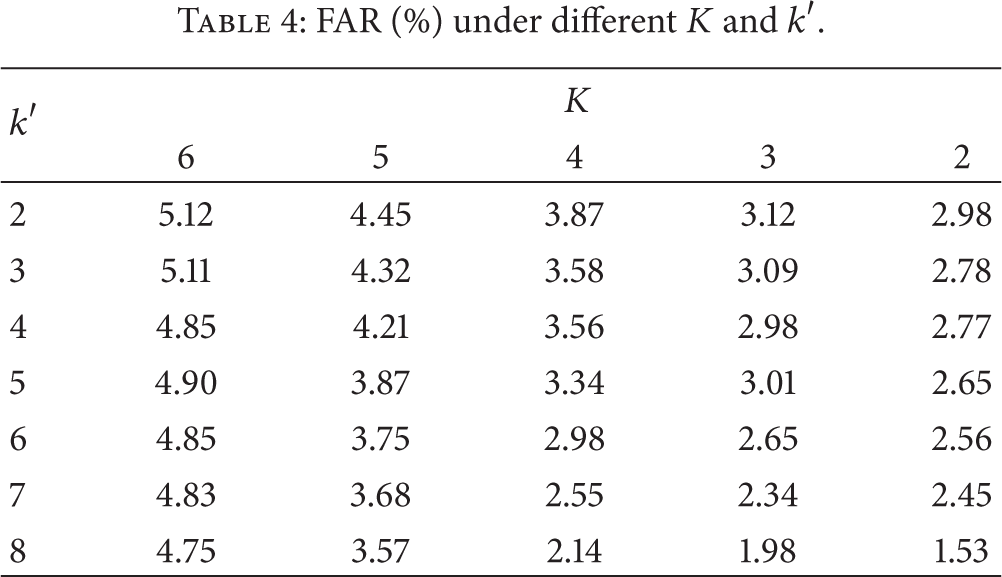
FAR (%) under different K and
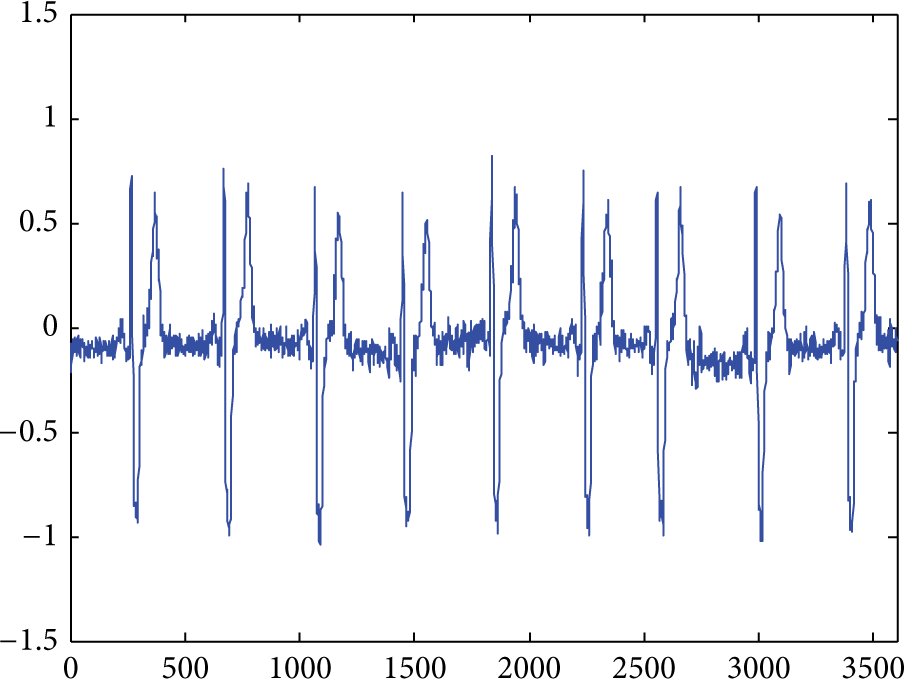
The database of stdb_308.
According to the described algorithm in last chapter, the smaller K is, the less the data information after compressing loses, and the more accurate the detection is. On the other hand, the larger K is, the better the effect of compression is and the more the energy is saved. For the parameter
As shown in Tables 3 and 4, the results are in accordance with theoretical analysis. However, in order to balance the energy saving and effective outlier detection while considering the calculation amount, we determine that K is 4 and
4.2.2. Results of Outlier Detection
With K and
The experimental results.

As shown in the Table 5, the performance of our algorithm with every database is obviously better: DR is higher and FAR is lower than the algorithm without AIS. The reason is that our algorithm adopts the AIS algorithm to ensure that the result is global optimization; on the contrary, the other algorithm is depended on the initial cluster centers so that the result of every experiment is local optimum and unstable. In addition, although the original data is compressed before outlier detection, the DR of our algorithm in every line is higher than 95% while the FAR is lower than 5%, so our algorithm is an ideal and effective outlier detection system in WSN, which can ensure high detection rate while the false alarm rate is low.
However, there is more or less environmental noise in the actual application situation, which makes the original change, so we artificially add Gaussian white noise in the original signals and conduct the experiments again to test the robustness of our algorithm. We take the Ma_Data (Ma), Stdb_308 (Std), and Synthetic_control (Syn) databases as examples to carry out the experiments, and results are shown in Figures 3 and 4. Figure 3 shows the DA of these databases with different SNR and Figure 4 shows the FRA with different SNR.

DA with different SNR.
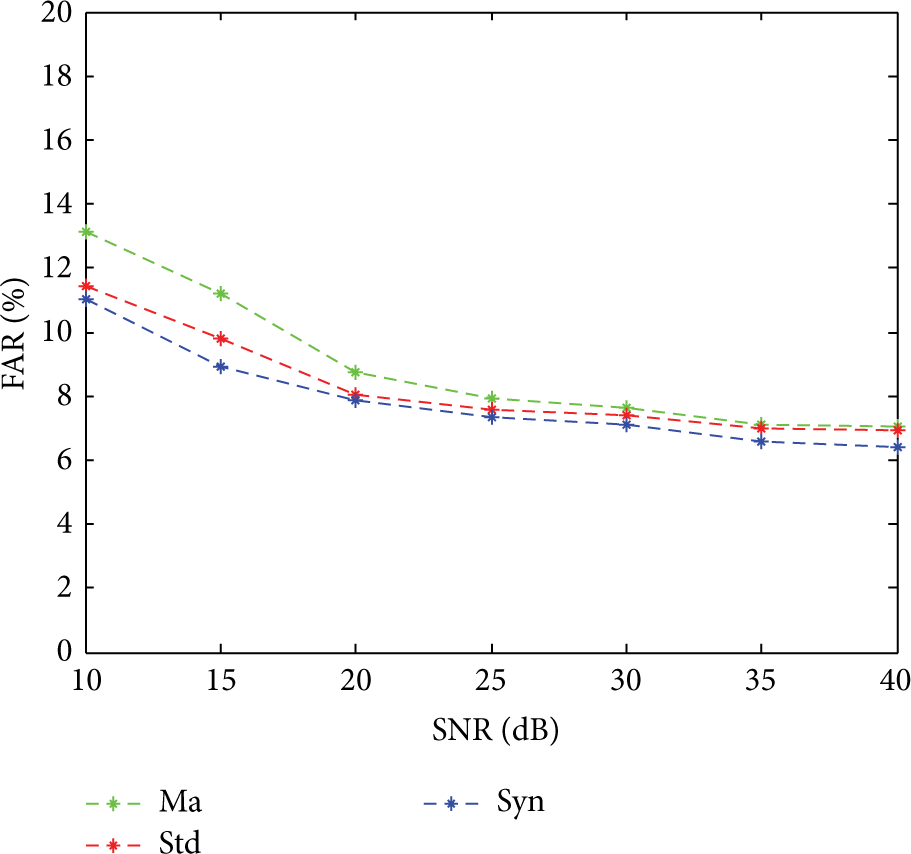
FAR with different SNR.
As shown in Figures 3 and 4, we test the robustness of our algorithm under several Gaussian white noise with different signal to noise ratio (SNR). In these two pictures DR has a slight downward trend and FAR is on the slight rise with the reducing of the SNR, because smaller SNR will have a greater influence on original data. However, the DR is still bigger than 85% and the FAR smaller than 15% under different noise, so it is obvious that our algorithm has a good robustness on resisting noise.
4.2.3. Analysis of Energy Saving and Real-Time Performance
Compared to other outlier algorithms, another advantage is our algorithm can prolong the network life because the PAA algorithm reduces the amount of sent data. For example, for the database of stdb_308, the number of sent data will reduce to 1800 from 3600 when K is 4, so the network can save half of the energy, and the network can save more energy when K is more.
Some outlier detection methods which combine with data fusion algorithm reconstruct the original data before detecting. However, the reconstruct process of a data fusion algorithm usually need long time, so it will lead to poor real-time performance of algorithm. Our detection algorithm directly deals with the compressed data, so it can have a better real-time performance.
4.2.4. The Comparison of Our Algorithm with Other Outlier Detection Algorithms in WSN
In order to show the effectiveness of our algorithm more clearly, our algorithm will be compared with these algorithms listed in Table 1. The databases stdb_308 is selected to do the relevant experiments. For every algorithm, we will choose the optimal parameters settings according to every initial paper. In addition, we will take the average value of 100 times experiments as the final experiments results to ensure the reliability of the experiments. The comparison result is shown in Table 6.
The comparison of several algorithms.

As shown in Table 6, the DR and FAR of our algorithm are both the best among above algorithms. Because we combine the AIS with K-Means to optimize the classification results, it can detect outliers effectively. Also, our algorithm can save energy consumption best compared with other algorithms, because the function of PAA ensures that the lifetime of network can be prolonged effectively. Because there is no the process of data compression in the algorithm proposed by Zhang et al. [4], in which the time consumption is less than in our algorithm. However, because the PAA, K-Means, and AIS are lightweight methods in our paper, the time consumption of our algorithm is less than the time consumption of the other two algorithms.
5. Conclusion and Future Work
In this paper, we propose an outlier detection algorithm for detecting abnormal compressed data in WSN. In the first phase, we utilize the PAA algorithm to compress the time series data in each node so that the communication overload can be reduced and the life of battery is prolonged. Based on the result of PAA, we then combine the improved unsupervised detection algorithm of K-Means and the AIS to effectively classify the normal and abnormal. The major advantages of this algorithm are that it is based on the compressed data so that the energy consumption is reduced, and our algorithm can achieve a high detection rate while the false alarm rate is low. Relevant experiments on virtual and real data demonstrate the effectiveness of our algorithm in detecting the outlier and resisting noise.
A potential limitation of this approach is that the time cost increased obviously when the data volume is huge, because every data need be reclassified with the new centroids of the clusters until the classification ends and the search time of optimal initial centroids of the clusters is long. Another limitation is that, in this paper, our detection algorithm is based on univariate data while the data is more complex in some application of WSN. Therefore, in the future, our work is to improve our algorithm so that it has a better real-time performance and can be more suitable for detection of multivariate data.
Footnotes
Conflict of Interests
The authors declare that there is no conflict of interests regarding the publication of this paper.
Acknowledgments
This work was supported by the National Natural Science Foundation of China (Grant no. 61271274), key project of Natural Science Foundation of Hubei Province of China (2011CDA069), general project of Natural Science Foundation of Hubei Province of China (2010CDB04203, 2011CDB339), and Key Science and Technology of Hubei Province of China (2012BAA02003, 2011BAB042). The authors also gratefully acknowledge the helpful comments and suggestions of the reviewers, which have improved the presentation.