
Abstract
We present our experience with design, development, deployment, and operation of a nation-wide network of mobile Internet measurement probes. Mobile internet is becoming increasingly important, with new technologies being deployed on a regular basis. In the last decade we have seen a transition over a multitude of data transmission technologies, from EDGE, UMTS, and HSPA to LTE, with 5G already on the horizon. This presents an extremely heterogeneous environment where problems are difficult to pinpoint, because of either the fast changing radio channel conditions, daily mobility of the user base, or a number of fallback technologies that are available at a specific location and chosen by the terminal itself. To quantify these conditions, we have developed a mobile internet measurement probe called QMON, which can be either statically deployed or used in drive measurements and is able to collect hundreds of key performance indicators on physical, network, and application layers of the network stack, acting at the same time as an event-driven real-time sensor network and a batch-mode detailed data collection device. In this paper we expose some of the design considerations and pitfalls; among them are the problems of managing and monitoring the remote probes that measure the same communication channel that is also used for their control.
1. Introduction
In recent years, mobile Internet connectivity has become ubiquitous, enabling a plethora of new apps and services. Worldwide, deployments of 4G networks have significantly reduced the mobile data latencies and increased the available throughputs and are quickly closing the gap with fixed technologies [1]. With work on 5G technologies already underway, the future of mobile data seems brighter than ever—enabling everything from HD and Ultra HD video streaming and virtual reality on the go to connecting billions of devices to the Internet as a part of the Internet of Things (IoT) paradigm [2].
However, the reality of real-world mobile networks is more complex, further complicated by legacy system constraints and a need for seamless transition between technologies. Due to the fast progress of the latter, mobile networks are constantly evolving. This means that often many heterogeneous technologies coexist in the same location and in the same mobile system (e.g., 2G, 3G, and 4G) [3]. In addition, compared to fixed networks, which operate in a relatively stable environment [4], the last mile in mobile networks is a radio channel that can be subject to radio interference, coverage issues, or traffic spikes due to daily user commuting.
This makes such networks increasingly complex [5] and difficult to tune, as it introduces a wide variety of physical layer parameters the operator needs to monitor and adjust when optimizing it [6]. Firstly, on the radio layer, multiple concurrently available network technologies on different frequency bands provide different channel bandwidths, capacities, and latencies and have different coverage and energy efficiency [7]. Next, on top of the radio layer, different network protocol stacks exhibit different performances (IPv4 versus IPv6, TCP and multipath TCP versus UDP, etc.). And lastly, what the user sees is only the performance of the applications and services, which is subject to yet another set of conditions (application behavior and optimizations, hardware capabilities, and server loads).
To address this challenge, we have designed and implemented a distributed multilayer measurement system called QMON [8]. It is a cloud-managed system of probes that perform a wide range of measurements, some of which are done by emulating the user activity on the application layer. The system thus collects vast amounts of data on multiple layers of the network stack. Special attention was given to layer 7 web-based services and applications, with the rationale that L7 metrics of modern services are most indicative of the users' level of satisfaction. In addition to quantifying the users' level of satisfaction, the collected data also enables better understanding of the network and makes future optimizations possible, on both the network and physical layers. For example, it can be used to adaptively route the traffic and perform the best path selection, provide configuration for a software-defined network (SDN), or guide the providers in either manual or automated physical layer optimizations [9].
In this paper we describe how we designed and implemented the system from the point of view of data capture and exchange and outline the practical experience we had with deployment and management of a number of probes deployed at dozens of fixed locations as well as in vehicles for performing the periodic drive tests.
2. Related Work
Many solutions exist for monitoring communications networks and Internet services, both commercially and as research projects. Some crowdsourced application-layer solutions that have existed for long are Speedtest.net [10] and Grenouille [11]. For example, of a crowdsourced network-level solution, see RIPE Atlas [12].
However, to gain better insight into the network, the whole stack needs to be taken into account and a cross-layer solution is needed, addressing physical, network, and application layers. In this area, due to necessary collection of data from mobile hardware, the number of solutions quickly plummets. Apart from research efforts such as QoE Doctor [13], not many practical products exist to address the measurements and monitoring of the last generation commercial mobile networks. In addition, commercial solutions typically lag behind the state of the art in consumer off-the-shelf mobile radio hardware, while their high price also prevents the use of such equipment on a larger scale, for example, as a part of an IoT system. Only recently has the trend of deploying measurement and sensing probes on a large-scale and using data analytics to gain insight become viable, owing primarily to the lowering prices of the hardware components. For example, [14] describes a project named SITEWARE, a distributed network, and Quality of Service (QoS)/Quality of Experience (QoE) measurement platform that leverages big data and allows network optimization. Our research and presented solution is similar in the way it addresses cross-layer data collection and measurements; however, it places more focus on practical implementation and deployment with mobile operators. Our solution also tries to achieve a good trade-off between real-time awareness and the option of a detailed historical drill-down analysis, while the autonomous operation in adverse network conditions requires it to have a nonnegligible portion of the system intelligence on the probe itself.
3. System Constraints
Our guidelines and resulting constraints for the system were primarily inspired by the need for scalability, manageability, and autonomy, while achieving a trade-off between real-time feedback and detailed drill-down analysis. Below we present them in more detail:
Scalability: effortless deployment and distributed operation enable low cost large-scale data collection for longitudinal case studies, trend analysis, and optimization, which are simply not attainable with small or short-lived deployments. Central control to orchestrate the network of agents: this allows it to perform both synchronized measurements and stress tests. Agent autonomy and robustness: in case of possible network problems (which can be commonplace in mobile environments) the agent should have enough intelligence to survive and continue doing useful work on its own. The main functional requirement: it is related to the mobile network monitoring use cases, namely, to be able to emulate user activity by using up-to-date software and services. This includes measuring response times and other KPIs on the application layer, while at the same time collecting as many network and physical layer parameters as possible. Hardware constraints: they provide a variety of radio network data parameters (using the modem as a sensor), as well as USB and GPIO for connecting additional sensors (GPS, temperature). With all other things being equal, we prefer off-the-shelf hardware to drive down maintenance costs.
4. System Design
The architecture of the system is presented in Figure 1. The measurement probe hosts the main component of the system, the software agent that performs the measurements and collects mobile system parameters. The agent interfaces with the hardware to collect mobile radio parameters, performs user emulation, and stores the results in an XML file. For the basic performance indicators, as soon as the results are obtained, they are pushed to a real-time event processing engine that allows monitoring of the system in real-time. When the entire measurement cycle is completed, the results are uploaded to a data server, where they are parsed, stored in a database, and enriched with GeoIP data and data from the ARIN/RIPE database.
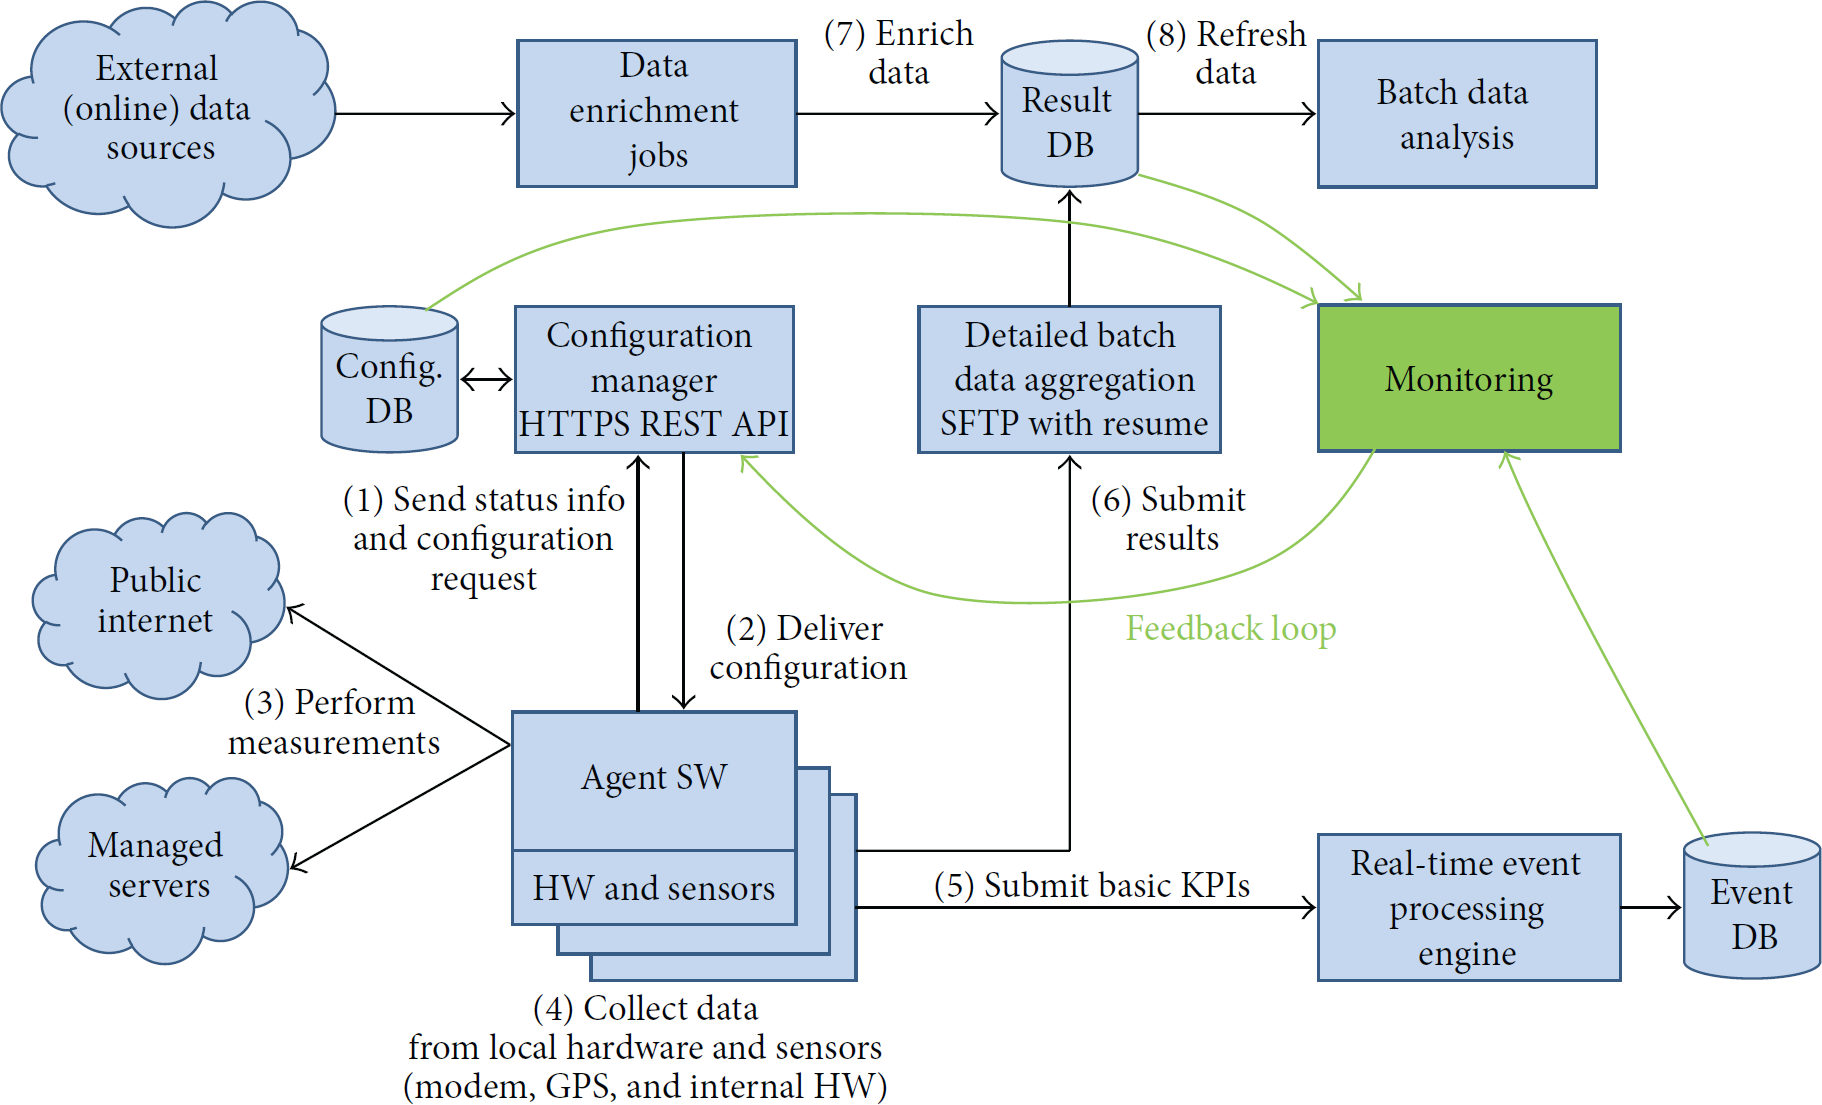
System architecture and main data flows. Green color denotes the monitoring subsystem.
Below we further outline how the system design addresses some of the key constraints and problems.
4.1. Probe Autonomy
Since the probes can be deployed in remote or even inaccessible locations, probe autonomy is of the highest importance. This is further complicated by the inherent planned communication blackouts to avoid interference with Internet measurements. This makes remote decision making in the cloud impractical, and the agent needs to be appropriately smarter, allowing it to handle different software errors and hardware malfunctions. The latter turns out to happen quite often with commercial firmware of the latest generation of modern peripherals.
Another desired property of an autonomous agent is the ability to operate without the visibility of Command and Control (C&C) servers. This might seem to be a primitive requirement in the era of always-on broadband and redundancy built into the data centers, but mobile coverage is often far from perfect, especially in rural areas. Borders of white spots with no mobile coverage are one of the most interesting spots for an operator or a regulator to measure and monitor, making the need for autonomous operation the norm rather than the exception.
Thus, to satisfy both requirements the remote configuration and agent operation roughly follow the procedure outlined in the diagram in Figure 2.

Agent autonomous operation flow chart.
4.2. Updating and Rollback
To provide bug fixes and seamless roll-out of new features, an updating mechanism is needed. However, it has to be designed in the simplest possible manner, so as to be able to make it as bug-free and fool-proof as possible. If the agent software is corrupted remotely, either it has to be able to roll-back the destructive changes itself, or manual intervention is needed which can often be costly.
We addressed this as follows. The agent first fetches the update package; upon unpacking it, an independent process is started, which performs integrity checks, terminates the agent, moves the old files to a safe location, unpacks the archive, and tries to start the agent. If the agent starts, it terminates the update process; otherwise, if the update process has not been terminated after a certain amount of time, it assumes something went wrong and performs a rollback by deleting newly extracted files, copying the old files back, and restarting the old version.
4.3. System Scalability
Designing the probe with an autonomous agent worker makes the scalability of the sensor node trivial; all operations on the side of the agent can run independently and thus concurrently. Probe deployment is further facilitated by the unique agent GUID (see Figure 2) which is generated upon first start and is used for agent identification in all subsequent communication.
Thus, only the remote configuration (Figure 1, steps (1)-(2)), server-side data collection (Figure 1, steps (5) and (6)), and data processing (Figure 1, step (8)) need to be scaled when the number of probes is increased. Although scaling in steps (2), (5), and (6) can be achieved by balancing the load over multiple servers, database query caching can provide significant resource savings in step (2) as well. Finally, a scalable data storage technology should be used in the system as well, in the form of either an eventually consistent NoSQL database, or a sharded relational database.
5. Implementation
The probe is implemented on an industrial x86 computer with the latest generation of mobile modem hardware. Based on the Linux OS and the agent software developed in Python, the agent fetches the data over a REST API from the management server and performs the measurements in a cycle, using a variety of protocols and methods.
On the physical layer, the following parameters and metrics are collected directly from the modem hardware:
Radio access technology used (LTE, HSPA, UMTS, or EDGE). Received Signal Strength Indicator (RSSI). Transmit power. Radio state (RRC idle or RRC active). Multiple HSPA-specific parameters: frequency band and channel, receiving levels for individual carriers. Multiple LTE-specific parameters: signal-to-interference-plus-noise ratio (SINR), frequency band, channel bandwidth, Reference Signal Received Power (RSRP), Reference Signal Received Quality (RSRQ), Tx and Rx channels, and so forth. Various mobile channel identifiers (operator name, operator code, cell ID, local area code, tracking area code, etc.).
Collection of these parameters allows the operator to capture exact mobile radio context of the measurements; since many of the parameters (including the technology and the base station) change due to environmental factors or user mobility, this can give insight into any sudden performance degradation.
On the network layer the metrics are obtained by actively generating service and application traffic between the probe and the network elements or servers either in the operator's network or in the public Internet. In some cases, the amount of traffic generated is limited only by the link speed and measurement duration, which can lead to significant mobile data usage; when such high-throughput measurements are required, their frequency can be adjusted to reduce the amount of traffic transferred. The following metrics are captured on the network layer:
ICMP ping to estimate round-trip times (RTT) on the network level. Traceroute to determine the measured path of the individual measurements. Uplink and downlink throughputs using both TCP and UDP traffic.
On the application layer the user actions are again actively emulated, using either actual applications or headless application-scripting frameworks:
HTTP and FTP upload and download throughputs. DNS resolution times. Web-based metrics, performed by emulating user requests for page loads. Duration needed for the page to load that is captured, as well as the total payload of the page, number of connections, and connection times. In addition, based on the duration of web page requests, Mean Opinion Score (MOS) for web browsing that is also calculated.
Finally, contextual data, such as hardware temperature, system load, and probe location are collected. Location information is obtained from a GPS receiver module, but, in case of indoor use, one of the possible alternatives could also be WiFi positioning [15].
A number of open source projects were used to gather the described metrics and KPIs, ranging from GNU ping, traceroute, wget, and iperf, to the scriptable browser engine PhantomJS [16].
A significant part of the network and application-level tests could have also been implemented as a smartphone app, making the solution more cost-efficient and easier to deploy. However, the amount of physical layer indicators and metrics that can be acquired on such devices is very limited in comparison to dedicated mobile modem hardware. The main reason for this is that the sandboxed environment of mobile apps does not allow the necessary low-level access to the hardware. At the same time, mobile phone hardware would be very heterogeneous, offering nonuniform sets of capabilities and incomparable datasets.
6. Data Processing Pipeline
Data processing combines two independent data pipelines that serve different purposes: (1) an event-driven pipeline that is based on real-time KPI delivery, and (2) a batch postprocessing pipeline based on commercial Business Intelligence (BI) tools. This combination allowed us to get the best of both worlds: fast response for basic metrics and big-data-sized detailed results for drill-down analysis. Such approach proved extremely valuable due to the fact that the network resources are completely unavailable when measurement process is in progress and can be sporadically constrained otherwise due to poor coverage.
6.1. Real-Time Event Processing
The purpose of real-time processing is to be able to monitor the state of the mobile networks in real-time [17]. This is useful either for operators when making changes to the network, or while driving to get the instantaneous feedback on the coverage, network parameters, and system behavior. This can be seen in Figure 3 (Figure 3(d) showing the real-time status in the mobile app and Figure 3(c) showing the web-based real-time dashboard).

System implementation building blocks: (1) agent management Web GUI; (2) industrial-grade probe hardware; (3) mobile dashboard displaying agent status for drive measurements; (4) real-time dashboard displaying measured KPIs; (5) drill-down analytics using a professional BI tool.
Real-time event processing fuses historical data, KPI events delivered by the agent, and the information stored in the database of the C&C server (fetched over an HTTP API). For triggering alarms based on the combination of events, a rudimentary complex event processing (CEP) engine with windowing support was deployed that checks for concurrent occurrence of multiple conditions and tracks moving averages of KPIs.
6.2. Batch Processing and Data Analysis
The detailed results are delivered in the XML format after the measurement cycle is completed. The use of plaintext XML files simplifies the data management, resubmission of failed files, and checksumming and allows manual collection of large amounts of data when uplink is not adequate. Uploaded files are regularly parsed to a database and archived as the reference copy, making it easy to replay events on a different server or to track down problems with the data processing chain. Once parsed, the data is stored in a database, which serves as a data source for import into the BI solution. However, such multistaged process means that in the worst case the generated reports lag a couple of hours behind the state of the network.
6.3. Data Processing Pipeline Limitations
The size of collected result-sets can range from 1 KB per measurement cycle (e.g., a single measurement with results and metadata) to multiple megabytes per cycle (for hundreds of measurements). The size of the results is in addition to the amount of reported details also correlated with the duration of the cycle. The average data rate per agent in our deployment is thus currently at around 3 kbit/s per probe, with log data accounting for another 8 kbit/s. At this rate, a single upload server with a gigabit network interface could accommodate tens of thousands of probes. On the other hand, the amount of data collected grows quickly, with 1 GB/probe/month for results data and another 2.5 GB/probe/month for logs (where enabled). We have addressed this with sharding of results and by discarding the old log files.
However, due to the constraints of the measurement process, which should not be interrupted by the transmission of the results, the available slots for communication with the backend can easily be underallocated, especially on slow mobile links; this requires special caution when configuring the system, to achieve the right balance between the measurement and results upload time slots.
6.4. Experimental Results
Two examples of measured results obtained by the system are shown in Figure 5. The map on the left depicts an area of the city of Ljubljana, together with the locations of mobile cell towers. Red and green dots represent measurements obtained during a drive test, with the color indicating the LTE Reference Signal Received Power (RSRP). The circled area of the city clearly exhibits low RSRP. The metadata associated with each measurement can be used to determine which base station is serving the area, what frequency and frequency band were being used, the speed of the vehicle when the measurement was performed, and if a handover between base stations occurred. In addition, the effect of poor signal strength on the actual download and upload speeds can be estimated, determining how the user perceives the problem.
The right side of Figure 5 shows a cumulative distribution function (CDF) and a histogram for LTE download (DL) and upload (UL) speeds. It can be seen that higher speeds were achieved at 1800 MHz using a 20 MHz band (upper blue histogram) than at 800 MHz using a 10 MHz band (bottom blue). Similarly, upload speeds were higher at 1800 MHz using a 20 MHz band (upper red histogram) than at 800 MHz using a 10 MHz band (bottom red). This is expected behavior; however, it shows how varied the root causes for poor performance can be: in the range of the radio access technology used (LTE or HSPA, UMTS or EDGE fallback), actual poor signal strength, handovers due to user mobility, used frequency and bandwidth of the base station, and congested or misconfigured network core or overloaded application servers. By collecting as much context data as possible for each measurement, the main reasons for poor performance can be quickly discovered and addressed.
7. Management and Monitoring
7.1. Remote Agent Management
Monitoring and remote management of probes with the primary purpose of network measuring are especially challenging, since the communication channel and the measurement channel are the same, even more so because the channel needs to be torn down and set up multiple times when changing measurement parameters (e.g., switching between mobile technologies) or measuring the time needed to connect to the network.
We have solved this in the following ways:
No unnecessary services are running that could cause unwanted traffic while measurements are in progress. No persistent connection or tunnel is established between the agent and the server-side, which ensures the measurements are not influenced by monitoring and remote control traffic. Therefore, all management and remote control must be initiated from the agent during the idle period.
However, this puts a lot of responsibility on the agent itself, since it must remain completely autonomous and capable of recovering from any possible situation. For this reason, we have implemented an internal state machine that retries certain actions (e.g., mobile modem commands, if the modem fails to connect to the network with the desired technology) or initiates a soft reboot. If the modem drivers hang the system irrecoverably, a hardware watchdog initiates a power cycle.
Finally, for the cases when a remote and inaccessible probe gets completely cut off the Internet, we have added an out-of-band communication channel that leverages the same hardware, SMS text message. This allows limited communication when the probe is completely stuck without connectivity and manual intervention is needed.
7.2. Monitoring
Remote monitoring happens on four different fronts, which are leveraging the data connected at different points in the system, as follows:
Configuration C&C dispatcher receives an event when an agent fetches a configuration; the request happens over an HTTPS get, and the same request is used to piggyback some metadata about the current state of the probe and the agent software. In this manner, vital statistics about the CPU, memory, and disk utilization are collected, as well as a number of controlled (intentional) and uncontrolled (unintentional) reboots. Real-time dashboard receives events for basic KPI results; this allows the user to monitor the state of the network, but the presence, frequency, and payload of the events also carry the information about the measurement system itself, which makes it a valuable source for monitoring. The detailed XML results include over 500 different KPIs covering physical, network, and application layer. Since these result files can become large, FTP was used as a protocol for syncing the measured and gathered data with the server. This can only be processed in a batch mode, as the results are pushed to the server only after the measurement cycle is completed. Similarly, the log agent files containing different levels of debug information are as well pushed to the server, but only after a cycle is completed; this, however, is useful only for historical trending, analysis, and root cause discovery, due to time lag.
Thus, the monitoring process is multistaged. Firstly, the previous conditions of the probe are updated, when the agent fetches configuration, at the same time reporting the previously dispatched configuration, CPU, memory, and disk utilization, as well as their historical trend. Next, when basic KPIs are delivered immediately after the measurement, this serves as an agent heartbeat. Finally, when the entire measurement cycle is complete, the results and logs are uploaded in their entirety. These can be imported into an analytics tool and used to discover past trends and anomalies, which serve to guide development of further features, creation of filters, and setting the thresholds for alarms. For example, the peak in Figure 4 shows an anomaly detected from historical logs of the management server (configuration dispatcher): a single rogue probe was hitting the server with thousands of configuration requests per day due to an unhandled exception, which caused it to abort the measurements. Occurrences such as this can serve to train the complex event detection engine, which is then able to detect similar anomalies as they happen, reducing the time needed to respond and fix the problem.
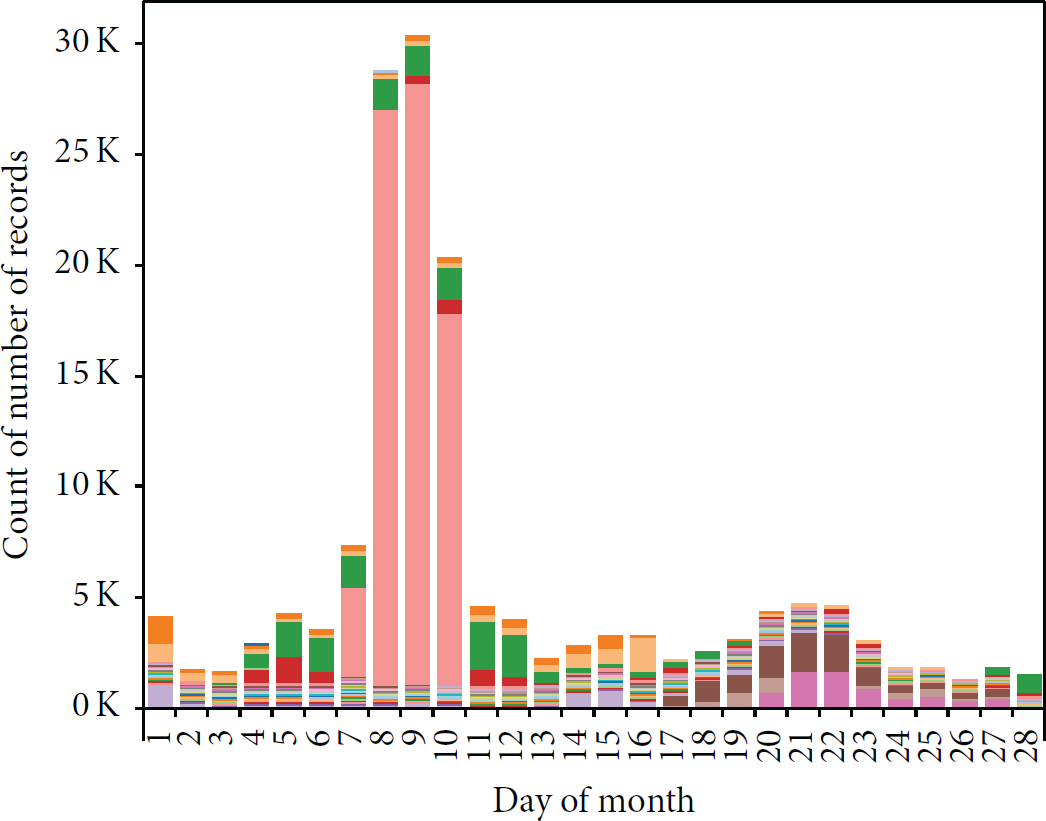
Inferring operation anomalies from the number of log events for configuration requests; February 7–10 clearly shows a peak which had to be investigated. Such occurrences found in historical data can serve to train CEP filters to detect similar anomalies in real-time in the future.
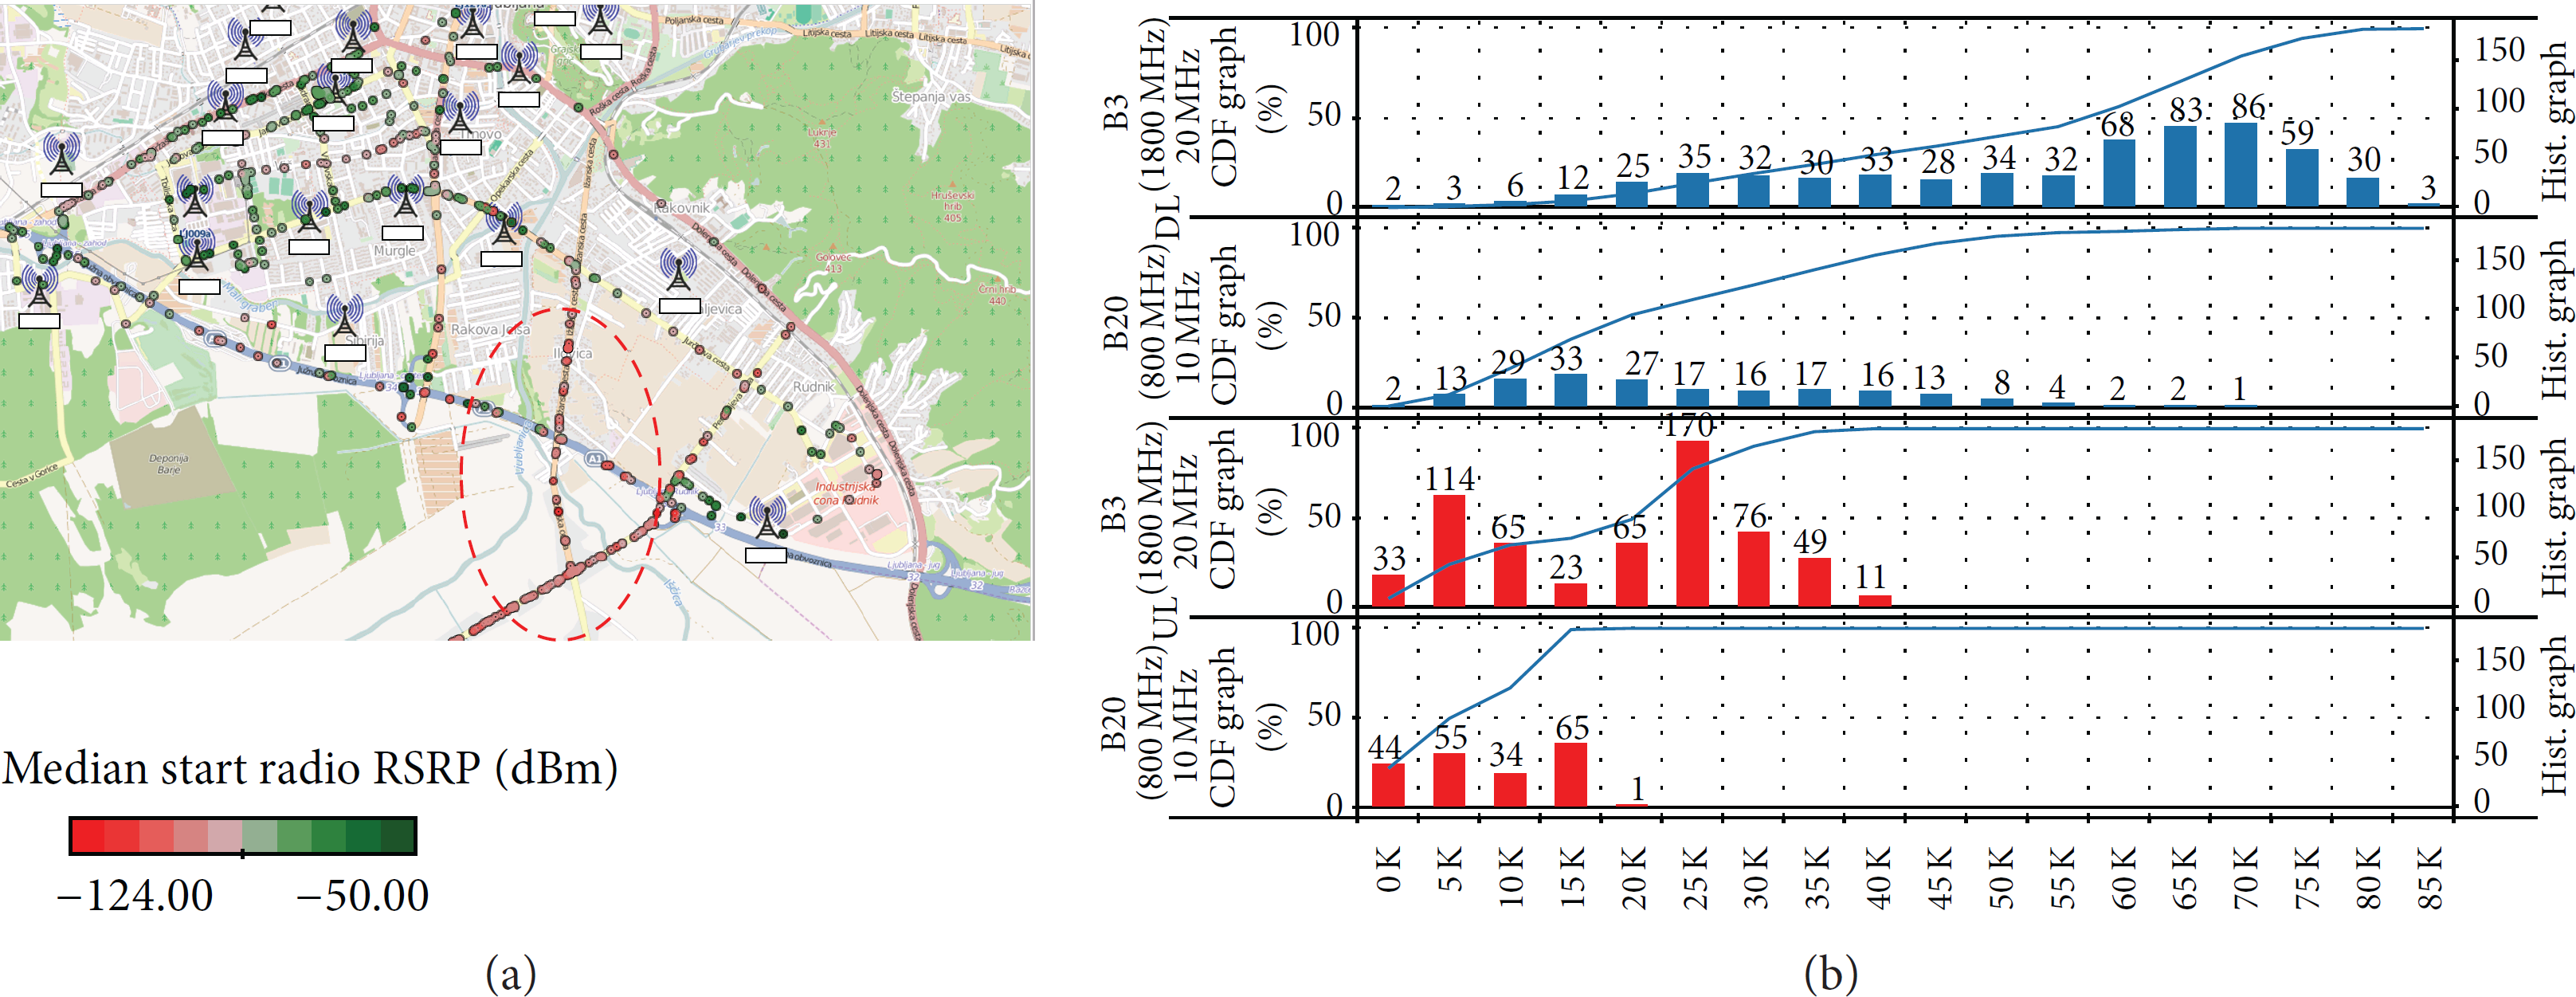
Two examples of the results obtained with the presented measurement system. (a) A map of Ljubljana with points indicating a probe during a drive test. The color of the points represents LTE Reference Signal Received Power (RSRP), while the map also shows location of the deidentified mobile cell sites. Dashed red ellipse indicates an area of low RSRP signal strength. (b) Cumulative distribution function (CDF) and histogram charts for mobile LTE download (blue) and upload speeds (red); both are shown at different LTE frequency bands (1800 MHz using the 20 MHz band—upper blue, upper red—and at 800 MHz at 10 MHz band—lower blue and lower red charts).
8. Conclusions
In this paper we presented the design of a distributed multilayer mobile network monitoring solution that is remotely managed and operates as a wide-area sensor network. The probes push the data in two modes, basic real-time indicators for instantaneous feedback and detailed measurement results that allow the operator to gain deep insights into the mobile network. The solution has been deployed and is successfully being used or evaluated by multiple mobile network operators in Central and Eastern Europe.
Footnotes
Conflict of Interests
The authors declare that there is no conflict of interests regarding the publication of this paper.
Acknowledgments
The research and development work was in part supported by the European Commission (CIP-ICT-PSP-2011-297239), the Slovenian Research Agency under Grant Agreements P2-0246, L2-4289, and L7-5459, and Internet Institute, Ltd.