
Abstract
River water quality is directly related to the wellness of its neighbors. Because the West Nakdong River has long suffered both from the infiltration of sea water and from the inflow of turbid wastewater, inconsiderate use of this water can cause disastrous result to nearby agricultural areas and neighbors. Busan city in Korea had deployed a pilot USN (ubiquitous sensor network) system that monitors this river and nearby tube wells to properly react to those situations. In this paper, we have designed a system that predicts salinity level of groundwater while monitoring the electrical conductivity (EC) values of sensors in that USN. We use a hybrid method that combines pattern-based approach together with statistical regression model to analyze sensor data. After classifying past sensor outputs into several characteristic patterns, we trace each day's change to identify base pattern of that day and thus predict the next value of sensor output. Since the detection of each day's pattern takes some time, we need to incorporate statistical regression model as an interim prediction method. Through an experiment that compares the hybrid model to previous statistical regression model, we have shown that our hybrid model is more accurate to predict the sensor's movement.
1. Introduction
Human reliance on groundwater has increased dramatically over the past 30 years. Groundwater has been widely developed to keep up with the soaring demands of our daily lives. Simultaneously with the development of our groundwater the need to protect those resources from contamination and depletion has come. At especially the islands and coastal areas where the quantity of groundwater is limited, contamination and depletion have always been the important community issues. In those areas, there are many reports that say excessive pumping of groundwater triggers infiltration of sea water and thus causes shutdown of domestic wells [1–4]. For the sustainability of groundwater resources, wiser usage and practices are needed more than before.
The West Nakdong River where the slope of riverbed is extremely gentle (0.83 m/km) is one of such areas that the possibility of sea water infiltration into groundwater is very high in South Korea. This river is widely known with its huge coefficient of river regime (ratio between the maximum and minimum amount of flow) of 1 : 260. For comparison, the Thames and the Rhine have coefficients of 1 : 8 and 1 : 18, respectively. This extreme ratio implies that the landward intrusion of sea-derived salt can arrive far above the upper reaches of river. Since lots of wells around the West Nakdong River provide agricultural water to nearby Gimhae plain where there is the second largest grain district in South Korea, sea water permeation to these wells can be disastrous both to crops and to the community. With the understanding of its importance, Busan city launched a pilot USN system to monitor water quality of this river at the end of 2010. Around this river 10 sensing spots had been chosen, and for each spot two multiparameter measurement sensors had been installed to monitor water level, temperature, electrical conductivity (EC), and depth. Based on these sensor data, an application system that predicts the salinity level of groundwater and diagnoses the sensor behavior has been developed [5, 6].
At the early stage of USN operation, Kim and Ock used basic statistical regression model over sensor groups to predict sensor values due to the lack of accumulated data [5]. After a couple of years, analysis over obtained data has shown that the behavior of sensors in the groundwater repeats several recurring patterns. Previous research has identified top 5 daily patterns of electrical conductivity values that describe 78% of the past data [6]. But Park et al. did not suggest a clear decision rule to identify the pattern of the day. In order for the prediction model to work in a real system, we need to develop a detection mechanism that identifies each day's pattern as early as possible. The main contribution of this paper lies here. In this paper, we suggest detection logic to identify these patterns at early time of the day. Since detection takes time for a certain pattern, we suggest a hybrid approach that incorporates statistical regression model until the daily pattern is identified.
The remainder of this paper is organized as follows. In Section 2, we briefly describe several previous researches on monitoring of river water quality. In Section 3, we present our hybrid approach in detail together with some experiment results. The architecture and operation of implemented system are explained in Section 4. Finally in Section 5, we conclude our research with some future research directions.
2. Related Research
2.1. Groundwater Quality and Salinity
Although contamination of (ground) water due to man has occurred for centuries, nationwide control and governance for this matter are not that far. Among the researches on water quality many are related to the salinity issues since salts have a profound impact on many living organisms. Salinity refers to the dissolved salt content of a substance like soil or water. It may be measured in a number of ways such as parts per thousand (per mille: ‰) or part per million (ppm). Since water shows significant conductivity when dissolved salts are present, EC sensors are frequently used to indirectly measure the amount of salts dissolved in that water. The preferred unit of EC is deciSiemens per meter (dS/m or dSm−1). Other units are microSiemens per centimeter (μS/cm or μS cm−1). In this paper, we deal with the EC value to assess salinity level of groundwater in μS/cm scale (1 dS/m = 1000 μS/cm).
Early researches on groundwater were about assessment models for vulnerability of groundwater like DRASTIC and SINTACS and about their applications to various areas [7–9]. Researches on modeling of groundwater also demonstrate relatively long history of hydrology to understand the dynamics of groundwater [10, 11]. With the advancement of artificial intelligence techniques and the long accumulation of related data, many researches using artificial neural networks (ANN) and fuzzy systems have been conducted. Bowden et al. used neural network model to forecast salinity in a river while focusing on how to determine the optimal inputs for training ANN [12]. Banerjee et al. used ANN simulation over mathematical model to estimate safe pumping rate that maintains groundwater salinity in island aquifers [13]. Metternicht suggested fuzzy logic for a rule-based expert system that assesses land's temporal and spatial changes of salinity [14]. There also lots of researches that focus on implementation and application of ubiquitous sensor networks to monitor water resources [15–18]. Among these monitoring systems, the REON (River and Estuary Observatory Network) for the Hudson River in New York is worth mentioning as one of the most promising efforts. This state-of-the-art monitoring and forecasting network for rivers and estuaries was developed through a partnership between the Beacon Institute for River and Estuaries and IBM. REON utilizes an integrated network of sensors located at stations in and along the Hudson River and other New York state waterways, whereby robotics and other technologies provide real-time data on water inputs, flow and particle movement, and other ecosystem indicators [18]. With this real-time and big-data platform, it is expected to better understand the effects of global warming, the movements of migrating fish, or the transport of pollutants.
All of those researches usually rely on various input data that have been accumulated for a long period of time. Since the characteristics of local environment dominate the dynamics of water system, lots of previous studies are highly specific to target areas. For a recently deployed system like the West Nakdong River monitoring system, simple prediction method that is well customized to local settings can be more effective than a complex method until plenty of operational data are accumulated to the USN system.
2.2. USN System of the West Nakdong River
USN system of the West Nakdong River has suffered the problem of data insufficiency and unstable operation due to its short uptime history. In the previous researches, Kim and Ock introduced a group decision model that used simple statistical approach to predict sensor state [5]. They first grouped 10 sensing spots into 4 decision groups based on their proximity and sensor types as is depicted in Figure 1.

USN sensor groups of the West Nakdong River [5].
Sensor's output is averaged out within each group and this average value is used to diagnose deviation of individual sensor's output from its group. If the deviation of each sensor's output exceeds predetermined threshold range (±3σ), then it is considered as a possible indication of sensor malfunction or groundwater contamination.
Park et al. suggested a different approach that introduces pattern-based method [6]. They found some repetitive patterns on the daily changes of EC values from the 7 tubular wells of the USN system in Figure 1. They argued that the sensors in groups 1, 2, and 3 show somewhat independent and recurrent movements from the external factors such as water temperature, tidal level, and rainfall. With this finding they suggested 5 most characteristic patterns that could describe 78% of original sensor data which are given in Figure 2. They insisted in the paper that a more accurate estimation for salinity level of groundwater could be possible by using this pattern-based approach. They, however, have not suggested how to early identify those changing patterns from the sensor's daily operation, which is very important to successfully implement their pattern-based approach.

Top 5 characteristic patterns of EC values in the West Nakdong River sensors [6].
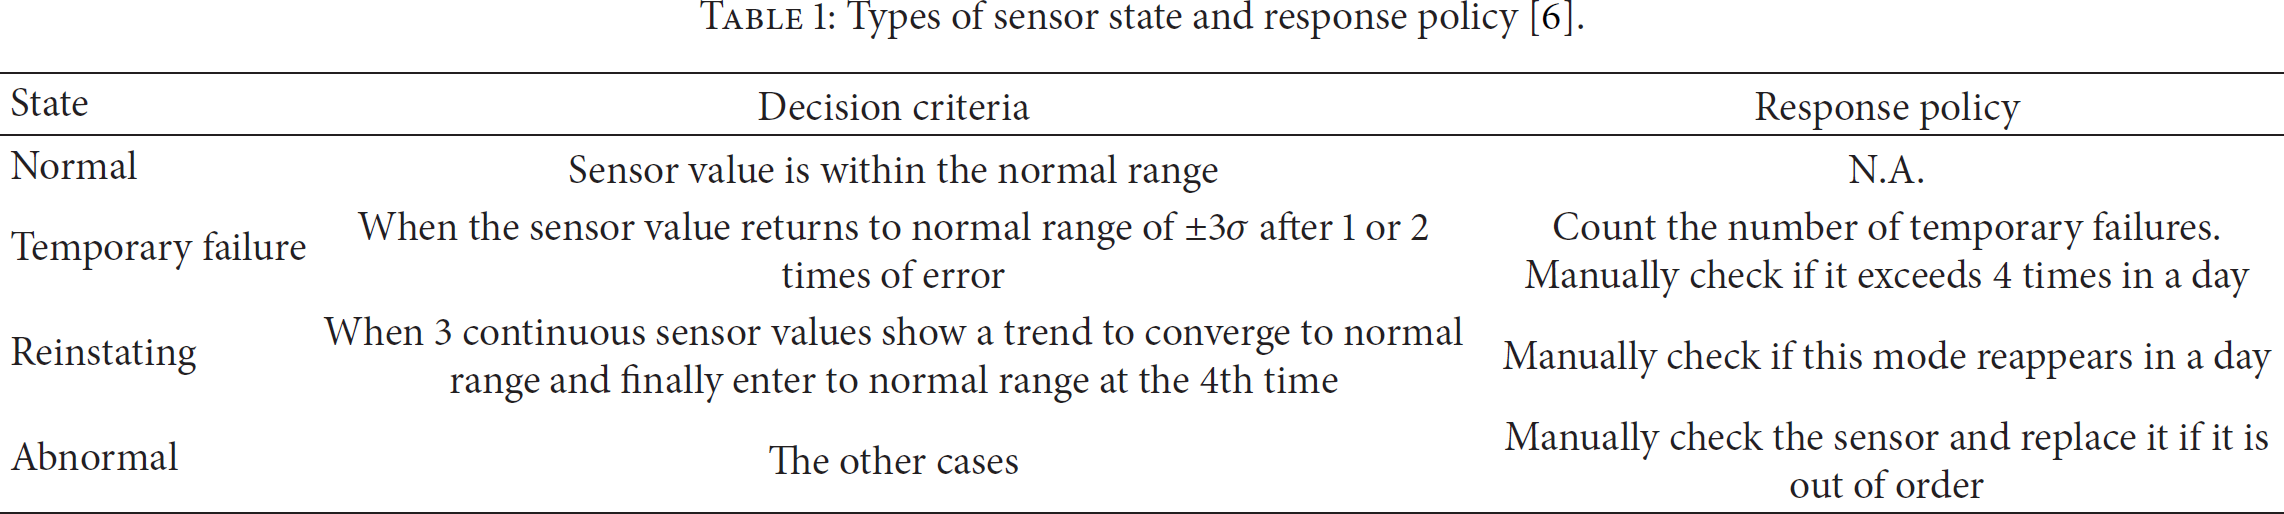
Once we identify each sensor's pattern for that day, then we may predict that sensor's next output value more accurately. Since sensors in the West Nakdong River report their output hourly to the system, if we can early identify the pattern of that day, then we can earn several hours before high salinity level is reached. It may be possible to diagnose that sensor's state by comparing its actual output to expected value for that pattern. Park et al. suggested decision criteria for sensor state that use the number and the degree of deviation from the expected value of corresponding pattern [6]. They identified 4 types of sensor state and their corresponding response policies to handle these situations are given in Table 1.
Types of sensor state and response policy [6].
3. Hybrid Model for the West Nakdong River USN System
3.1. Pattern Detection and Prediction
In this ongoing research, the results of previous two researches are combined to build a more accurate model to predict salinity level with EC value. If we look into 2 sensors' sample data from group 2 given in Figure 3, then we can see that 2 sensors' EC values show similar movement and they lie somewhat stably between 150 and 200 μS/cm. This range of EC value is quite below the warning level (700 μS/cm) for agricultural use of this groundwater. Even though we average out daily changes of all EC values into one representative value and apply moving average method with this value to estimate next day's EC value, we still can get plausible value due to the stable changes of EC value as is depicted in Figure 3. This even holds when a sensor in the group temporarily goes down (as is shown with vertical line that drops to 0 values in Figure 3) since the other sensor in the same group can be used as a reference.

Two-sensor data from group 2 (Jan 1, 2010~Sep 16, 2010).
At every hour, sensors in the tubular wells report their data to the central database of USN system, so we can have at most 24 sensing results (from 12:00 AM to 11:00 PM) in a day for each sensor. Let the average EC value of these 24 sensing results be
If we look closely at the movement of sensors day by day over long time period, then we can see some recurrent patterns that are identified by Park et al. [6]. Figure 4 shows daily changes of two example sensors depicted in Figure 3. To better show the EC patterns we have hidden some abnormal changes from Figure 4 that distort the display like vertical movement that drops to zero due to power failure. As we can see in this figure, two sensors show somewhat similar movements and thus indicate that there exist some iterating patterns. Of course these patterns are different between sensor groups. Among those different patterns, top 5 patterns are identified as is given in Figure 2 at the previous research. Use of these patterns to describe hourly changes of EC values can strengthen previous statistical model with enhanced accuracy. In order for this to work, we need to identify each day's representative pattern as early as possible whenever a new day begins, but some patterns are not easy to identify from the others.

Daily changes of EC values at group 2.
We can see in Figure 2 that there are cases at which we cannot clearly determine the types of next coming patterns until a certain time. Let alone the other 22% of cases that had not been explained by the patterns, the patterned cases of Figures 2(a) and 2(e) are undistinguishable up to 7~8 AM as marked with red lines in Figure 2. However, the cases of Figures 2(b) and 2(c) can be easily distinguished since their movements are heading in quite different directions. Tricky one is the case of Figure 2(d). This pattern shows a kind of bounded random fluctuation between minimum and maximum values of electrical conductivity during a day. If the amplitude of this fluctuation is quite small, then it becomes hard to tell from the patterns of Figure 2(a) or Figure 2(e), until we reach the discriminating time of 7~8 AM. If the slopes of trend lines in Figures 2(b) and 2(c) are close to horizontal line, then those patterns are also hard to tell from the cases of Figure 2(d).
To determine proper pattern for a new day, pattern-based approach needs time up to 7~8 AM for the patterns to be fully differentiated between themselves. During that time interval, prediction for EC value can be based on a simple regression model just like the group decision model. To predict individual sensor's hourly movement, we use prior 8 hours' EC values. If the EC value at time t for ith sensor of group k is

Pattern determination in hybrid model.
Since the movement in the patterns of Figures 2(b), 2(c), and 2(d) can be approximated with linear equation, we use 8-hour regression model to estimate next hour's EC value for those patterns. So the estimated EC value (
We use ±
3.2. Experiment Result
To evaluate the performance of our hybrid prediction model, an experiment has been conducted. A total of 226 days of real data captured from group 2 sensors in the West Nakdong River are used to test the prediction accuracy.
Since our hybrid model determines patterns between 7 and 8 AM, there can be several detection errors. In our hybrid model, EC values are predicted via a step function during 8 AM~8 PM for patterns
Experiment result between hybrid model and regression model.

Our model correctly detected 5 patterns 160 times out of 226 cases (70.8%) in the above experiment. Among these correct detections, total 58 cases are for the other cases excepting patterns
As we can see in Table 2, even in the false detection cases with B type error, the accuracy of our hybrid model is better than regression model, let alone the correct detection cases in O2 type. If we can increase the rate of O2 type by decreasing the false detection rate of A type errors, then we can further enhance the accuracy of our hybrid model.
4. Overall System Architecture
Overall architecture for monitoring of the West Nakdong River which is implemented in this research is presented in Figure 6. Once sensor data is captured from the USN system via adaptor software into the USN middleware system, then that data is periodically inserted into the database of application service platform after postprocessing. Whenever a new sensor record is inserted into the base table, an After-Insert-Trigger for this table is invoked to predict salinity level via EC value. Several stored procedures are used together during these analysis and prediction phases. At the end of this After-Insert-Trigger, estimated salinity level is finally archived in analysis table together with the other calculated parameter values for later use at the other application systems.

System overview for monitoring of the West Nakdong River.
Visualization and the other alarming services are provided by application server in the form of public web services. Most of these public web services are mainly composed to consult diagnosed results that are archived in the analysis table.
5. Conclusion and Further Studies
In this research, we have suggested a hybrid model that combines pattern-based model with statistical group decision model. Group decision model is used to guide the normal range of electrical conductivity value for each sensor group's daily movement, and the pattern-based model is used to estimate hourly changes of each sensor output. Since the pattern-based model needs discriminating time to detect the proper pattern whenever a new day begins, we have supplemented statistical regression method to predict the sensor values during that time interval.
Our hybrid model provides more enhanced prediction for hourly sensor movement than the previous group decision model that is implemented in the West Nakdong River USN system. If the sensor output is constantly accumulated to the system for a long time, then we expect that our pattern approach will be refined again for better accuracy. We hope that we can find even more patterns for each sensor group later on and also want to reduce detection errors by introducing ANN for efficient pattern recognition.
Since the accumulated data of the West Nakdong River is far below the warning level for seawater permeation, to test our model's accuracy under exceptional situation, we currently consider running a simulation experiment that tests patterned output together with random output as for further study issues.
Footnotes
Conflict of Interests
The authors declare that there is no conflict of interests regarding the publication of this paper.