
Abstract
Modern nuclear power plants (NPPs) use a variety of digital technologies, with new technologies such as wireless sensor networks also under active consideration. Consequently, like other critical infrastructure at increasing risk of cyber-attacks, cyber security for NPPs has become an issue of growing concern. The development of cyber-attack scenarios is therefore a crucial part of cyber security plans for NPPs. However, regulatory guidelines for NPPs only mention the necessity for cyber-attack scenarios, their application methods, and simple examples, without outlining any systematic method to actually develop comprehensive cyber-attack scenarios. This paper proposes a method for developing NPP cyber-attack scenarios that reflect the inherent characteristics and architecture of NPPs using scenario graphs, a type of attack model. Further, the process of modeling scenario graphs using the proposed method and a process for developing new attack scenarios by combining several scenario graphs are discussed. In the scenario graphs, large and complicated system structures are conceptually divided, facilitating identification of components of cyber-attacks. Attack scenarios developed using these scenario graphs can be used extensively to develop design basis threats (DBTs), risk assessments, and penetration tests. Thus, they are important for establishing cyber security plans and programs.
1. Introduction
Digital technologies such as computers, control systems, and data networks currently play essential roles in modern nuclear power plants (NPPs). Further, the introduction of new technologies such as wireless sensor networks is also being considered. These digital technologies make the operation of NPPs more convenient and economical; however, they are inherently susceptible to cyber-attacks [1, 2]. For example, in 2003, the enterprise and control networks of the Davis-Besse NPP in the US were shut down because of an infection by the Slammer worm [3]. This incident demonstrates that the enterprise networks of NPPs connected to the Internet are exposed to the same cyber threats that target many unspecified systems in conventional IT environments. Further, in 2006, the instrumentation and control (I&C) systems [1] of the Browns Ferry NPP in the US state of Alabama were disabled because of a digital network problem; therefore, an operator shut down its operation manually [3]. This incident further shows that there are many areas in NPPs that are vulnerable to cyber-attacks. In addition, in 2010, a malicious code called Stuxnet damaged the Natanz nuclear power facility in Iran [4]. Stuxnet is an advanced persistent threat that was elaborately designed to target NPPs. It is regarded as a cyber weapon produced through national-scale support [5, 6]. As the possibility of cyber-attacks targeting NPPs increases, cyber security has emerged as an important issue for NPPs [2, 7]. Accordingly, under the US code of federal regulation (CFR), cyber security has been adopted as an NPP regulation requirement [8]. In addition, regulatory agencies such as the US nuclear regulatory commission (NRC) [9, 10] and the international atomic energy agency (IAEA) [11] have made and distributed regulatory guidelines that consider the construction of cyber security plans and programs for NPPs.
Developing and elaborating appropriate cyber-attack scenarios for NPPs are essential processes for establishing cyber security plans and programs for NPPs [10–12]. Furthermore, they would help to identify cyber security issues related to the introduction of new technologies such as wireless sensor networks. However, conventional cyber security regulatory guidelines for NPPs only mention the necessity for cyber-attack scenarios, their utilization methods, and simple sample scenarios, without suggesting systematic methods for developing them [10, 11].
Consequently, this paper proposes a method for developing NPP cyber-attack scenarios in line with the inherent characteristics and architecture of NPPs. This paper first analyzes the overall system and network structure of typical NPPs. It then identifies the systems that are likely to be the target of cyber-attacks and analyzes the expected attack results. In addition, it defines a scenario graph, a type of attack model, as a means for effectively representing components of cyber-attacks such as attackers, midprocesses, and goals, and the relationship between them. Subsequently, a method for modeling scenario graphs from current cyber security trends, studies, and real cyber-attack cases is proposed. Finally, the capability of the proposed method to develop new attack scenarios by combining and extending the attack scenarios developed is demonstrated.
The remainder of this paper is organized as follows. Section 2 gives background information in terms of the typical system and network configuration of NPPs, and the regulatory guidelines related to NPP cyber security. It also discusses the necessity for cyber-attack scenarios and the conventional method used to develop them. Section 3 provides a definition for the scenario graph and its modeling method and proposes a method for developing attack scenarios using the scenario graph. Section 4 demonstrates the process of developing an attack scenario with the proposed method by analyzing past cases and their scenario graph models. A comprehensive scenario graph is then derived, and all the attack scenarios that can be developed listed. Finally, Section 5 summarizes and concludes this paper.
2. Background and Related Work
2.1. General System Architecture of NPPs
In general, the entire system configuration of NPPs is similar to that of industrial control systems (ICSs) and supervisory control and data acquisition (SCADA) systems [15, 16]. The configuration can be divided into enterprise systems and I&C systems [11], according to function, as shown in Figure 1 [13, 14].

The enterprise systems of NPPs are used for daily operation, such as office automation, document management, and email, and consist of conventional IT systems, such as PCs and enterprise workstations. In most cases, commercial off the shelf (COTS) hardware/software (HW/SW) are adopted for use and connected to the Internet [11].
I&C systems are critical in NPPs as they monitor the operational state of the nuclear reactors via interaction with physical equipment. They are also responsible for process control. NPP I&C systems are operated in environments different from those of conventional IT systems. In the past, I&C systems were based on analog technologies; however, since the introduction of digital technologies in the 2000s, the proportion of digital technologies has been steadily increasing [1, 17]. At the same time, the convenience and lower cost of new digital technologies such as wireless sensor networks have resulted in them currently being under active consideration.
A typical modern NPP I&C system consists of control components such as distributed control systems (DCSs) or programmable logic controllers (PLCs) that interact with physical equipment directly and industrial PCs or engineering workstations that are used to regulate control components and their related works. In addition, unlike typical ICS and SCADA systems, governments, and NPP regulatory agencies stipulate that NPP I&C systems must satisfy the following strict safety requirements [17]:
requirements for annual maintenance, best availability and functionality levels, and environment tests; consideration of nuclear reactor safety and physical protection of nuclear material; setting system security levels considering safety level ranking, and evaluating safety risks in relation to security threats; verification that security functions do not have adverse effects on the safety and functionality of facilities; management and maintenance considering the safety and reliability of systems and examination and qualification by regulatory agencies; design that considers redundancy and diversity.
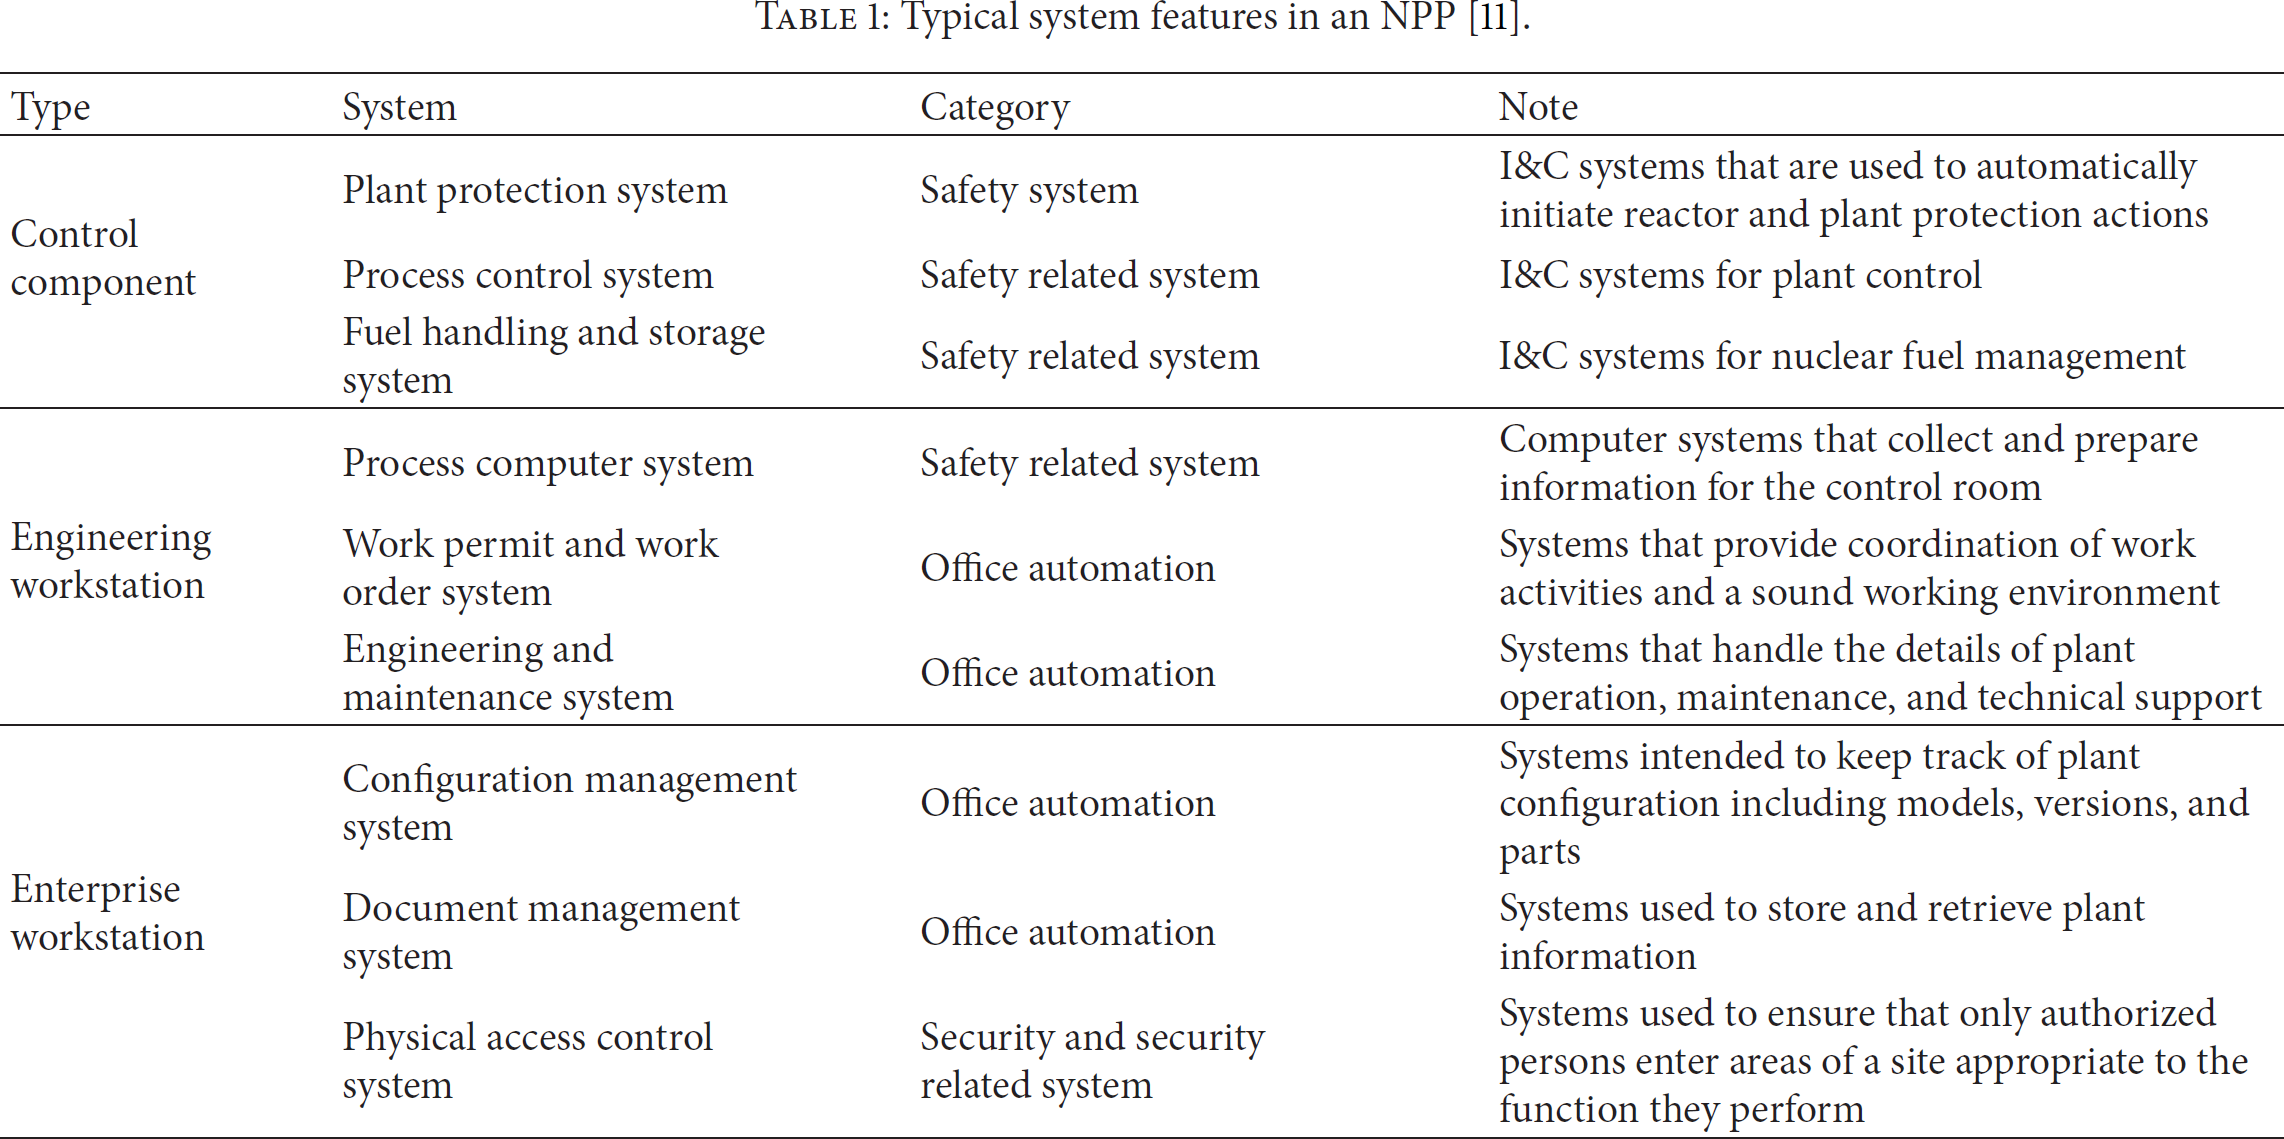
Table 1 lists typical control components, engineering workstations, and enterprise workstations used in NPPs [11].
Typical system features in an NPP [11].
2.2. Cyber Security Issues in NPPs
In general, the I&C systems of NPPs are physically isolated from external networks and have a different operational environment from that of conventional IT systems. As a result, NPPs were regarded as being safe from external cyber-attacks [1, 18]. However, continuous cyber-attacks against NPPs, such as the Slammer worm attack on the Davis-Besse NPP in 2003 [3], the emergency shutdown of the Hatch NPP in 2008 [3], and the Stuxnet worm attack on the Natanz nuclear facility in 2010 [4], signified that NPPs are as susceptible to cyber-attacks [2, 7, 18] as other critical infrastructures [19, 20] and conventional IT systems. In other words, the digital technologies introduced and used in NPPs are susceptible to cyber-attacks. For example, despite their advantages, wireless sensor networks might provide intrusion points for cyber-attackers.
The cyber security of NPPs was first considered when digital equipment was introduced into NPP I&C systems. In 2006, the regulatory guide (RG) 1.152 [9], the cyber security regulatory guidelines that focus on the safety of nuclear reactors, was announced. US federal law 10 CFR 73.54 [8], established in 2009, requires the identification and protection of systems that perform safety-related and important-to-safety functions, security functions, and emergency preparedness functions. Further, the law extends the application scope of NPP cyber security to all the identified systems in order to devise cyber security measures. RG 5.71 [10], announced in 2010, provides specific methods such as an identification framework for critical digital assets (CDA), cyber security policy and strategy, and a series of security controls in order to satisfy the requirements stipulated in 10 CFR 73.54. Additionally, in 2011, the IAEA introduced nuclear security series number 17 (NSS-17) [11], which extends the application scope of cyber security to the entire nuclear facility and provides technological guidance regarding the management and implementation of cyber security plans.
2.3. Cyber-Attack Scenarios for NPPs
The cyber security regulatory guidelines for NPPs demand that cyber-attack scenarios be developed for NPPs. RG 5.71 demands realistic cyber-attack scenarios for effective tests and training regarding contingency plans. NSS-17 stipulates the establishment and elaborating of attack scenarios as a midstep for risk assessments and management, as outlined in Figure 2 [11]. Such appropriate cyber-attack scenarios are essential for the cyber security of NPPs and can also be utilized for the following activities [10, 11]:
understanding the nature of attacks; understanding the potential venues that an attack or attackers may use; developing design basis threats (DBTs); countermeasure definition; risk management; penetration testing; implementing cyber security plans and programs.

The basic steps of a risk assessment and management methodology [11].
Annex I of NSS-17 gives an example of the attack scenarios development process. In the example given, attack scenarios are described as a verbose-description that includes the following steps [11]:
target identification; reconnaissance; system access/compromise; attack execution; covering of tracks to maintain deniability.
This verbose-description method can explain an attack scenario along with the details of each step. However, it cannot identify the sequential flow of attacks and the relationship between attack steps. Furthermore, it is less effective in deriving a partial scenario from an existing scenario, or deriving a new complicated attack scenario by combining several different scenarios.
2.4. Attack Tree and Attack Graph
An attack model [21, 22] is a method for systematically expressing various types of attacks: well-known examples are the attack tree [23–25] and attack graph [26, 27]. The attack tree and attack graph were developed to assess the vulnerability of systems to a specific attack and security test. In general, the root nodes of attack trees and attack graphs represent the goal of an attack, other nodes represent the vulnerability that is exploited by the attack, and edges represent the relationship between nodes. Figure 3 depicts a typical attack tree and attack graph. To calculate the achievement probability of attack goals and to identify detailed attack routes, the attack model can be extended [23] by introducing success probability or occurrence probability [26], or AND/OR conditions [25] in the nodes or edges.

Typical attack tree and attack graph.
The attack tree and attack graph show several midsteps, which compose attacks, and the relationship between the steps; thus, they can be used as means for expressing attack scenarios. However, the attack goal of the attack tree and attack graph is limited to a single root node defined in advance; therefore, it is difficult to predict the processes and results of various attacks, from various angles. Further, attack trees and attack graphs cannot effectively identify new attacks composed of a combination and series of several attacks. In addition, in order to compose attack trees and attack graphs, asset identification and analysis have to be performed first to acquire information regarding the operating environment and specific vulnerabilities of the target system or network.
3. Scenario Graph Modeling and Developing Cyber-Attack Scenarios
This section proposes a method for modeling cyber-attacks using a scenario graph, a type of attack model represented in the form of a directed graph, and a method for developing an attack scenario using such a graph. In comparison with attack trees and attack graphs, a scenario graph represents each component of a cyber-attack using three types of nodes and directed edges. Furthermore, a scenario graph conceptually represents multiple attackers, attack goals, and processes used by the attackers to achieve their goals. The process associated with various cyber-attacks can be represented in a single scenario graph, from start to finish. In addition, several scenario graphs can be combined into a new comprehensive scenario graph and, based on this new graph, a new attack scenario comprising several attacks developed. These characteristics make scenario graphs suitable for analyzing the possibility of various forms of attack against specific targets and for developing general cyber-attack scenarios. Scenario graphs can also be widely utilized to identify potential cyber threats and for penetration tests and simulations. The following sections give the definition and detailed information on each component included in a scenario graph.
3.1. Attacker Node
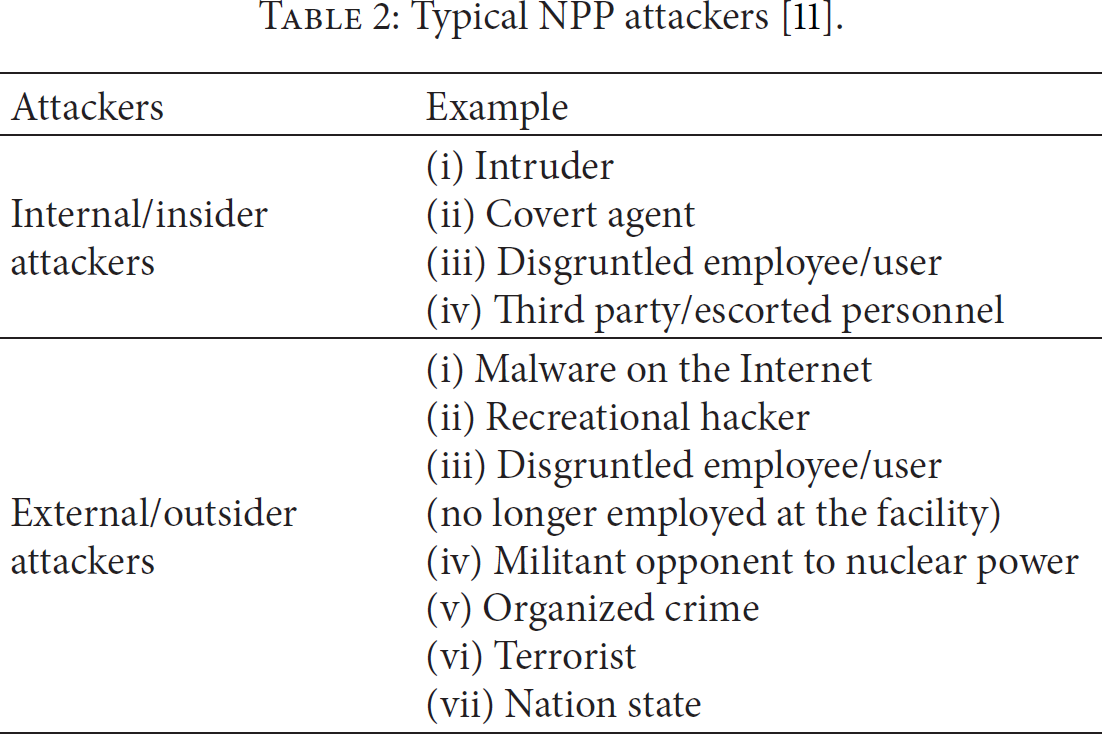
An attacker is a potential threat agent, or a group of threat agents, that intentionally initiates the first cyber-attack. An attacker is classified as either an internal or an external attacker, depending on whether it has direct access to the internal system of the NPP. An attacker node is represented by a tetragon with rounded corners, and all attack scenarios begin from this attacker node. Accordingly, the attacker node cannot be a terminal node of the edges in the scenario graph. Table 2 lists predictable, typical NPP attackers [11].
Typical NPP attackers [11].
3.2. Event Node
An event is defined as the midprocess of an attack that is achieving its goal, such as exploitation, compromise, or propagation. A plausible attack scenario consists of multiple event nodes that might occur sequentially. There can be many and various attack scenario event nodes achieving the same goal. Conversely, multiple attack scenarios with different goals can share the same event nodes in order to create midprocesses. For example, the midprocess for attacking the enterprise system of an NPP can either be “use of backdoor” or “zero-day exploit.” In addition, the attack goal of “zero-day exploit” can be an enterprise system or an I&C system. Event nodes are represented by an oval and can be the initial node of edges and the terminal node of other edges, simultaneously.
3.3. Goal Node
A goal is defined as an adverse effect on the aspects of function and operation of an NPP and is the result of successful cyber-attacks against the NPP. Such cyber-attack goals can be achieved through loss of confidentiality, integrity, or availability of the systems and components in the NPP. For example, loss of availability of control components that are interacting with control equipment can result in interruption of the physical processes of an NPP. In addition, loss of integrity can induce abnormal operation caused by the creation of abnormal control instructions. In other words, in order to identify the results and midprocesses of cyber-attacks against NPPs, it is necessary to identify the impact that loss of confidentiality, integrity, and availability has on NPPs. Table 3 lists the typical systems comprising an NPP and the results that could be achieved from loss of confidentiality, integrity, and availability. The goal node is represented by a tetragon; it cannot be the initial node of edges because all attack scenarios terminate at the goal node.
Typical results of cyber-attack on systems in an NPP.

3.4. Edge
Edges in a scenario graph represent the relationship between the initial nodes and terminal nodes of the edge. The terminal node of an edge can be a goal node, the final goal of an attack; it can also be an event node that is a subgoal close to the goal node. Conversely, the initial node of an edge can be an attacker node that causes the first incident, or an event node that is the means of reaching the terminal node. For example, the following is a scenario assumed to be a system that halts because of infection from a malicious code from the Internet:
Worms on the Internet, Workstation compromise, Shutdown the workstation.
In this cyber-attack scenario, “Workstation compromise” is the midprocess by which the attacker “Worms on the Internet” achieves the goal “Workstation shutdown.” In modeling this example with a scenario graph, the relationship between nodes can be represented by two edges, as seen in Figure 4.

Scenario graph with a sample attack scenario.
3.5. Path
The path that starts at the attacker node and ends at the goal node of a scenario graph represents an attack scenario. For example, the following cyber-attack scenario was developed using content from Table 2 of NSS-17 [11]:
Disgruntled employee, Use of backdoors, Workstation compromise, Theft of business information.
Figure 5 is a scenario graph that models this cyber-attack scenario. In this graph, there is a path composed of four nodes: “Disgruntled employee,” “Use of backdoor,” “Workstation compromise,” “Theft of business information”; this path represents a single attack scenario.
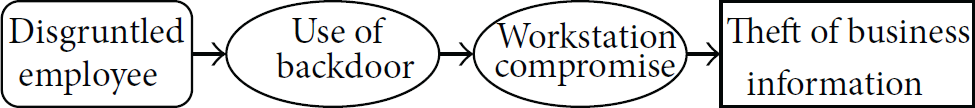
Scenario graph using content from Table 2 of NSS-17.
If the same nodes appear repeatedly over several scenario graphs, those scenario graphs can be combined into a single scenario graph in order to express the possibility of all cyber-attacks. For example, Figures 4 and 5 can be combined around “Workstation compromise,” an event node; the result is seen in Figure 6. In this case, “Workstation compromise” can be initiated from “Worms on the Internet” and “Use of backdoor” and can terminate at “Shutdown the Workstation” and “Theft of business information.” Accordingly, the scenario graph of Figure 6 has a total of four paths that initiate at the attacker nodes and terminate at the goal nodes; among these, two paths represent the aforementioned attack scenarios of Figures 4 and 5. We were able to develop additional attack scenarios from two remaining paths, with the following results:
Worms on the Internet, Workstation compromise, Theft of business information; Disgruntled employee, Use of backdoors, Workstation compromise, Shutdown the workstation.

Identifying the components of a scenario graph, namely, each node and the relationship between nodes, is essential for developing a plausible, well-made cyber-attack scenario. The components of a scenario graph can be identified by various methods, such as the following.
One can refer to the cyber security regulatory guidelines regarding NPPs or their related studies. For example, the IAEA defines a threat as “a person or group of persons with motivation, intention, and capability to commit a malicious act” and represents potential threats against NPPs in the form of the attacker profile matrix listed in Tables 1 and 2 [11]. Table 2 in this paper, which shows the typical attackers of NPPs, was also made by referring to this information. One can refer to the trend in recent vulnerabilities and threats against COTS used in conventional IT and ICS environments. Most NPP systems use various COTS HW/SW [1, 2], as listed in Table 4, and are also actively considering introducing new technologies such as wireless sensor networks. Recent attack techniques against such COTS, zero-day vulnerability, and new technologies can be modeled in the form of new nodes and edges in an existing scenario graph, and this can be followed with the construction of new paths and the development of new scenarios. Previous cyber-attacks and incidents or penetration test cases can be modeled with scenario graphs. In this case, the possibility of an attack scenario is regarded as having been verified; therefore, it can be effective for preventing a recurrence of the same or similar attacks. Section 4 considers this method in detail.
Typical COTS used in NPPs.

4. Case Studies
In this section, we present the process of developing cyber-attack scenarios for an NPP, using scenario graphs derived from previous cases. First, we analyze representative cases of previous cyber-attacks and incidents and identify the components of the scenario graph from them. Specifically, by applying the method proposed in the previous section, we prepare several scenario graphs for each case. Subsequently, after analysis, we combine the results to derive a single comprehensive scenario graph—the sum of identified nodes, edges, and possible attack paths. Finally, using the comprehensive scenario graph, we develop cyber-attack scenarios for an NPP. To accomplish that, target NPP's features such as the network condition, system configuration, and cyber security policy are supposed and are reflected in the comprehensive scenario graph.
4.1. Analysis of Representative Cyber-Attack and Incident Cases
4.1.1. Davis-Besse NPP (US)
In 2003, the Slammer worm infected computer systems at the Davis-Besse NPP [3]. The worm intruded from a business consultant's network to the enterprise network of the licensee for Davis-Besse NPP and then to the I&C network of the plant. It then generated malicious traffic that clogged the enterprise and I&C networks. For almost five hours, plant employees were unable to access the safety parameter display system in the Davis-Besse NPP. The Davis-Besse NPP had a firewall that could protect the enterprise network from the Internet and external network. Typically, the Slammer worm cannot intrude into the NPP over the firewall. However, a consultant had created a network connection to the consultancy's office network that bypassed the firewall. This allowed the Slammer worm to gain access to and infect the NPP's enterprise network. From there, there was no obstacle in the propagation path to the NPP I&C network.
In this case, the attacker was the Slammer worm, a malicious code found on the Internet, and categorized as an external attacker against NPPs. The attacker accessed the enterprise workstation of the NPP using the connection that bypassed the NPP firewall; such a connection can be regarded as a type of backdoor created by the consultant. This attack propagated through the network and infected even the engineering workstation, consequently causing loss of availability of the I&C network. Figure 7 shows a scenario graph modeling the aforementioned process.
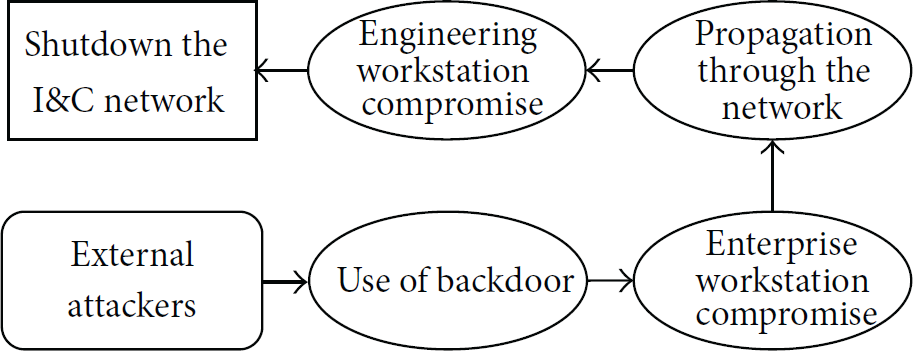
Scenario graph of the Davis-Besse case.
4.1.2. Browns Ferry NPP (US)
In 2006, unit 3 at the Browns Ferry NPP was manually shut down after the failure of its I&C system [3]. In the Browns Ferry NPP, the condensate demineralizer used a PLC, and the recirculation pumps used a variable frequency drive (VFD) to modulate motor speed. To send and receive data, both kinds of devices communicated with each other over the Ethernet LAN. However, both devices were designed without considering high traffic environments. Each device used Ethernet network broadcasting to send data packets to other devices. In this case, the receiving devices had to check each packet to determine which were addressed to them and which were not. As a result, the Browns Ferry NPP's I&C network produced more data traffic than the devices could handle. The spurious flooding Ethernet traffic caused malfunction and unavailability of the PLC and VFD.
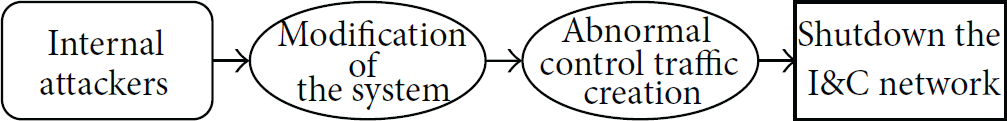
The failure of these controllers was not the result of a cyber-attack. However, it demonstrates the effect that one component can have on an entire I&C system network and every device on that network. Thus, this failure can be coopted for intentional cyber-attacks. For example, we could develop a cyber-attack scenario in which an internal attacker creates abnormal traffic by connecting PLC or VFD to the I&C network; then, as a result, the I&C network can be shut down. Figure 8 shows a scenario graph that models this activity.

Scenario graph of the Browns Ferry case.
4.1.3. Hatch NPP (US)
In 2008, unit 2 of the Hatch NPP automatically shut down after an employee updated software on a single computer system on the NPP enterprise network [3]. At the time, the computer was being used to gather diagnostic data from the I&C network, and the update was installed to facilitate synchronization of the data on both networks. However, when the employee rebooted the computer, the software reset the data on the I&C network. The I&C systems interpreted this reset as an emergency incident and consequently initiated an automatic shutdown to protect the reactor of the NPP.
This incident gives an insight into how malicious attackers could make simple changes to an enterprise network that ultimately affect a nuclear reactor. In other words, an internal attacker can create abnormal traffic by manipulating a specific system maliciously or, in some cases, by simply rebooting it, thus being able to shut down the I&C network. Figure 9 shows that this attack is modeled as a scenario graph.
Scenario graph of the Hatch case.
4.1.4. Natanz Nuclear Facility (Iran)
In 2010, the Stuxnet worm, a threat targeting a specific critical infrastructure, destroyed approximately 1,000 centrifuges at the Natanz nuclear facility [4–6]. Stuxnet exploits vulnerabilities in Microsoft Windows and copies and executes itself on remote computers through the network. In the Natanz nuclear facility, the PLCs are often programmed from Windows computers not connected to the Internet or even the enterprise network. In addition, the I&C systems themselves are also unlikely to be connected to the Internet. However, Stuxnet is also designed to infect and hide in removable drives and uses a Windows rootkit to prevent any employee from discovering its associated files. When Stuxnet finally found a suitable computer, one that was used to program PLCs, it modified the code on the PLCs to operate as the attackers intended. Then, the compromised PLCs sent incorrect instructions to plant equipment that destroyed them.
The Stuxnet case exemplifies the process by which an external attacker can exploit the vulnerability of COTS OS, infect the internal system using USB, and destroy the physical equipment of the NPP with the manipulated PLC program. Figure 10 shows a scenario graph modeling the Stuxnet case.

Scenario graph of the Natanz case.
4.1.5. Monju NPP (Japan)
In 2014, confidential information from the Monju NPP was leaked due to a malware [28]. The malware exploited the update address vulnerability of a COTS software and infected an enterprise workstation of the NPP. In addition, the malware used a Chinese directory name and targeted a specific IP address class. The workstation was not directly related to the operation of the NPP, but it had confidential data such as mails, schedules, reports, and proceedings, and a portion of these data was leaked.
This case exemplifies an attack causing loss of confidentiality of an NPP, by an external attacker that infects an enterprise workstation by exploiting the vulnerability of COTS SW and then extracts the NPP information that is stored in the system. Figure 11 shows the modeling of the aforementioned scenario.

Scenario graph of the Monju case.
4.2. Deriving Comprehensive Scenario Graph
As mentioned in the previous section, multiple scenario graphs can be combined with the repeatedly appearing nodes. Figure 12 shows the comprehensive scenario graph derived by combining all the modeled scenario graphs above. The comprehensive scenario graph contains all of the identified nodes and edges. The details of these nodes are as follows.
Two Attacker Nodes. To aid understanding, we classified the nodes into external and internal attackers, depending on the location of the attackers. Ten Event Nodes. These nodes represent the midprocess of the attacks and were obtained from previous case studies. Attackers can reach the same goal via different events; moreover, attackers can reach different goals via the same event. Three Goal Nodes. “Theft of business information” causes loss of confidentiality of enterprise workstations, thus causing secret information within NPPs to be disclosed. “Shutdown the I&C network” causes loss of availability of I&C networks, thus causing NPPs to be shut down as an emergency. “Malfunction or destruction of the equipment” occurs when the integrity of the PLC program is lost, thus causing equipment for physical processes to malfunction or be destroyed.

Comprehensive scenario graph derived from case studies.
4.3. Development of Cyber-Attack Scenarios Using Scenario Graph
In this subsection, we discuss the process of developing attack scenarios for an NPP using the comprehensive scenario graph. In particular, we assume the following conditions regarding the target NPP's environment.
Its design is based on the standard NPP architecture, described in Section 2. It does not have an unauthorized contact point to the Internet. Its I&C network is isolated from its enterprise network. Its I&C network contains a wireless sensor network. COTS OS and SW are used. Removable media (USB) are used for maintenance.
Under these circumstances, not every attack path from the comprehensive scenario graph is applicable to the target NPP. Therefore, we identify plausible attack paths considering the target NPP's features and then develop cyber-attack scenarios from the result. Table 5 shows the event nodes in the comprehensive scenario graph and their relevant features.
Event nodes and their relevant features.
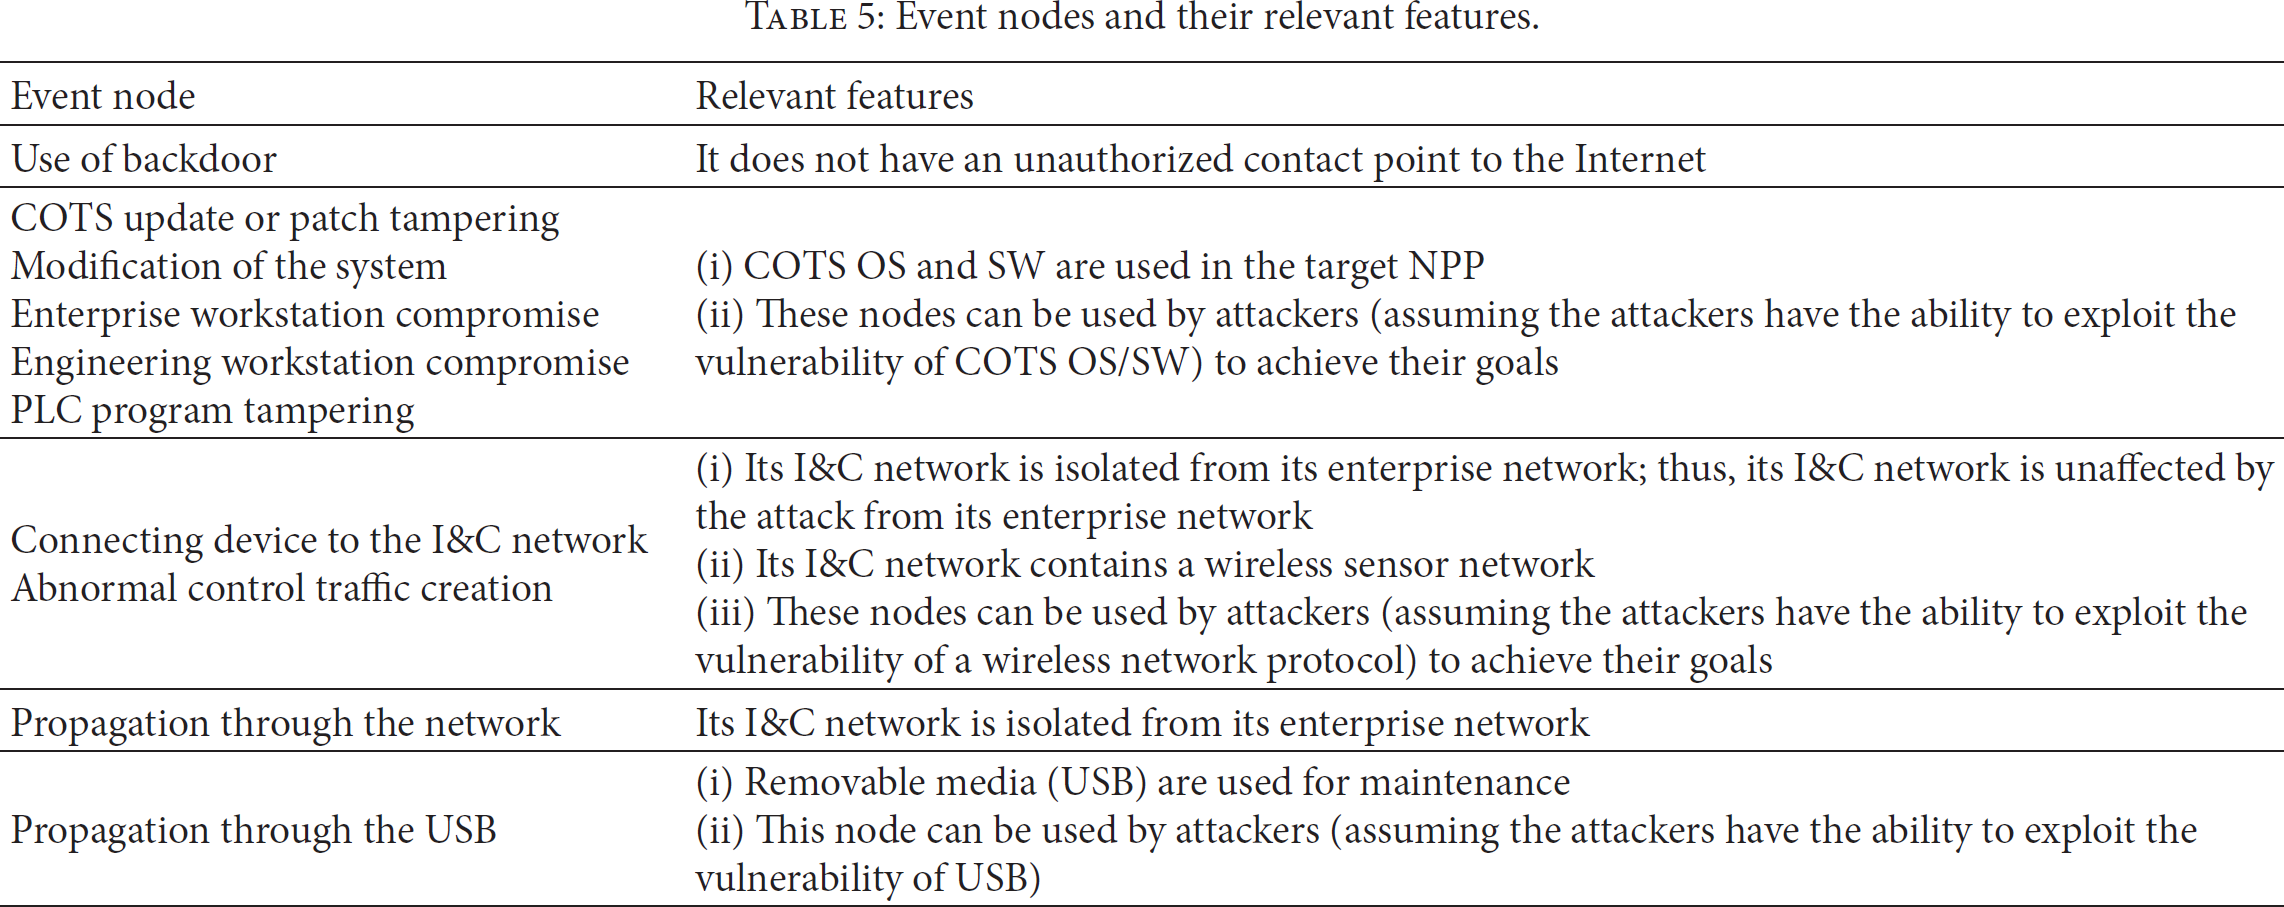
As a result, we remove event nodes and edges with low plausibility, as shown in Figure 13. By identifying the paths that initiate at an attacker node and terminate at a goal node in the comprehensive scenario graph reflecting the target NPP's features, we develop five attack scenarios, which are listed in Table 6. Moreover, by investigating the frequency of use of the event nodes, we identify the event nodes through which multiple attack paths pass. That is, as shown in Figure 14, the most repeatedly used event nodes such as “COTS update or patch tampering” and “Enterprise workstation compromise” are the critical ones for the target NPP. Therefore, their vulnerability should be assessed and mitigated to protect the target NPP from cyber-attacks and incidents effectively.
Attack scenarios developed from comprehensive scenario graph.


Comprehensive scenario graph reflecting the target NPP's features.

Frequency of use of the event nodes.
5. Conclusion
This paper proposed a method for modeling attacks using a scenario graph and developing an attack scenario from the model. Attackers, events, and goals, derived from cyber security-related trends, guidelines, studies, and new technologies such as wireless sensor networks, are represented in the nodes of the scenario graph, and the relationships between nodes are represented as edges. In addition, by examining case studies, this paper showed the process used to model scenario graphs from real cyber-attack cases and incidents in NPPs. The scenario graphs modeled in this way can be continuously added to a comprehensive scenario graph, which can be extended in a manner that facilitates the development of many more detailed attack scenarios. When modeling a scenario graph that intensively targets a specific NPP, the developed attack scenario can be used in a real penetration test. Conversely, results of penetration test can be used as feedback data for a scenario graph.
Security assessments or tests for NPPs at the overall system-scale are impossible because of the systems' scale and complexity in NPPs. However, scenario graphs can represent respective components of cyber-attacks, including NPP systems and networks, as nodes and edges, and they can be divided or combined as necessary. Accordingly, the nodes and edges of scenario graphs can be utilized as units for security assessments and tests regarding NPP systems and networks. Through this process, if enough data is accumulated, new types of nodes and edges can be defined for scenario graphs, or weighted values can be added to the nodes and edges for risk assessment and probabilistic security assessment of the NPP.
Footnotes
Conflict of Interests
The authors declare that there is no conflict of interests regarding the publication of this paper.
Acknowledgment
This work was supported by the Nuclear Power Core Technology Development Program of the Korea Institute of Energy Technology Evaluation and Planning (KETEP), granted financial resource from the Ministry of Trade, Industry & Energy, Republic of Korea (no. 20121510100030).