
Abstract
On the demand of many applications, vehicle to vehicle (V2V) communications have attracted many researchers’ attentions. In the developments of traffic safety applications based on VANET, the dissemination delay is critical. The dissemination delay of safety messages in the form of text has been studied thoroughly. In contrast, the dissemination delays of video or audio safety messages are just emerging and there are still a lot of things to be done. Considering the poor communication environment of multimedia safety messages dissemination in V2V, the analysis of multimedia message dissemination delay has great significance in the traffic safety applications. By extending and integrating previous achievements of analyzing MAC access delay in video stream dissemination, we proposed a method for modeling the relay access delay of IEEE 802.11p in the multihop relay chain of VANETs. Simulation results showed that the cumulative distribution function, the expectation, and the standard deviation of the relay access delays can be calculated effectively. In addition, the impacts of the number of hops and the length of packets on the relay access delays have been properly evaluated. Our study would open these research issues for discussion, which will contribute to the design and implementation of traffic safety.
1. Introduction
VANETs have recently received great attentions from both academic and industrial communities [1–5]. In VANETs, V2V can provide safety applications which are the primary purpose of vehicular communication technology development [6–9]. In V2V networks, vehicles are equipped with advanced wireless network equipment which has a sizeable bandwidth for multimedia data transmission. In the near future, traffic safety applications can be enhanced by the multimedia safety messages. In a real scenario, the live video streaming from the accident or dangerous situation, such as debris flow, earthquake, mass fire, and explosion occurring, will be more helpful than plain text message for drivers. The driver can make an informed decision based on practical situation for the next action, like moving forward or backward. For example, assume a serious accident happened on the highway followed by major traffic congestion. In this case, the multimedia live information such as image and video streaming from the scene of action can be captured by the lead vehicle and delivered to other vehicles several kilometers away. The live visual information can be easily understood or accepted by the drivers and help them decide if they should proceed or turn around. In more serious emergency scenarios, the multimedia safety messages will assist the victims to prevent the situation from worsening and it will help the appropriate authorities to organize efficient rescue operations.
The live multimedia information must be disseminated as soon as possible in V2V network for road traffic safety. If the multimedia safety messages are not disseminated in time, the severe congestion caused by the accident or the natural disaster will deteriorate fast to an uncontrollable situation. A critical measure for multimedia safety messages delivery over multiple hops to remote vehicles well beyond the visual range is the end-to-end delay [10–13]. To understand the potential for V2V to support such delay-sensitive traffic safety applications, analytical method for end-to-end delay is in demand. The end-to-end delay usually consists of three parts: the packet delayed by data processing, the packet delayed in the queue by scheduling policy, and the packet delayed by the medium accessing [14–19]. The third kind of delay is known as MAC access delay and is much longer than the other two kinds of delays. So MAC access delay is worth discussing deeply, and that is what we focused on in the article.
It is generally known that MAC access delay is determined by both the MAC protocol and the structure of VANET. The most popular wireless networking technology available nowadays for establishing VANET is the IEEE 802.11p [20–22]. Owing to the geometric feature of two lane roadways, vehicles usually drive in sequence in low traffic density as shown in Figure 1. In Figure 1, one is composed of five vehicles and moves from the left to the right. The other is formed by three vehicles and drives from the left to the right. When the vehicles drive to the same direction and communicate with each other, the vehicles will compose a multihop relay chain. It means that the multihop relay chain is a realistic structure of VANETs for multimedia video delivery [10, 23–25]. The main idea behind the multihop relay chain is to make use of intermediate vehicles for relaying the multimedia packets to ensure an efficient message relay with the maximum dissemination distance and the minimum dissemination delay. In such a kind of networks and given limitations in coverage and interference, each intermediate vehicle with two neighbor vehicles in its communication range can realize the maximum dissemination distance and the minimum dissemination delay. This situation, for example, could be as shown in Figure 1. In such a multihop relay chain, vehicle states and channel condition, especially of the number of hops, are the major factors of the MAC access delay of IEEE 802.11p [10, 25–29].

Two multihop relay chains in the two lane roadways.
This paper is a tentative research in this direction, and we extend and integrate the discrete-time Markov models from [30, 31] to analyze the MAC access delay of IEEE 802.11p in multihop relay chain. In Section 2, we review the related work. In Section 3, we present the derivations of the explicit expressions, the expectation, and standard deviation of relay access delay and propose an approximate method to obtain the complementary cumulative distribution function of relay access delay. In Section 4, we validate and discuss the proposed analytical model by comparing calculation result and ns-2 simulation and in Section 5, we conclude the work.
2. Related Work
The delay analysis of the IEEE 802.11p MAC sublayer with the queuing models has been partially investigated in some articles. A performance increase in data packet delivery ratio and decrease in average end-to-end packet delay on a 2-lane motorway were demonstrated in [32, 33]. In [34], Cai et al. considered the behavior of the relay node as a queuing system and represented the service for its own packet transmission as an M/G/1-type Markov chain. In [35], a buffer management and a queuing model were proposed to analyze throughputs and delays in the delay tolerant networks by Niyato et al. Also, some publications concerned the delay of IEEE 802.11p in channel access and wireless propagation. Ma and Chen proposed analytic model accounts for impact of priority access, message arrival interval, hidden terminal, channel fading, and highly mobile on indices in [36]. Agarwal et al. derived both upper and lower bounds on the average message propagation speed by exploiting a connection with the classical pattern-matching problem in probability theory in [37, 38]. Vinel et al. designed a model which explicitly accounted the operation of IEEE 802.11p and computed mean decision delay as a function of number of vehicles, ratio of intruders, and contention window sizes in [39].
According to previous results, network structures can be classified into two groups: multihop relay and single-hop to infrastructure [40–46]. In this paper, we concentrate the attention on relay access delay of IEEE 802.11p in multihop relay chain.
In 2011, Rostamzadeh and Gopalakrishnan proposed a mathematical model for approximating the relationship between message delay and physical distance in a vehicular network [47]. Combining an expression for the number of successful packet transmissions with the estimates of intervehicle spacing, Rostamzadeh and Gopalakrishnan formulated the relationship between the distance traversed by a message and the time taken to traverse this distance [47]. In [47], the transmission delay is fixed for each transmission, and the propagation delay of each hop obeys an exponential distribution. In contrast, we consider that the propagation delay between adjacent vehicles is so little that we can ignore it. Besides that, the main difference between [47] and our research is reflected in the opinions on transmission delay of each hop. The transmission delay of each hop is considered as complex and random in our research. The transmission delay of each hop is considered as consisting of three parts, and the most important one in the three parts is the MAC access delay which is one of our main research contents.
In the same year, Sjöberg et al. evaluated the performance of IEEE 802.11p in terms of the MAC-to-MAC delay, a measure which captured both the reliability and the delay of the delivered data traffic for a varying number of vehicles in one hop [48]. The cumulative distribution function of the MAC-to-MAC delay was depicted by experimentally evaluating the MAC methods of IEEE 802.11p [48]. There are two major distinctions generally differentiated [48] from this paper. First, the performance of MAC-to-MAC delay is not modeled with an analytic method and is only evaluated in experiment in [48]. In this paper, the performance of relay access delay is not only evaluated in different scenarios but also modeled with a theoretical analysis method. This method infers the cumulative distribution function, the expectation, and the standard deviation of relay access delay. Second, the MAC-to-MAC delay, studied thoroughly in [48], is the end-to-end delay for one hop. The relay access delay as our main research object is the end-to-end delay for multihop.
In 2013, Liu et al. investigated modeling and delay analysis of intermittently connected stationary and isolated roadside units [49]. In [49], roadside units experience frequent disruptions in terrestrial application, and mobile vehicles present opportunistic relaying capabilities that promote roadside network connectivity. Information is encapsulated into bundles buffered at the source roadside unit, and vehicles opportunistically transport them to the destination roadside unit [49]. More specifically, theoretical expressions were derived for the estimation of three delay-performance metrics: the bundle queuing delay, transit delay, and end-to-end delivery delay [49]. In the scenario of [49], the information disseminates from source roadside unit to destination roadside unit through vehicles relaying. In this paper, we also study the theoretical expressions of end-to-end delivery delay. However, message is spread from the lead vehicle to the tail vehicle through the middle vehicles relaying. The topics of ours and [49] are the same, but the scenes of the two articles are different.
In 2012, Khabbaz et al. proposed in-depth study on the insights of message delivery delay in VANETs towards the identified two major factors: message delivery distance and density of vehicles, based on a bidirectional vehicle traffic model [50]. In their framework, the reverse traffic was used to disseminate emergency messages with short delivery latency, and the number of vehicles in the reverse direction obeys a Poisson distribution [50]. However, when the severe congestion caused by the accident or the natural disaster takes place on the road, vehicles in the reverse direction will be stopped by the traffic jam and not help deliver the messages. To make it more realistic, we consider that vehicles can only communicate with other vehicles that move in the same direction. The vehicles moving in the same direction can constitute a stable multihop relay chain which is a proper structure in forwarding message along the road to prevent congestion deterioration. In our scenario, a live video streaming will be recorded by the lead vehicle of the multihop relay chain with a driving recorder and propagated to the vehicles in the same direction several miles behind.
3. Analytical Model of Relay Access Delay
In this section, we propose an analytical model for performance evaluations of relay access delay of multihop relay chain. Firstly we derive the vehicular traffic model of multihop relay chain in Section 3.1 followed by derivation of the expression of relay access delay in Section 3.2. In Section 3.3, we demonstrate how to calculate the expectation and variance of relay access delay. In Section 3.4, we propose a method to get the complementary cumulative distribution function of relay access delay which can be used to obtain the probability that relay access delay is greater than the given constraint.
Descriptions of all variables used in the paper are summarized in the Notation Section.
3.1. Vehicular Traffic Model
In this section we will describe the vehicular traffic model which will be used in the following part of this paper. We will then describe the proposed multimedia information dissemination model used to characterize the dissemination process throughout the multihop relay chain. These models will be used in Sections 3.2~3.4 to derive the service capacity model.
The network model is built on a two lane roadways scenario, where vehicles can only communicate with other vehicles which are moving in the same direction. Moreover, assume vehicles are distributed with a sparse density and equipped with driving recorder and car monitor. Vehicles are also equipped with a Global Positioning System (GPS) for positioning and time synchronization purposes. When an accident or dangerous situation (e.g., debris flow, earthquake, mass fire and explosion, terrorist attack damage, etc.) occurs ahead, live video streaming recorded by driving recorder will be propagated from the lead car and sent to the vehicles several miles behind to inform drivers of the problem and allow them to decide if they should proceed or turn around.
Since the multimedia data transmission along the highway is much larger than the range of one hop, we simplify the network as a multihop relay chain as shown in Figure 2. The access to the medium is free of contention in the chain, since the chain is too long to implement centralized management. Transmission in the chain uses an assigned channel to avoid interference from the other serve channel. We also assume that all the vehicles have a fixed and uniform transmission range denoted by M. The spacing between two adjacent vehicles in the chain should be less than M to ensure reliable communication. Moreover, for minimum channel contention, the distance between two nonadjacent vehicles in the chain is as close as possible to M. According to this method, the set of vehicles form a multihop relay chain. When the number of vehicles in such chain is given, video dissemination can be spread further with the less channel competition, because each vehicle in such a chain only has two neighbor vehicles in its transmission range. Moreover, this structure of chain is suitable for the scene described in Figure 2.

One direction relay model scenario in two lane roadways.
As shown in Figure 2, a video stream is relayed along the chain using IEEE 802.11p. In our scenarios, we make several simplified assumptions. First, the lead vehicle of the chain is the only video packet source, and other vehicles carry and forward the video packet sequentially. It means that the intermediate vehicle is only responsible for forwarding the video captured by the leading vehicle and never sends the video captured from itself. Second, we assume that the interference range equals the transmission range. Third, video transmission using an assigned channel is to avoid the interference from another service. The MAC access competition in the assigned channel is only caused by video dissemination. Considering the mechanism of IEEE 802.11P, the MAC access delay caused by MAC access competition is the main ingredient of the delay of video dissemination [30, 31]. From the reviews of the delay of video dissemination in multihop relay chain, an index named “relay access delay” can be proposed to evaluate the total MAC access delay effect of every vehicle. The terms “vehicle” and “node” will be interchangeably used throughout this paper.
3.2. Expression of Relay Access Delay
Let D be the random variable (rv) representing the MAC access delay of each node [32]. In our work, we adopt Sakurai and Vu's approach to get the D of every relay node [32]. For indicating the total effect of D of every relay node, the relay access delay is considered as the sum of D of each node in the multihop relay chain. Let R denote the relay access delay of multihop relay chain. As shown in Figure 2, the relay access delay from node 1 to node n can be expressed as

To obtain R in (1), the calculation of
In (2),


The rv

In (4), v is the number of retransmission and
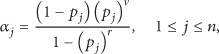
where


Equation (6) is derived according to the principle of IEEE 802.11p. The time that node j spends in transmitting a packet successfully after v failures is denoted by
If node j successfully sends a packet after v failures, node j experiences v transmissions and
In (8), the scope of
In (8), because
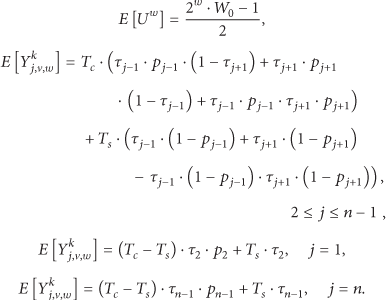
According to IEEE 802.11p, the backoff period durations are discrete uniform random variables and given by

where U is the uniform distribution and
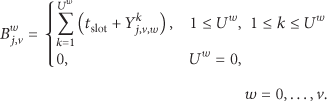
Equation (10) represents the probability distribution of the interruption

In (10),
So far, only

where
From the analysis above, the expressions of
3.3. Expectation and Standard Deviation of Relay Access Delay
The expectation and the standard deviation of relay access delay, denoted by

When node f and node g are neighbors or have the common neighbor node, the transmission of node f and node g can force adjacent nodes to the backoff stage. Consequently, node f and node g are not independent and have a nonzero cross covariance. It means that
Based on (2), we have

As described in (4) and (5), the rv

where
Given (6),
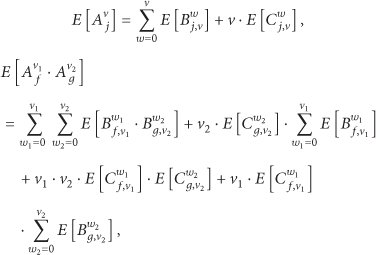
where
Considering (7) and (8),

From (9)–(11),
To calculate
Because the backoff slot in the backoff stage of every node is determined by the interruption from the other node, the relation between

In the first scenario, node f and node g are one-hop neighbors to each other.

In the second scenario, node f and node g are double-hop neighbors to each other.

In the third scenario, there are more than two nodes between node j and node g.
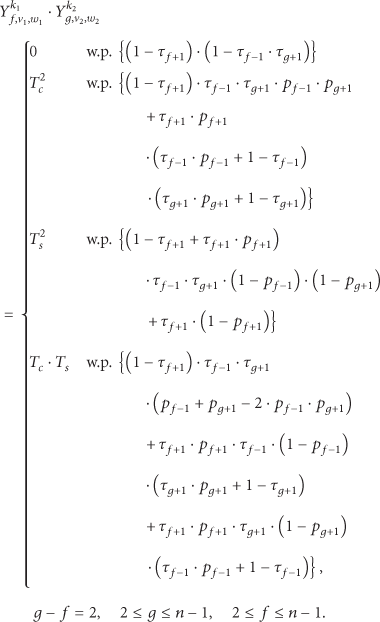
The probability distribution of
3.3.1. The First Scenario
Consider

In (18), the discrete probability distribution of
Consider that
In (18),
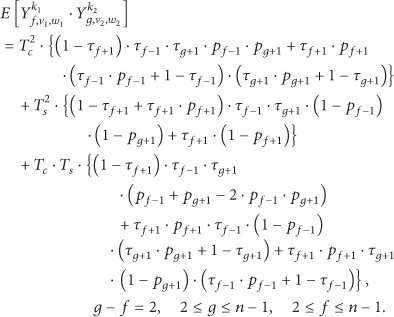
When

In (19), we derive the expectation of
3.3.2. The Second Scenario
Consider
As shown in Figure 4, when
In (20),
When
In (21), we derive the expectation of
3.3.3. The Third Scenario
Consider

When
In (22),
When the discrete rv

In (23), we derive the expectation of
From (13)–(23), we can finally obtain
3.4. Complementary Cumulative Distribution Function of Relay Access Delay
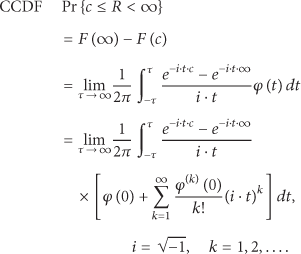
In a multihop relay chain, the probability that R is greater than the given constraint in delay sensitive applications is usually concerned. Hence, the complementary cumulative distribution function (CCDF) of R can be defined as

The relay access delay R is a discrete random variable, because the values of


The CCDF of R cannot be used directly according to (24), because the PMF of R is unknown. However, we can obtain the CCDF of R from the CF of R via the inversion theorem proposed by Gil-Pelaez in [52]. On the basis of inversion theorem in [52], we can get
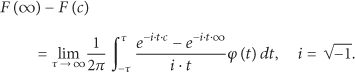
When the inversion theorem as denoted in (28) is introduced, the next major task is to get the expression of
The whole method of getting the CCDF of R from the CF of R can be divided into four steps, as demonstrated in Figure 6.

Procedure of computing the CCDF of R.
Step 1 (Utilize E[
The arbitrary order moment of R can be calculated by Harr's point estimation [53]. Harr's point estimation method is a computationally straightforward technique and is a second moment method which is capable of taking into account the first two moments (i.e., the expectation and variance) of the involved random variables. It can be used to estimate any order moment involving several random variables which are either dependent or independent [53].
According to (1), the expression of R can be considered as a function of n random variables

where


Note that
Because Harr's point estimation only utilizes the first two moments of
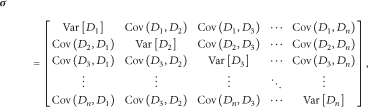
Moreover, Harr's point estimation method is built on orthogonal transformations of the correlation matrix [53]. The orthogonal transformation can be made using the eigenvalue eigenvector decomposition or spectral decomposition by which

where
For a multivariate model

in which
According to [53], the kth moment of the relay access delay R about the origin can be calculated according to the following equations:

where the definitions of
Step 2 (Use the kth Moment of R to Calculate the kth Derivative of the CF of R). The arbitrary order moment of R will be used to approximate the arbitrary derivative of the CF of R. The detailed calculation and explanation of Harr's point estimation can be found in [53].
According to the property of CF of R, we have

where
Step 3 (Apply the kth Derivative of the CF of R to Approach the CF of R). When the
where the value of
Step 4 (Utilize the CF of R to Calculate the CCDF of R). When the approximation of CF of R, indexed by
We can see that the inversion theorem proposed by Gil-Pelaez is a particularly useful tool for numerical evaluation of a general distribution function by numerical integration. Now the probability that relay access delay is greater than the given constraint in delay sensitive applications can be calculated by the CCDF of R in (38).
4. Numerical Evaluation and Discussion
In this section, we evaluate the performance of expectation, standard deviation, and CCDF of the relay access delay in multihop relay network.
A group of researchers designed a new model of IEEE 802.11 MAC and PHY modules for ns-2 which support IEEE 802.11p. This new model is implemented in ns-2 version 2.34 and this version of ns-2 is used in our study to validate the model and calculation [55]. We changed the mechanism of traffic generation to implement the unsaturated traffic environment, as required by the Markov model in [30, 31].
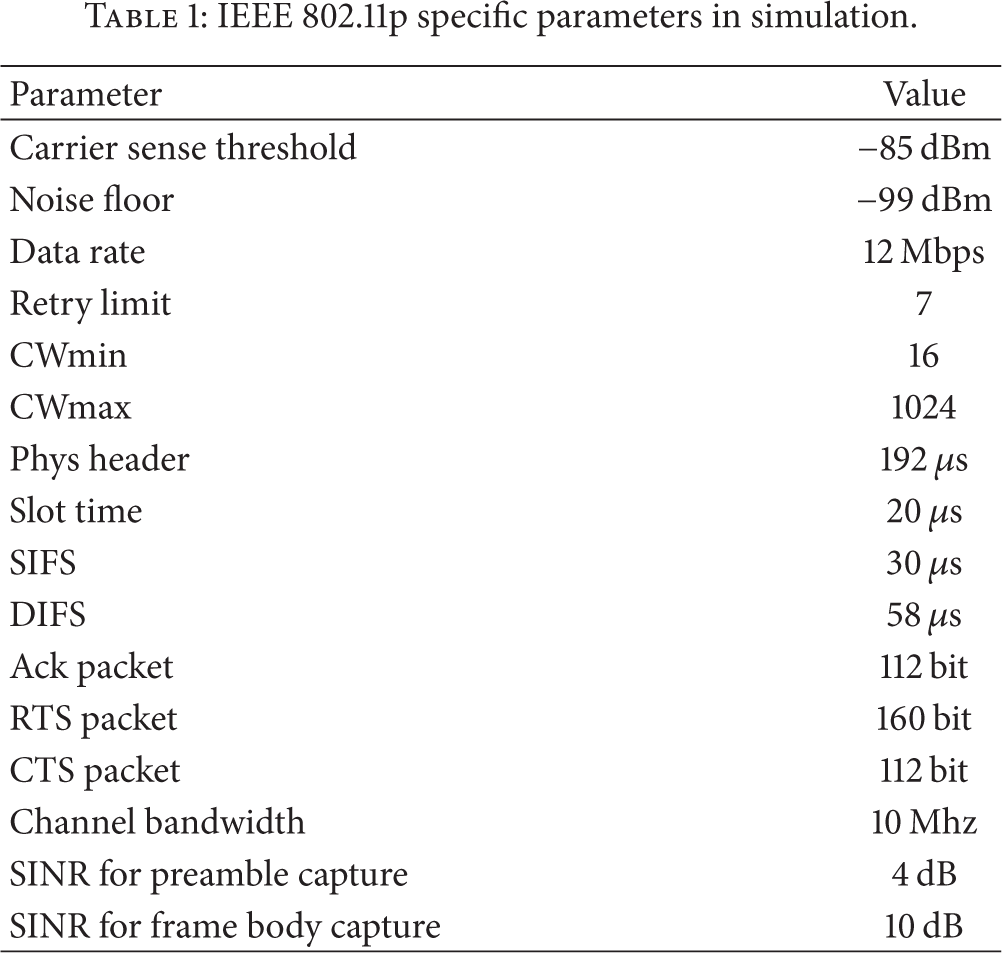
In our scenarios, multiple nodes are evenly distributed in the multihop relay chain and the two endpoint nodes are the source and destination, respectively. The packet is relayed sequentially by the nodes from the source to the destination, as demonstrated in Figure 2. In the simulations, we adopt a simple fixed routing scheme which manually appoints the single-hop neighbors of any nodes. The IEEE 802.11p PHY and MAC parameters and their values used in the simulations are listed in Table 1. To facilitate the calculation, we also applied a fixed length of data packet and ignored the propagation delays. We mainly concern the MAC access delay of the entire multihop relay chain.
IEEE 802.11p specific parameters in simulation.
4.1. Evaluating and Discussing
and StdDev
In Figure 7, we plot

In Figure 7, there are three test scenarios corresponding to 64, 320, and 640 bytes in DATA packet. The accuracy of our analytical model can be maintained for a range of different DATA packet sizes. An increase with the larger DATA packets also can be observed. The length of DATA packet impacts the value of
The backoff stage and backoff interval of every node both grow rapidly, and this finally increases the value of
4.2. Evaluating and Discussing CCDF of R
Next, we compare the CCDF of R in the proposed analytical model and simulation result. As presented in Section 3.3, Harr's point estimation is applied to obtain
In Figure 8, we plot the CCDF of relay access delay for one hop, two hops, five hops, and seven hops. The observation concerns the accuracy of the analysis. It is evident that our model assumptions and approximations are suitable for relay access delay considered. Moreover, we also can find that the length of DATA packet impacts on the CCDF of R.

The complementary cumulative distribution function (CCDF) of relay access delay.
We can observe the heavy-tailed distribution shown in Figure 8. There is an initial linearity followed by a faster roll off, which is characteristic of a truncated power-law tail distribution. The power-law exponent decreases with increasing the number of nodes and the point of truncation moves further into the tail with the increasing of DATA packet length. Sakurai and Vu [32] previously proved that the heavy tail is a direct consequence of the exponential growth of the backoff window in the exponential backoff process in the analysis of access delay. Hence, relay access delay can be regarded as a sum of the access delay statistics for truncated binary exponential backoff (BEB) with different value of parameters.
4.3. Delay Requirement in Multimedia Video Delivery
In this section, we investigate the effects of the end-to-end delays on the quality of user's experience in live video transmission. It is clear that the long end-to-end delay degrades quality of live multimedia subjectively. Therefore, it is necessary to study the effect of the delay on the quality of experience degradation. Many researchers have reported the effect of delay on subjectivity of multimedia.
In 2000, Baldi and Ofek proposed a delay requirement in multimedia video delivery and published their research achievements in [56]. Baldi and Ofek consider that 100 ms is a typical upper limit of end-to-end delay for real-time video transmission. Excessively delayed frames beyond this value are ignored and treated similarly to lost frames.
In 2012, Anjum et al. put forward that the end-to-end delay of video dissemination should be measured in terms of its mean, and it was more meaningful to express it as a statistical upper bound in the form of a percentile [57]. In [57], the satisfactory end-to-end delay is less than 150 ms in 95% of the time for video stream in an IP network.
In IEEE 802.11p, available bandwidth is sufficient for commonly used multimedia streaming services. However, delay is an important problem, which is caused mostly by CSMA/CA medium access mechanism of IEEE 802.11p. When the medium is highly occupied by other neighbors’ transmission, CSMA/CA prevents transmitter from sending a packet that may cause MAC access delay. The total effect on the MAC access delay of every vehicle in multihop relay chain is regarded as relay access delay which is a very large part of end-to-end delay under conditions of saturation.
Integrating different kinds of delay requirement in multimedia video delivery [56, 57], 100 ms is an appropriate upper boundary of 95% confidence interval of relay access delay in video dissemination. It means that the 95 percent of relay access delay is less than 100 ms in a live video transmission. As shown in Figure 8(d), when the value of relay access delay is equal to 100 ms, the probability of complementary cumulative distribution function is less than 5%. It means that more than 95 percent of the relay access delay is less than 100 ms, when eight or fewer nodes are in the multihop relay chain.
As shown in Figure 7(a), the expectation of relay access delay increases to the number of nodes in the multihop relay chain. When the number of nodes increases to ten in the multihop relay chain, the upper boundary of 95% confidence interval of relay access delay cannot meet 100 ms requirement. It indicates that IEEE 802.11p cannot satisfy the delay constrains, when the number of nodes in the multihop relay chain is ten or more. This result suggests that IEEE 802.11p cannot meet the delay requirement in multimedia video delivery in the long multihop relay chain, because CSMA/CA mechanism introduces a very large delay under saturation traffic like live video dissemination. In the long multihop relay chain, IEEE 802.11p needs to be improved by introducing noncompetitive MAC access delay, when multimedia video is delivered along the long multihop relay chain to spread driving safety.
5. Conclusions
In this paper, we proposed an analysis method to study the information dissemination process and the relay access delay in multihop relay chain which is an effective structure in the communication between two vehicles. In particular, the analysis developed attempts to relate the expression, the expectation, the variance, and the complementary cumulative distribution function of relay access delay. The proposed model has been proved to be effective in estimating the impact of hops and packet size correlation on the dissemination of information in the network. We hope our research will be helpful in the design and implementation of multimedia dissemination in VANETs by providing probabilistic characteristics of multihop relay delay.
Footnotes
Notation
Conflict of Interests
The authors declare that there is no conflict of interests regarding the publication of this paper.
Acknowledgments
This work was supported in part by the National Key Technology R&D Program no. 2012BAH82F04.