
Abstract
Smart cities are one of the key application domains for the Internet-of-Things paradigm. Extending the Web into the physical realm of a city, by means of the widespread deployment of spatially distributed Internet-addressable devices with sensing and/or actuation capabilities, allows improving efficiency of city services. Vehicles moving around the city become excellent probes when the objective is to gather information across the city in a cost effective manner. Public transportation fleets, taxis, or vehicles such as waste collection trucks cover most of the urban areas with a limited number of vehicles. This paper presents the deployment of a large scale Internet-of-Things testbed that has been carried out in the city of Santander. It extends previous descriptions by providing a specification of one of the unique features of the testbed, namely, the devices that have been installed on 140 buses, taxis, and vans that every day drive around the city. Besides the physical characteristics of the devices installed and the lessons learnt during the deployment, the paper introduces the three mobile sensing network strategies used for distributing the data gathered. Finally, the paper sketches some of smart city services which might be provided using the information coming from the mobile IoT devices.
1. Introduction
Improving efficiency of city services and facilitating a more sustainable development of cities are the main drivers of the smart city concept. The growth and change in cities are accelerating and make it even harder to provide a sustainable urban living environment [1]. The use of an Information and Communication Technologies- (ICT-) based infrastructure alongside the traditional utilities and services infrastructures will be the next big step in the development of cities [2, 3]. Information systems will help to optimise infrastructure, inform citizens, and build a communication network that spans the city and allows tailoring the utility and services delivery to the actual needs rather than to overprovision for peak demands; in turn, the confluence of ICT and city services will fuel economic growth and prosperity and will form new city ecosystems. This revolution is still only at the beginning as suitable infrastructures are being deployed and significant investments into the city infrastructures are being made.
Based on this precept, the SmartSantander project [4] targeted the creation of a European experimental test facility for the research and experimentation of architectures, key enabling technologies, services, and applications for the Internet of Things (IoT) in the context of a smart city. This facility aims to leverage key IoT-enabling technologies and to provide the research community with a unique-in-the-world platform for large-scale IoT experimentation and evaluation under real-world operational conditions. The objectives of SmartSantander's deployed IoT infrastructure are two-fold as well as concurrent. As a testbed, it enables experimental assessment of cutting-edge scientific research. However, this testbed goes beyond the experimental validation of novel IoT technologies. It also aims at supporting the assessment of the socioeconomical acceptance of new IoT solutions and the quantification of service usability and performance with end users in the loop.
To attract the widest interest and demonstrate the usefulness of the SmartSantander platform, the deployment of the IoT experimentation infrastructure has been undertaken to realise the most interesting and impact-generation experimentation scenarios. In this sense, part of the SmartSantander's testbed is based on the deployment of 140 IoT devices on vehicles that are continuously driving around the city. Such a deployment has, to the best of our knowledge, not any analogous one in any of the testbeds existing nowadays in the world. In addition to enabling experimentation on vehicular networking technologies, IoT devices embarked on vehicles get, as mobile sensors, a variety of information with increased capillarity in time and space that allows gathering data from all over the city in a much more efficient manner. This capacity for getting information from almost the whole city area is critical in supporting the provision of smart city services.
Two main contributions are presented in this paper. Firstly, as the deployment of distributed multipurpose multistakeholder mobile IoT infrastructure is complexity-fraught and not risk-averse (often a compromise over platform capabilities, overall usefulness, and cost), we regard the experience gained and lessons learnt from our physical deployment process as a valuable contribution. In this respect, the paper provides detailed insight on the actual physical deployment of 140 IoT devices embarked on buses, taxis, and other city services vehicles and how they interoperate with the rest of devices present at the SmartSantander IoT infrastructure.
It is, however, important to highlight, for the sake of completeness, and to fully understand the technical relevance of this first contribution, which are the main functionalities and related challenges that underlie the deployment and setup of the experimental infrastructure. In this sense, the experimentation possibilities enabled by existing testbeds, which are primarily focused on wireless sensor network (WSN) research, do not fully fulfill the testbed methodologies needed to perform experimentally driven research when moving from islands of WSNs to a global networked infrastructure—as envisioned by the Internet of Things. This vision opens up new challenges that demand new capabilities and features from suitable testbeds [5, 6]. Key features that have been observed for the deployment of the SmartSantander platform in general and the mobile IoT devices in particular to support the experimentation when moving from WSNs to IoT are (1) scale, (2) heterogeneity, (3) mobility, (4) experimentation realism, (5) data-centricity, (6) concurrency, and (7) autonomy.
Second contribution presented in the paper is the description and discussion of the three strategies that are used to address the mobile crowd sensing challenge. Respectively, they are based on periodic reporting through mobile broadband network, opportunistic Vehicle-to-Infrastructure (V2I) networking on top of IEEE 802.15.4 links, and Delay Tolerant Network (DTN) approach using IEEE 802.11. Moreover, analytical assessment of the V2I-based strategy using real data traces as obtained from the mobile IoT devices is also presented.
Finally, the description of two smart city services that make use of the data gathered by the embarked IoT devices is another minor contribution presented in the paper. Presenting these services is meant to showcase the potentiality of the deployed infrastructure besides the experimentation support, which focused on the analyses done. However, it is out of the scope of this paper to assess the deployment in terms of how the information gathered thanks to this deployment has optimized the city management.
The paper is organized as follows. In Section 2 related work and research activities are summarized highlighting the advances achieved by the contributions presented in the paper. Section 3 provides insights on the deployed IoT infrastructure. It first sketches the SmartSantander platform before focusing on the details and lessons learnt from the installation of IoT devices on vehicles. Results from the analytical assessment of the strategies employed for mobile crowd sensing data dissemination are presented in Section 4 along with the description of the three data dissemination strategies. In Section 5 two smart city applications exploiting the information gathered by the mobile IoT devices deployed are described. Finally, Section 6 concludes the paper.
2. Related Work
This section overviews current trend in terms of application scenarios and main research path in vehicular networks (VANETs) and how the smart city applications described in this paper represent an advance on the applicability of VANETs. Then it outlines related real-world deployments and initiatives in which vehicles are used as sensing platforms comparing them with the sensing infrastructure described in this paper. Finally, a review of various mobile sensing proposals in the literature is presented comparing the architecture and data dissemination strategies used with the ones implemented in the SmartSantander mobile sensing testbed.
Many different services have been proposed in the literature using VANETs like CarTel [7], TrafficView [8], or MobEyes [9]. These services are mainly focused on safety applications like collision warning, up-to-date traffic information, or active navigation [10]. Thus, much of the existing literature has focused on challenges around efficient data dissemination [11] as it is of particular interest for safety services. Anyway, the common denominator for the majority of applications is that they are navigation or road safety related and, thus, concentrate on the vehicles and circulation domains rather than serving to domains outside the traffic circumstances. However, vehicular networks have the potential to become important sensor platforms, for example, for proactive urban monitoring and for sharing and disseminating data of general interest. Each vehicle can sense one or more events (e.g., detecting toxic chemicals), process sensed data, and report this information to a common sensor platform.
In this sense, the general philosophy of smart cities [2, 12] is a paradigm shift combining IoT and M2M infrastructures with a citizen-centric model, all together leveraging massive data collected by sensors, connected devices, social applications, and so forth. Most of the existing smart city initiatives with relevant sensor deployments like Santander [13], Barcelona [14], Oulu [15], or Cambridge [16] rely on static environments, with application-specific monitoring tasks. However, in the very last years, there are a number of deployments and applications in which vehicles are being used to monitor different parameters of the city. The Copenhagen Wheel [17], a project of the SENSEable City Lab at the Massachusetts Institute of Technology (MIT), places environmental sensors on the rear wheel of a bicycle which connects via Bluetooth to the cyclist smartphone and from there potentially shared. However, to the best of our knowledge, this was a short-term project with limited penetration and results. LIVE Singapore [18] is another project from MIT in collaboration with Singapore authorities which is developing an open platform for the collection, the combination, and fusion as well as the distribution of real-time data that originate from a large number of different sources. Some of the information is taken from taxis investigating how in the future the system can be streamlined in order to better match taxi supply and demand. Cab Spotting [19] traces San Francisco's taxi cabs as they travel throughout the Bay Area. The patterns traced by each cab create a living map of city life that hints at economic, social, and cultural trends that are otherwise invisible. The deployment of vehicle-mounted sensing devices described in this paper and the applications exploiting the information gathered by them are much in line with these projects. They aim at using information captured through a vehicular network on general-purpose applications within the smart city scenario. Analogous experimental testbeds focused on mobility have also been deployed [5]. While a minority can compare in the number of mobile devices [20], they do not combine at similar scale fixed and mobile devices and they are not deployed in real-world conditions. Large scale of the deployed infrastructure and its integration on a Future Internet enabled platform are the key distinguishing novelties of the testbed presented in this paper.
Even though cities on developed countries can rely on the coverage of their territory with 3G or LTE high capacity wireless access networks, the expected growth of mobile data traffic might overwhelm these infrastructures if another capillary network paradigm is not put forward [21]. Lee and Gerla [22] overviewed various wireless access methods in vehicular environments. However, the exact potential of large-scale urban mobile capillary networks is still to be exactly quantified. For example, the ubiquity of WiFi access in urban areas makes this solution particularly interesting. Some studies have focused on its potential (e.g., [23]), concluding that a relevant percentage of the data can be offloaded from the cellular infrastructure in high density areas. Moreover, another interesting feature that has been also explored is the ability of mobile sensing nodes to store the data, instead of periodically reporting it to sinks [24]. For example, MetroSense [25] proposes an architecture for mobile sensing: servers in the wired Internet are in charge of storing/processing sensed data; Internet-connected stationary gateways (GWs) act as sensor access points between servers and mobile sensors (MS); MS move in the field opportunistically delegating tasks to each other, and “muling” [26] data to GW. The main data dissemination strategy implemented for the SmartSantander mobile sensing deployment is based on periodic reporting using cellular access network. However, opportunistic offloading of sensed data through short- and medium-range wireless access technologies such as IEEE 802.15.4 and IEEE 802.11 has also been used. Analysis performed to real data traces obtained from the embarked devices has demonstrated the suitability, under certain conditions, of the implemented mechanisms.
3. Large-Scale IoT Smart City Testbed
Setting an experimental facility into a city context has special significance for three main reasons: (1) the pervasiveness of IoT-based technologies that form part of the smart city infrastructure fabric and the realism of experimentation achieved through their use; (2) the infrastructural scale and heterogeneity (devices, protocols, and services) and the population of users that are key enablers for a broad range of experimentation; (3) the diversity of problems and application domains in dense technosocial ecosystems such as smart cities that provide invaluable sources of challenging functional and nonfunctional requirements.
Before presenting the insights of the mobile sensing part of the SmartSantander infrastructure, this section, first, briefly describes the SmartSantander platform high-level architecture and the fixed part of the IoT infrastructure in order to put the whole IoT deployment in context.
3.1. SmartSantander IoT Platform Reference Model
The SmartSantander platform follows a three-tiered architecture consisting of an IoT device tier, an IoT GW tier, and server tier.
The IoT node tier provides the necessary experimentation substrate consisting of IoT devices. These devices are typically resource-constrained (in terms of power, memory, and energy availability) and export sensing or actuating capabilities. This tier accounts for the majority of the devices utilised in the testbed. Due to their outdoor deployment, these devices are subject to harsh environmental conditions (physical damage, weather influences, and power supply). For dependability, dual power supplies (electric distribution network combined with batteries) and dual communication interfaces are installed. For reliability, multiple communication paths to a gateway are enabled for sensor reading collection and for maintenance (e.g., over-the-air firmware and application updates) and a set of management procedures are implemented to ensure rapid detection of malfunctioning nodes.
The IoT gateway node tier links the IoT devices at the edges of the network to a core network infrastructure. The GW tier devices are typically more powerful than IoT nodes but at the same can still be based on embedded device architectures and are thus more resource-constrained than devices of the server tier.
The server tier provides more powerful server devices which are directly connected to the core network infrastructure. The servers can be used to host IoT data repositories and application servers that can be configured to realise a variety of different IoT services and applications or to investigate approaches for real-world data mining and knowledge engineering. The server tier might benefit from virtualisation in a cloud infrastructure, ensuring high reliability and availability of all components and services.
The proposed architecture is agnostic to the communication technologies between the different elements at the different tiers. In this sense, realizations of the architecture can be carried out using different communication technologies between servers, GW nodes, and IoT nodes.
In order to realize this architecture, we propose a reference model for IoT experimentation testbeds that encompasses both testbed observation/management and IoT experimentation planes. We contend that such facilities require, as illustrated in Figure 1, the provision of testbed features by four main subsystems: (1) Authentication, Authorisation, and Accounting (AAA), (2) Testbed Management, (3) Experimental Support, and (4) Application Support. The AAA subsystem controls the access to the testbed by authenticating users, authorising the invocation of particular testbed services based on user privileges, and monitoring the level of platform-use by users. The Testbed Management subsystem encapsulates the functionalities concerning the automatic management of the facility. The Experimentation Support Subsystem (ESS) provides operations to assist the user during the entire experimentation life-cycle [27]. The Application Support Subsystem (ASS) offers, via its Application Support Interface (ASI), a wide range of data management functions that can operate on information retrieved from the devices at the IoT node tier.
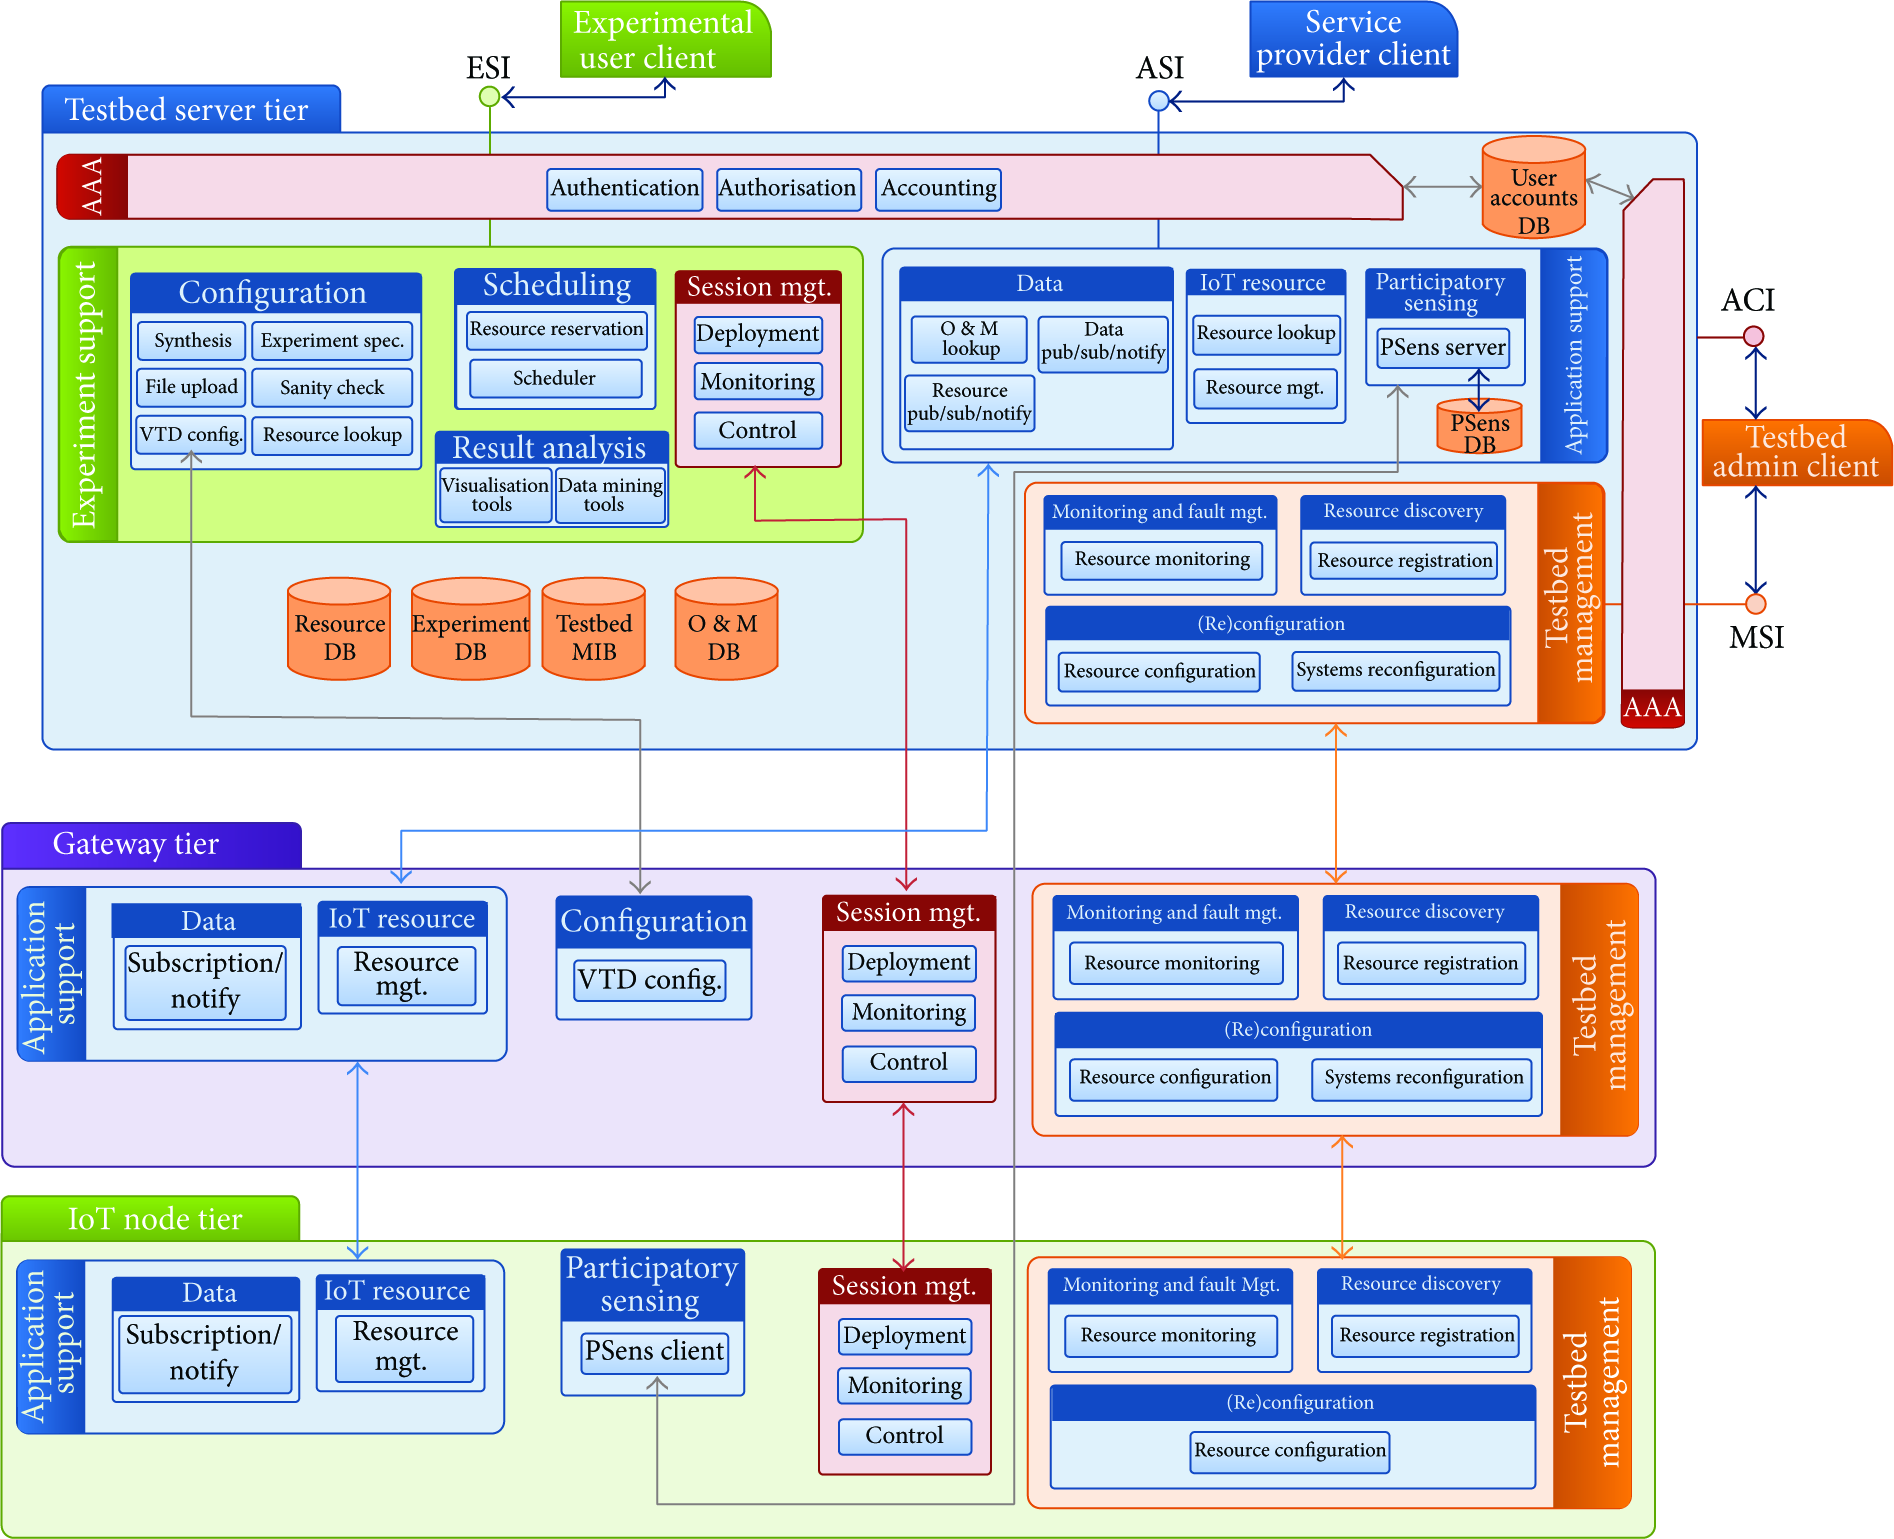
Reference model architecture of the SmartSantander facility.
In our reference model, each subsystem comprises several functional blocks that implement the functionality expected from the subsystem. Subsystems may span across the three tiers requiring different components or logic to be deployed at each tier. Subsystems export a number of interfaces. Interfaces in our reference model architecture are notional entities that expose the functionality of the different subsystems through a collection of Application Programming Interfaces (APIs). In concrete instantiations of the reference model, these interfaces may be realised through technologies such as Web Services, RESTful APIs, messaging protocols, or event handling to name but a few.
3.2. Fixed IoT Infrastructure
As reported in previous work [6], existing IoT experimentation facilities have several limitations that make them fail to provide adequate support for the emerging requirements of experimental IoT research. The SmartSantander facility [13] offers a variety of properties and features to overcome many of these shortcomings and integrates them into a holistic experimentation environment.
The IoT experimentation facility deployed in Santander was settled on a cyclic approach. The objective of the first cycle of deployment was to create a meshed Wireless Sensor Network (WSN) on fixed locations that would serve as a testing environment for the experimental validation of advanced WSN-related mechanisms. The deployment, also influenced by the city of Santander smart city service requirements and strategy, intentionally provided a concentration of IoT devices in the city centre (a 1 Km2 area) in order to achieve the maximum possible impact to the citizens. Nonetheless, other city areas are also covered.
Figure 2 shows an excerpt view of the Santander city centre deployment. The different markers represent the deployed nodes (i.e., carbon monoxide (CO), light intensity, noise, temperature, and car presence detection sensors). Following the architecture described in the previous section, the deployment includes clusters of wireless sensors that use one gateway device acting as cluster head.

Santander city centre fixed IoT infrastructure deployment excerpt view.
The first cycle of IoT deployment yielded 740 points of presence in the city. Each point of presence is equipped with several sensors making a total of more than 50 noise sensors, 600 temperature sensors, 500 light intensity sensors, and 30 CO sensors. Additionally, 23 GWs have been installed to ensure connectivity between the IoT node tier and the server tier. In the second cycle, three fixed node clusters were added to the infrastructure totalling approximately 50 more IoT nodes supporting a smart irrigation use case with around 170 additional sensors such as relative humidity, soil moisture, soil temperature, solar radiation, atmospheric pressure, rainfall, or water flow.
Although WSNs are typically considered autonomous in terms of power needs, this assumption does not reconcile with the envisaged high-frequency multiuser usage model of the testbed. Energy autonomy is achieved through the use of long-lasting batteries and, most importantly, energy efficient mechanisms. However, experimentation imposes a stiffer power consumption penalty on IoT nodes that cannot be realistically met by batteries alone.
A hybrid solution to IoT node power requirements was adopted to minimise the infrastructure's energy consumption signature on the power grid but ensure the survivability of its experimentation nodes. To fulfill the need for proximity to a power source, sensor devices were attached to public lampposts at a minimum of 3.5 meters high. The sensor devices are also endowed with rechargeable batteries and a charging circuit. This solution guarantees power supply even under energy-hungry experimentation scenarios.
Sensor nodes installed on lampposts are based on the ATmega1281 microcontroller. Depending on the device, the corresponding sensing probes are connected to a sensor board placed on top of the main board. This enabled the deployment of IoT nodes with diverse sensing capabilities, each with a configuration designed to support particular experiment or smart city service classes. The sensing capabilities of our IoT devices include air quality (temperature and CO sensors), noise (noise sensor), temperature (temperature sensor), luminosity (light and temperature sensors), irrigation monitoring sensor (temperature, relative humidity, soil moisture, and soil temperature sensors), and environmental station (temperature, relative humidity, solar radiation, atmospheric pressure, anemometer, and rainfall sensors).
3.3. Testbed Intertier Connectivity
Intertier connectivity in the SmartSantander testbed (the Santander WSN) is arranged through different communication technologies. This section describes the network topology of the facility. As illustrated in Figure 3, the most noteworthy characteristic of these devices in terms of communication capacities is that they are provisioned to provide two separate wireless communication channels: one for the experimentation plane and one for the management/service plane. The solution adopted at the IoT nodes level was the inclusion of two XBee-Pro radio modules (operating at 2.4 GHz frequency) on each lamppost sensor device. One of the modules implements native IEEE 802.15.4 protocol, whilst the other runs IEEE 802.15.4 protocol modified with the proprietary routing protocol, called Digimesh [28].
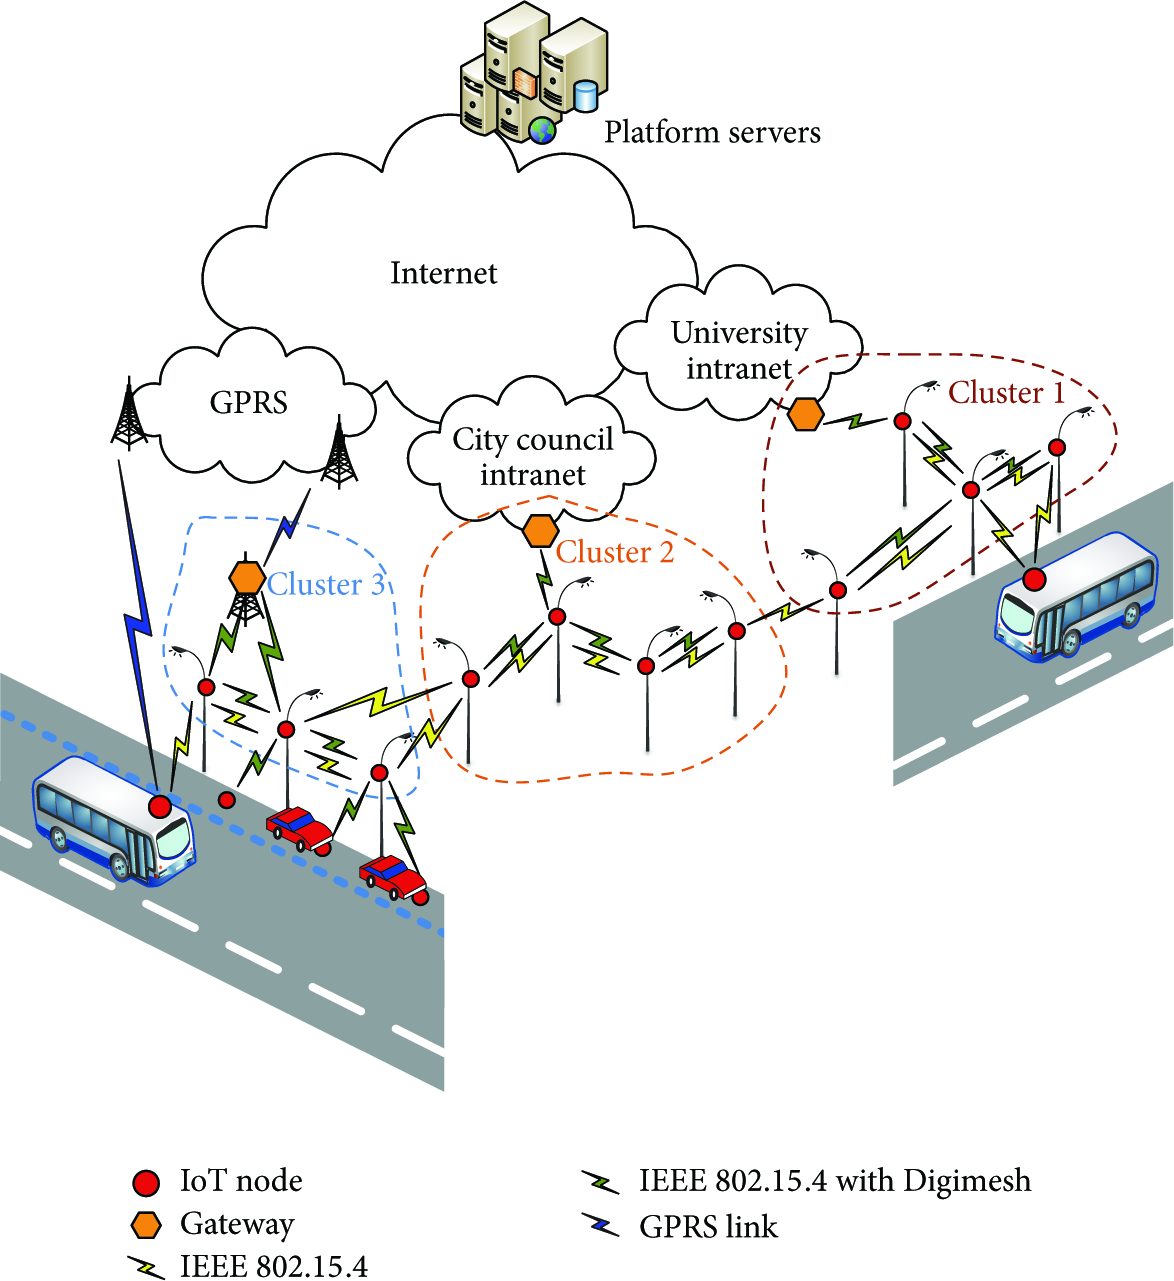
Testbed physical network diagram.
The two interfaces allow the participation of the IoT node in two physically independent wireless networks. All the devices in a cluster form part of the same mesh network enabling multihop data transfer to the gateway and server tier via the Digimesh-enabled radio interface. On the contrary, the testbed does not impose any restriction on the use of the second radio interface. In essence, all the devices deployed are part of the same physical network as long as it is possible to find a set of IEEE 802.15.4 links connecting, on a multihop manner, any pair of the deployed nodes.
Fixed IoT nodes are organised into clusters that form a mesh network of nodes providing both single-hop connectivity (via the native 802.15.4 interface) and multihop data transfer to the GW and server tier (via the Digimesh-enabled radio interface). All the devices in a cluster form part of the same mesh network and may serve the experimentation plane or service plane or both. IoT nodes that are physically close but belong to different cluster groups are not part of the same mesh network and therefore cannot relay each other's sensor observations towards the servers. All sensor observations, testbed management, and experiment management traffic have to be forwarded through the cluster head, that is, the GW node. Multiple egress points for multihome cluster groups have not been considered.
GWs are the cluster heads for the fixed IoT nodes. All sensor observations, testbed management, and experiment management traffic have to be forwarded through the cluster head, that is, the GW node. Multiple egress points for multihome cluster groups have not been considered. Depending on where the GW is deployed, several possibilities for connecting them to the Internet, and thus to the Platform Servers, arise. Whenever it has been possible, GWs have been deployed at one of the City Council or University premises. This kind of location allows direct access to a wired Intranet. If it is not possible to find such location, GPRS connection is used to connect the GW to the core network.
Platform Servers are directly connected to the core network using the network of the University of Cantabria.
Connectivity for the IoT nodes deployed on vehicles differs from the case of static ones. These devices are not part of any cluster but they mainly use a GPRS connection to directly report the observations captured by their sensors and to support testbed and experimentation management procedures. However, as it will be described in the following section, wireless local area connectivity capabilities of some of the IoT devices mounted on vehicles allow these nodes to also communicate with IoT fixed nodes network as long as the vehicle on which they are mounted comes close to them.
3.4. Mobile Sensing Deployment
Once the high-level architecture of the platform and the fixed part of the infrastructure have been briefly introduced, in this section the details of the mobile sensing part of the SmartSantander experimental facility will be presented.
3.4.1. Mobile IoT Devices Description
Although the deployment of fixed IoT devices is very representative as it massively covers Santander city centre, it was necessary to extend the environmental monitoring service to other areas of the city. Hence, instead of continuing with fixed deployments all over the city, 140 new IoT devices were deployed on municipal public buses (84 of them), taxis (30 of them), and other municipal services’ vehicles (26 of them). This way, a much wider area was covered in a much more efficient way. Using the enlarged number of measurement locations and intelligent processing of the measurements, it was possible to obtain sufficiently accurate measurements that are currently used as the initial indicator of the status of the environment pollution.
Figure 4 shows the schema of the devices installed on the vehicles. In order to support the additional requirements imposed by the mobility of the nodes and to maximize the experimentation possibilities over devices on such unrivalled location, the nodes are far more complex than their fixed counterparts.

Mobile IoT device schema.
A modular approach has been followed to address the three main functional requirements imposed to the mobile sensing devices: (1) Experimentation-Service provision duality refers to the duality that the deployed devices have with regard to their use as part of an environmental monitoring smart city service, as well as their use as an experimentation laboratory; (2) Coexistence with the existing fixed SmartSantander infrastructure refers to the fact that access from and to the devices should be possible through the already existing platform not only at the server tier but also on a peer-to-peer manner at the IoT device tier; and (3) Environmental monitoring sensing capacity refers to the environmental monitoring smart city service that expects to receive air pollution information from the mobile sensing devices.
The Main Processing Unit is based on an embedded PC running Linux operating system based on a 32-bit ARM7 processor. Since vehicles are moving all over the city, the communication towards the server tier cannot be handled through a short-range wireless technology as it is the case with the fixed devices. Thus, embarked nodes are equipped with a General Packet Radio Service (GPRS) interface. However, IoT nodes installed on buses have a Local Communication Module. This module has two different configurations. The first one is based on an ATmega1281 microcontroller, equipped with a native IEEE 802.15.4 interface that allows them to communicate not only with other devices deployed on other buses, with the same module configuration, but also with the devices installed on lampposts. This configuration (represented with a dashed border in Figure 4 due to its optionality) is only possible at the public buses since it is the only kind of vehicle where an appropriate rooftop placeholder, shown in Figure 5(a), with Line of Sight (LOS) towards fixed IoT devices could be found. Devices installed on taxis and other municipal services are mainly situated under the vehicle bonnet so, in our deployment, peer-to-peer communication with other IoT devices is not possible for those devices due to radio signal degradation caused by metallic parts of the vehicle. Most of the 84 IoT devices deployed on buses are built with this configuration. The second configuration for the Local Communication Module integrates an IEEE 802.11 interface that can only act in Basic Service Set (BSS) mode (a.k.a. infrastructure mode) so that it can connect to available WiFi access points. Only 6 buses are equipped with an IoT device with this configuration.
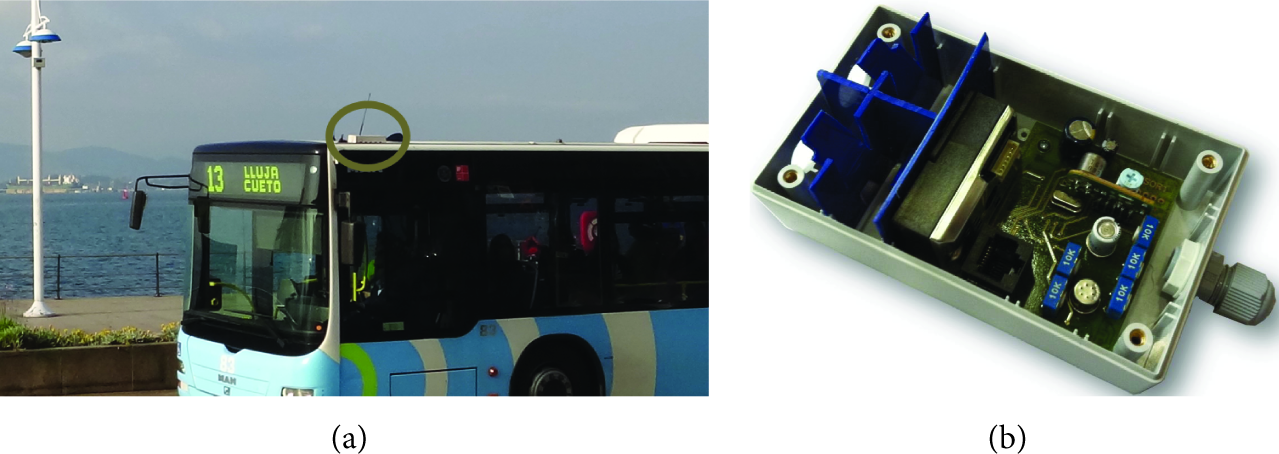
(a) Detail of sensor nodes installed on public bus; (b) Environmental Data Collection Module.
It is important to highlight that the testbed allows complete reprograming of the microcontroller at the Local Communication Module, thus enabling a larger versatility of the devices for supporting advanced experimentation on top of them.
The Environmental Data Collection Module contains a bunch of sensors for detecting air pollutants such as nitrogen dioxide (NO2), carbon monoxide (CO), and ozone (O3) as well as detection of particles in suspension, temperature, and air humidity. Installed on the rooftop, the sensors are protected within an ABS box that is shown in Figure 5(b). In this box, the air inlet traverse a labyrinth designed to allow air flow while preventing water spills in the electronics.
Most significantly, mobile IoT devices are also equipped with GPS so that all their observations come geolocalized and they also report speed and course of the vehicle. Additionally, the nodes deployed on the Santander public buses provide information from the vehicles’ CAN-Bus (represented with dashed line in Figure 4 due to its optionality). The information taken from the vehicles is used to feed the traffic assessment service.
It is also important to mention that observation generation (i.e., gathering of information from the device sensors) frequency is higher than the reporting (i.e., sending this information to the repository at the server tier) one. In this sense, the IoT nodes have a sampling rate that is deliberately configured to generate a large number of observations. As the devices count with a Local Persistence Storage memory, the Environmental Data Collection Module is continuously producing new observations.
3.4.2. Deployment Insights and Lessons Learnt
Apart from presenting the mobile IoT nodes architecture and features, it is essential to highlight some issues that have been addressed during the deployment or have arisen as lessons learnt.
Never forget that the deployed infrastructure aim is to support IoT experimentation, the more information that can be captured, and the widest experimentation possibilities that are opened. Having a budget restriction, the possibility of enlarging the available information by increasing the number of IoT devices has a limit. The approach taken was to overrate the sensing frequency. This way, a larger amount of information could be made available. However, there is also a restriction that applies to this approach; the reporting of all the observations gathered poses a challenge to the networking solution to be implemented. In this sense, the solution adopted reported one observation every five minutes, on a real-time manner, while one observation every 80 seconds is captured. Those observations that are not immediately reported are kept locally and reported through Delay Tolerant Networking (DTN) or opportunistic networking strategies which will be described in Section 4.
The main application for the information produced by mobile IoT nodes, namely, environmental monitoring, does not need observations at such high pace; however, other applications, such as traffic assessment, benefit from this oversampling. Moreover, as it has been already mentioned, the whole SmartSantander deployment is meant to support experimentation on IoT technologies. Massive production of sensor observations is critical to maximize the research and experimentation opportunities on top of the deployed facility.
Concerning the powering of the mobile nodes, it is realized by connecting them to the vehicle electrical batteries. This way, we guarantee a large, practically endless, energy supply to the nodes. This is an aspect of particular importance for experimental testbeds that has been effectively addressed for the different deployments of the SmartSantander testbed. As mobile devices are not only supporting the monitoring of environmental parameters but also enabling experimentation on top of them, extreme duty cycles optimizing power consumption must be discarded. As it has been stated in Section 1, one of the challenges that must be overcome by the experimental testbeds is the avoidance, as much as possible, of restrictions to the experimentation. In this sense, such extreme duty cycles would limit the experimentation possibilities. The solution adopted for powering the mobile nodes through the vehicle batteries allows these nodes to be always on if necessary. However, in order to avoid improbable vehicle battery drain, devices are set to hibernate if the engine of the vehicle is kept off for one hour. As soon as the engine is turn on, the IoT device gets back into fully operative mode.
The decision of installing IoT devices on top of vehicles has demonstrated to be extremely useful and an important lesson learnt itself. The main advantage of installing these devices in vehicles regards the extended range that can be covered in a very cost-effective manner. As it can be seen in Figure 6, the distribution of the devices along the city provides a good coverage of almost the whole city. Additionally, frequent encounters among mobile IoT devices as well as between the mobile and fixed IoT devices enable testing of peer-to-peer networking strategies. In Figure 6(a), the instantaneous position of the mobile IoT devices fleet can be observed. In contrast, in Figure 6(b), an aggregated view of the last 30,000 observations taken by the mobile IoT devices is presented in bubbles gathering all the observations generated in 1000 square meters around. Colour code goes from orange (more than 100) to blue (between 15 and 100) and pink (less than 15). It is also important to mention that mobility is not restricted to the city and some vehicles go far beyond Santander boundaries.
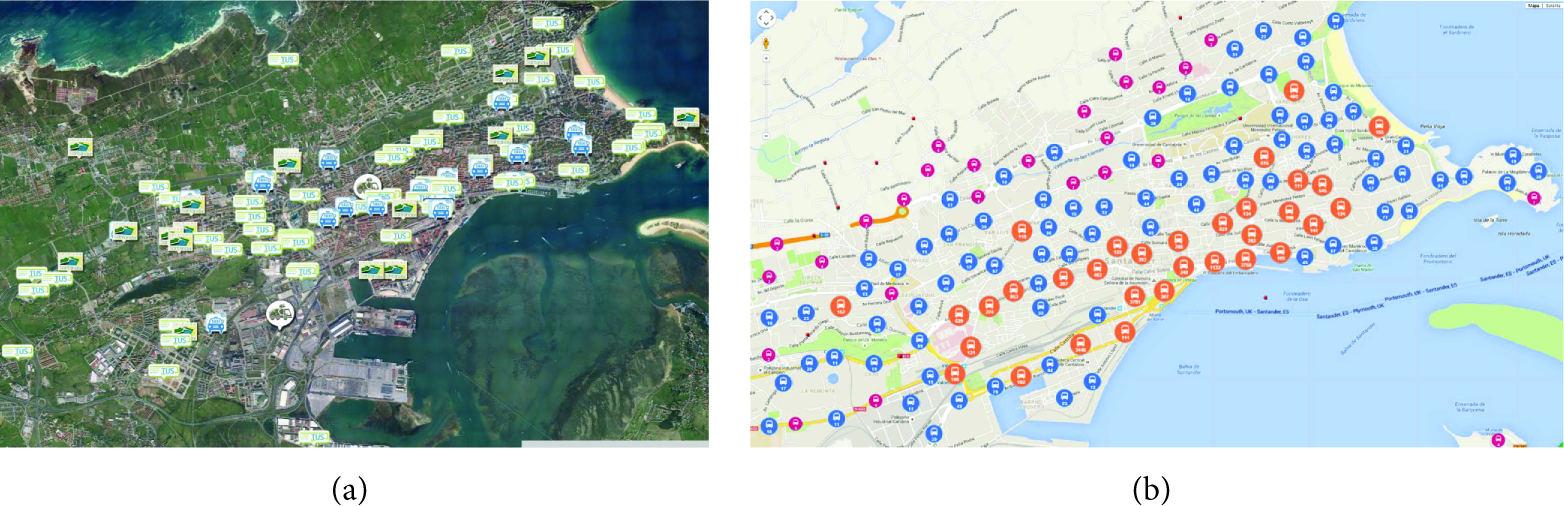
(a) Mobile IoT devices real-time location view; (b) mobile IoT devices aggregated location view.
The connection of the newly deployed devices to the already existing testbed poses also some challenges. It goes without saying that wireless access technologies were the only possibility, not only for the mobile devices but also for the fixed ones due to the geographic scale of the deployment. Using a Wide Area Network (WAN) technology was the straightforward decision to guarantee access availability. However, the main drawback of these networks is the associated cost. The GPRS connection used for the IoT devices deployed was associated with the fleet management service used by the public transportation company, which helped minimizing these costs, but adding communication interfaces using short-range ISM-band technologies to some of the devices has proven to be a wise decision. Besides enabling opportunistic networking solutions, described in Section 4, that add network redundancy thus making the overall system more resilient, it opens new experimentation opportunities since, to the best of our knowledge, there is no experimental testbed in which IEEE 802.15.4 technology can be used for communication among nodes moving at relatively high speeds. Moreover, it is part of the future plans for extending the testbed to include novel IoT-related wireless access technologies, such as SigFox [29] or LoRa [30], which could be tested under real-world conditions.
Last but not least, the installation process had to overcome some hurdles in terms of logistics and casing. Concerning the first aspect, it is important to note that the IoT nodes were installed on vehicles that were on duty. Thus, it was of utmost importance to minimize the installation time. Modular design of the devices helped in this requirement as the different physical modules could be installed in parallel. Pertaining to the casing, this was a major issue for the Environmental Data Collection Module as it had to compulsorily be installed outdoors. The solution adopted for the air inlet to pass an ABS labyrinth has demonstrated to be adequate as no damage due to water or humidity has been recorded even in a rainy city as Santander is.
3.5. Key Success Indicators of the Support for Experimentation
After having presented the details of the installation and described the lessons learnt associated with the actual installation process, in this section we will analyse it in terms of the features identified as most relevant characteristics for supporting IoT experimentation, namely, scale, heterogeneity, mobility, experimentation realism, data-centricity, concurrency, and autonomy, and take them as key success indicators assessing whether the deployed infrastructure has achieved its main goal or not. Since the description has focused on the mobile part of the SmartSantander testbed, the analyses will also concentrate on it.
It is clear that, in terms of scale, the number of mobile IoT devices deployed puts SmartSantander testbed in the top part of the table of any existing experimentation testbeds [5]. However, scale has additional connotations, namely, geographic extension and amount of information generated, which are of special interest for IoT experimentation and are also significantly covered in the testbed.
In terms of heterogeneity, the testbed has focused on information heterogeneity rather than on devices heterogeneity itself. This goes in line with the focus on IoT rather than on WSN. While for WSN experimentation having access to heterogeneous devices is a relevant feature for demonstrating portability of solutions, IoT experimentation requirements are much more service oriented [31] and thus are interested in the services that the infrastructure provides which are in general information-centric.
Enabling experimentation involving mobility is the obvious leap forward enabled by the deployment described in this paper. The main limitation is that only undergone mobility is supported meaning that an experimenter will not be able to control the trajectory of mobile devices. On the other hand, the fact that some of the mobile devices can communicate with the fixed ones must be highlighted as a major enablement of the testbed.
One of the main rationales for experimentally driven research is to be able to challenge the solutions being developed against real-world situations that cannot be modelled in simulation environments. Controlled testbeds (typically indoor) are actually a step forward but they are still restricted in realism terms. The testbed we have described is exposed to real-world conditions which implicitly affect experiments running on top of it. Solutions evaluated under such circumstances will benefit from these contour conditions, thus guaranteeing that the resulting solution is suited to a real-life urban setting.
Data-centricity is another key differentiator between WSN experimentation and IoT one. While, for the first one, focus is put on the devices and how they operate (communicate, internetwork, etc.), IoT builds on top of devices but provides a higher level of abstraction in which the focus is put on the services that objects provide (generally data gathering and reporting). The SmartSantander platform and the mechanisms deployed for intertier communication were implemented with this feature as a fundamental design consideration and the deployed mobile infrastructure has been successfully integrated in it.
Experimentation as a service model has been adopted by the SmartSantander platform so that concurrent experimentation can be handled. This way the underlying infrastructure is decoupled from the experimenters’ requests guaranteeing scalability both in terms of enlarging the deployed infrastructure, where as a matter of fact mobile IoT devices have been seamlessly incorporated into the testbed on a plug and play manner, and in terms of increasing the number of concurrent experiments.
With the scale and variety of testbed management events to track, one cannot assume that human intervention alone is sufficient to provide timely response to events and remediation to faults. Testbed management automation has been incorporated keeping the human in the loop only for decision-making and policy-specification. Moreover, there are other aspects, more related to the deployment and networking, that have been put forward in order to maximize testbed autonomy. Firstly, the energy demands from the infrastructure, which are augmented due to experimentation support necessity, have been tackled during the installation process guaranteeing large enough energy sources for all the mobile IoT devices. Secondly, multiple intertier communication networking solutions have been adopted in order to avoid single point of failure problems and maximize testbed resiliency.
4. Mobile Sensing Data Distribution Strategies
Data distribution is one of the key aspects to be solved in order to fully exploit the potential of a sensing infrastructure based on vehicle-mounted IoT devices. In this sense, as already introduced, the three-tiered architecture defined specifies that access to the information gathered at the IoT tier must be reported towards the components at the server tier since these latter ones are the responsible for making it available to the applications and services consuming this information.
In the following subsections the three different observations reporting strategies employed for the Santander deployment will be described.
4.1. WAN-Based Observations Reporting
4.1.1. Strategy Description
To be really effective, smart city services have to enable citizens and organisations to make well-informed decisions in a timely fashion. As the value of information can fall rapidly, smart city services need to be capable of capturing relevant information in real-time and distributing it in a format that citizens and organisations can act on immediately.
WAN-based observations reporting strategy make use of the GPRS interface with which all the IoT devices installed on the vehicles of the SmartSantander's facility are equipped. These IoT devices are programmed to periodically send an observation to the so-called GW for mobile nodes (GW4MN). This element, directly connected to the server tier, forwards these observations to the appropriate repository.
The periodicity with which observations are reported is a tunable parameter depending on time, distance, or a combination of both. Thus, an observation can be reported every certain number of seconds, when the vehicle has travelled a specific number of meters or when the first of these two conditions occur. Currently, this reporting frequency is fixed to five minutes.
4.1.2. Strategy Discussion
This reporting strategy is used as the baseline for the SmartSantander deployment. It guarantees sufficiently fresh information since GPRS coverage of the city is almost 100% assured. Moreover, it supports real-time event-based asynchronous reporting. Additionally, it is the only one that can be implemented by all the IoT devices installed on the SmartSantander's vehicles as it does not depend on the optional Local Communication Module.
The main drawback for this strategy is that frequent connection through the cellular network is costly in terms of energy and should be restricted in terms of quantity of data due to economic costs.
While the power consumption is not a major issue due to the fact that nodes installed are connected to the vehicle battery in order to guarantee permanent and almost endless access to energy, the economic cost associated with this reporting strategy should not be neglected. The solution adopted to minimize the impact and keep these costs to a minimum while maintaining the experimental facility grade of service was to negotiate the commercial contract for the mobile nodes deployment in conjunction with the Santander municipality mobile phone lines service. This way it was possible to get competitive fees as economies of scale apply. However, it is clear that although it was possible to minimize the communication costs, reaching a trade-off between observations reporting freshness and cost, it is important to develop other observations reporting strategies that reduce the costs while increasing the amount of information retrieved.
4.2. V2I-Based Opportunistic Observations Reporting
4.2.1. Strategy Description
As the vehicles circulate around the city, they might come close to some of the fixed IoT devices. As it has been introduced in Section 3, IoT devices installed on the Santander's public transportation buses were equipped with a Local Communication Module which in the majority of cases included an IEEE 802.15.4. This module was installed on the roofs of the buses in order to enable direct communication between the embarked IoT devices and the fixed ones as long as they come close enough. Taking advantage of this condition another observations reporting strategy has been implemented exploiting Vehicle-to-Infrastructure (V2I) opportunistic networking.
Observations gathered by mobile IoT devices that are not immediately reported through the WAN-based reporting strategy are kept at the Local Persistence Storage repository inside the IoT device. IoT devices on the buses opportunistically try to report observations on this repository by broadcasting them as soon as they come close to any of the fixed IoT devices. Once one of these broadcasted reports reaches one of the fixed IoT devices, this device acknowledges its reception. Upon the reception of this acknowledgement the device that originated the observation should consider it reported and remove it from the Local Persistence Storage repository.
4.2.2. Strategy Experimental Assessment
Figure 7(a) shows an excerpt of the fixed IoT devices locations. Devices are represented in the figure with blue dots. These devices are the ones that, among all the deployed ones, are located at streets coinciding with buses lines. As it can be seen, they are basically deployed along both sides of Santander's main city centre avenues. Correspondingly, Figure 7(b) shows the locations where IoT devices embarked on the buses came across one of the fixed nodes, thus being able to opportunistically report one or more locally stored observations. The meetings presented were detected just on a single day (September 1, 2014).
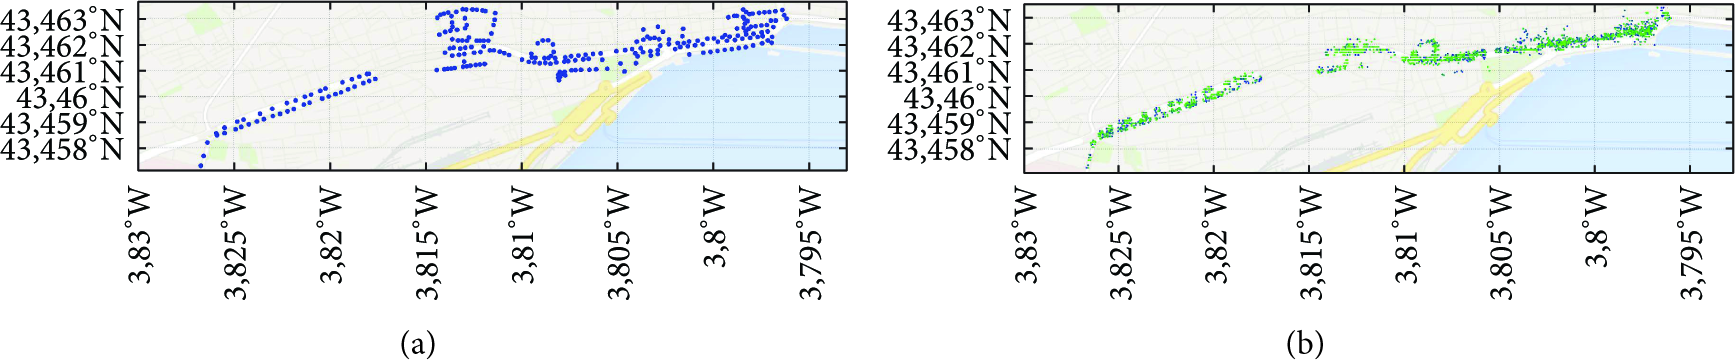
(a) Fixed IoT devices location at city centre; (b) mobile IoT devices opportunistic reporting positions.
The results on the figure can be extrapolated to any weekday. Table 1 presents the results of the analysis done to this parameter during the first fifteen days of September 2014 analysing the number of reporting opportunities from all the mobile devices. Public transportation timetable is slightly modified on weekends affecting the distribution and overall number of fixed-mobile devices encounters. The meeting points shown in Figure 7(b) are colour-coded on a per mobile IoT device manner; this is, every device is assigned a colour on the blue to green range.
Mean number and standard deviation of fixed-mobile devices encounters per day.
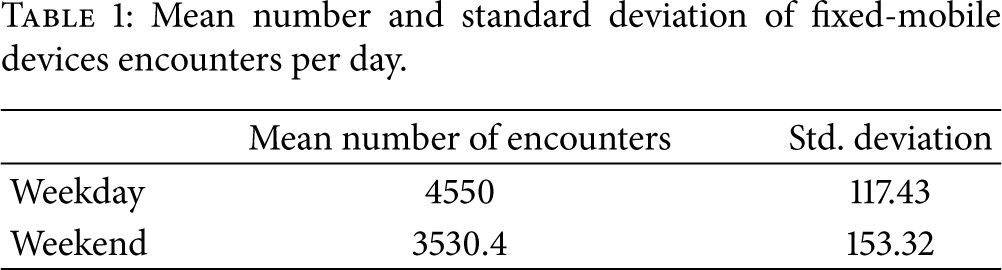
The aggregated number of encounters presented in Table 1 does not reflect the fact that they are not uniformly distributed among all the devices embarked on the different buses. While there are buses which are assigned to lines that regularly pass through the streets on which the fixed IoT devices are installed, others do it less frequently or just do not circulate on the fixed deployment area. Figure 8 shows the probability density function for the number of observations reporting opportunities per day among all the mobile IoT devices during the analysed period (first fifteen days of September 2014). As it can be seen, it follows a normal distribution with the mean around 82 encounters and a standard deviation of 43.

Observations reporting opportunities per mobile IoT device probability density function.
Figure 9 shows the observation reporting opportunities time distribution of four different devices during one of the days analysed (September 1). Thirty-minute interval analysis is performed. It presents the amount of encounters between the mobile device and any of the fixed ones on that particular interval.

Time distribution of mobile IoT devices reporting opportunities.
4.2.3. Strategy Discussion
The main drawback of this solution is that it does not provide any guarantee on the timely manner in which observations are reported.
As it has been experimentally demonstrated, encounters occur on a time-scattered way. This is, for the same mobile device they concentrate on a, typically reduced, number of consecutive intervals (so-called opportunity periods) followed by several intervals in which no reporting opportunity is detected (so-called silent periods). These periods, respectively, correspond to the timeframes in which the buses circulate around the city centre (where SmartSantander's fixed infrastructure is deployed) and those that their lines make them drive outside the downtown area. The analysis done has been conducted over the reporting opportunities that the devices installed on vehicles have. However, it is important to note that it might be possible to report several observations per opportunity.
The result of this kind of behaviour is that while observations gathered during the opportunity periods might have the chance to be timely reported using V2I-based strategy, those gathered during silent periods will have to wait till the next opportunity period to be reported. Moreover, stored observations gathered during silent periods will be reported first during the next opportunity period thus delaying those observations gathered during that opportunity period. Typically opportunity periods are large enough to report the observations gathered during the previous silent period and catch up with the ones gathered in that opportunity period.
In contrast, this approach allows for large amount of information to be made available at no additional communication costs.
From the analysis of these results, we can conclude that even when this reporting strategy might not be used as the baseline reporting solution, it provides an efficient manner to enrich the sensing capacity of such a vehicular-based infrastructure without having to rely on mobile networks.
Moreover, it is also important to highlight that since buses follow a predictive trajectory, the time when data could be reported could be forecast. So reporting date can be predictive and periodic. Thus, although the solution assessment has not analysed the actual delay statistics (i.e., mean delay for observations reported using this method), the results let us envisaging, without losing generality, that for noncritic, delay-tolerant applications it could actually be used as the default approach.
4.3. Batched Observations Reporting
4.3.1. Strategy Description
The last of the observations reporting strategies implemented is also based on the ability of the mobile devices to locally store the observations which they produce but which have not been reported. In this case, the fixed infrastructure will not be composed by the fixed IoT devices rolled out in the city but mobile IoT devices will try to connect to IEEE 802.11b hotspots in order to upload all the observations in their local storage.
Low data rate of IEEE 802.15.4 interfaces made it only possible to report observations one by one. However, batched mode can be used thanks to the relative high data rate of IEEE 802.11b. It is important to note that every observation is just some bytes long so even in the worst case the batch will be just some kilobytes.
The current implementation of this strategy is limited to the WiFi hotspot at the bus depot. This way, when buses end their shift every night and come back to the depot they can download the observations stored throughout the day.
4.3.2. Strategy Discussion
Similar to the case of the V2I-based reporting strategy, the main advantage associated with this mode of sending the gathered observations to the SmartSantander platform is the possibility of reporting a big amount of data in a costless manner. Bearing in mind that power consumption is not a problem thanks to the way the nodes were installed connected to the large batteries of the vehicles, frequency of the observations gathering (note the contrast between gathering and reporting) could be increased as much as necessary.
Likewise, the drawback for this reporting strategy is clearly the impossibility of guaranteeing timely transfer of data to the SmartSantander platform server tier. In this sense, applications with strict requirements in terms of delay could not be supported using this way of reporting observations gathered by mobile devices.
Extending this implementation to other hotspots around the city would be possible by enabling dynamic hotspot discovery and connection. This would enhance the time-related behaviour of this solution but would not completely solve the problem nor would it enable the support of event-based applications. Thus, it would be necessary to assess if the performance improvement compensates the costs of rolling out and managing these hotspots.
4.4. Data Distribution Strategies Discussion
One of the lessons learnt through the operation of SmartSantander IoT infrastructure is the crucial need, which might become a fatal bottleneck, for efficient data distribution solutions that take the information from the devices out in the wild towards the IoT platforms. Data gathering and disseminating are fundamental mechanisms of smart services and infrastructures which stresses the need for efficient, city-wide, and manifold communication networks.
Besides the individual discussions at the end of each of the above sections which had focused on presenting the main advantages and drawbacks for the proposed reporting strategies, it is also interesting to analyse them with regard to the application requirements. Table 2 presents the evaluation of some of the main key performance indicators in terms of requirements imposed by applications making use of the information gathered by the mobile devices deployed.
Application requirements key performance indicators.

The capacity of cellular networks, even those that are now being planned, will be really challenged by the increasing demands of IoT-like infrastructures. Besides the raw capacity discussion, what is clear is that it is advisable to exploit other networking strategies in order to accommodate the reporting of sensor observations in the most efficient manner.
The assessment made to the opportunistic strategy has confirmed that while applications with real-time demands could not be handled due to the potential delays in which this approach incurs, these delays might be bearable for applications with relaxed time constraints. They compensate this with an unbounded capacity at no additional cost and keeping confidentiality and integrity of information.
In this sense, combining traditional Wide Area Network (WAN) networks such as broadband mobile networks with less-conventional networking solutions such as hotspot connectivity or multihop communications is an appealing answer to broadcasting geolocalized information efficiently.
Analysis performed to real data traces obtained from the embarked devices has demonstrated the benefits that, under certain conditions, the implemented mechanisms could bring to the data distribution challenge in this kind of networks.
5. Smart City Applications
Deploying the devices and gathering the information they continuously generate are just the first step towards the final aim of the testbed described in previous sections. It goes without saying that the key aspect of an IoT infrastructure is its capacity to enrich the understanding of the city behaviour. This advanced knowledge makes it possible to optimize the city management procedures as well as to enable more informed, and thus smarter, decisions by the citizens. A brief description of two potential applications for the information gathered through the mobile sensing infrastructure rolled out in Santander will be presented in this section.
5.1. Environmental Monitoring
As it has been introduced in Section 3, the sensors with which mobile IoT devices are equipped are mainly aimed at measuring air quality parameters like carbon monoxide, nitrogen dioxide, ozone, or dust particles in suspension. Additionally, they also count with general weather sensors like temperature and relative humidity.
Besides more professional and skilled use of the information gathered by weather and environment technicians in complex studies that can be used in forecasting or public safety, citizens can be directly informed by means of applications including general city conditions dashboards in which panels like the ones shown in Figure 10 can be presented. Easily understandable graphical representations, like heatmaps, of almost real-time data would be warmly welcome by citizens interested in knowing about their city.

Real-time environmental monitoring Santander area heatmaps. (a) Temperature (°C); (b) relative humidity (%); (c) dust particles (mg/m3); and (d) carbon monoxide (mg/m2).
Despite the actual values of the parameters observed and shown in each of the maps in Figure 10, the aim of these maps is to show to the reader the capacity of covering the city area with a certainly limited number of devices. Observations carried out by the mobile devices could, in a cost-effective way, feed mathematical estimation algorithms which are used nowadays with a twofold objective, firstly, to assess current algorithms that with a little number of fixed sensors extrapolate the conditions in other areas and, secondly, to fine-tune the values resulting from mathematical interpolation with values gathered from physical observation of the corresponding parameter.
5.2. Traffic Conditions Assessment
Nowadays, most of the traffic conditions assessment applications are based on information gathered from inductive loops buried in the city streets. While this infrastructure provides consistent information, it has two main drawbacks. Firstly, real-time information gathering is not provided. Secondly, deployment and management costs are not negligible as they include road works every now and then to keep the infrastructure operational.
It is already possible to find in the literature [32, 33] experiences in which Floating Car Data paradigm is employed to perform traffic estimation. With a good number of vehicles moving around the city it would be possible to enrich currently available traffic condition assessment applications with the information on speed and course gathered by the mobile IoT devices as they circulate across the city. Figure 11 shows colour-coded (green for fluid, yellow for moderate, and red for dense) assessment of the Santander streets’ traffic conditions. This map is part of a smartphone app which is currently using the information from the inductive loops but is being extended to receive also the information from the mobile IoT devices.

Smarter Travel [34] screenshot.
6. Conclusions
Vehicular networking will be inevitably part of the IoT scenario and smart cities are one of the most evident examples of the IoT applicability potential. This paper focuses on the description of a large-scale IoT testbed deployed at the city of Santander with special emphasis on the devices that have been installed on 140 vehicles that circulate all over the city daily. It presents the detailed description of the embarked devices and analyses the experimentation alternatives that they enable. In this sense, particular stress is put on the mobile IoT devices features enabling, through short-range low-power radio technologies, the interaction not only among them but also with the fixed infrastructure deployed at Santander streets. We expect that this description will promote a better knowledge of the testbed features and experimentation scenarios that it enables and assist IoT experimenters to prepare such experiments.
Three different mobile sensing data distribution strategies have been implemented in the testbed and they have been described in this paper, while the main data dissemination strategy implemented for the SmartSantander mobile sensing deployment is based on periodic reporting using cellular access network. However, opportunistic offloading of sensed data through short- and medium-range wireless access technologies such as IEEE 802.15.4 and IEEE 802.11 has also been used. Future work in this area will focus on complementing the analysis with a detailed study of the delay conditions for V2I-based strategy. Moreover, the practical implementation of opportunistic batched reporting at hotspots different from bus depot will also complement currently implemented solutions.
Finally, a brief description of two smart city applications for the information gathered through the mobile sensing infrastructure has been presented as easily understandable examples of the added value that can be obtained thanks to real-world roll-outs of IoT (fixed and mobile) technology.
Footnotes
Conflict of Interests
The authors declare that there is no conflict of interests regarding the publication of this paper.
Acknowledgments
This work has been partially funded by Research Project SmartSantander, under FP7-ICT-2009-5 of the 7th Framework Programme of the European Community. The authors would like to acknowledge the collaboration with the rest of partners within the consortium leading to the results presented in this paper. The authors would also like to express their gratitude to the Spanish government for the funding in the following project: “Connectivity as a Service: Access for the Internet of the Future,” COSAIF (TEC2012-38574-C02-01).