
Abstract
Changes in natural light in the daily cycle and monthly cycle and its seasonal changes create rhythms in bodies of living creatures including humans. The circadian rhythm connected to natural light stimulates psychological states and hormonal changes. As such, natural light is a major environmental factor that affects humans' psychological and physiological conditions. To create healthy and comfortable lighting environments in windowless space such as a basement where no natural light can enter, the daily, monthly, and seasonal cycles of natural light need to be represented by means of artificial lightings. Upon certain situations related to purposes of space and user behaviors, lighting control technology is required for appropriate lighting environments. To this end, this study designs and implements a natural light reproduction system based on context awareness in wireless sensor networks to restructure lighting environments in adaptation to the changing situation of the occupant. As the object space in the experiment, a clothing shop to occupy the largest portion of underground space was selected. The scenarios were selected for each time period in connection with the behaviors of the seller who resided there for a long time. The suggested system's performance was evaluated in terms of conformity with natural light, comfort, and energy-saving effect.
1. Introduction
As large populations and a variety of facilities are concentrated in a limited ground space, industrialization and urbanization accelerate, resulting in various environmental problems such as lack of available land, increase of land prices, traffic congestion, and greenery reduction [1]. Today, underground space is recognized as an alternative in this regard, and internal facilities such as transportation, housing, and industrial infrastructures are expanding into basement space accordingly [2, 3]. However, without natural light, underground space involves various problems such as insufficient natural light, lack of a sense of change, and a sense of isolation. To address such challenges, artificial lighting is essential. In particular, for healthy and comfortable lighting environments in windowless space such as a basement, it is necessary to recognize spatial characteristics and changes in a situation to create appropriate lighting conditions accordingly [4, 5].
As to existing lighting methods such as fluorescent light, incandescent light, and halogen bulb, the efficiency is low and they are unable to control the luminance as the user requires. In contrast, as high-efficient, long-lifespan led lightings were developed recently in combination with LED semiconductor and IT technologies for digital control, it has become possible to vary the lighting environments [6–8]. As a result, lighting systems that maximize the functional features of space by controlling the optical characteristics of LED, such as illuminance and color temperature, are increasing in wireless sensor networks. There are few researches, on the other hand, that examine lighting systems designed for the occupants' health and comfort as well as functional aspects of space.
According to existing researches, changes in daily, monthly, and seasonal cycles in line with the earth's rotation and revolution around the sun create certain rhythms in living things including humans. Since such circadian rhythm connected to natural light affects psychological states and hormonal changes significantly, it functions as a stimulant [9–11]. As such, natural light is a crucial factor for living creatures and functions as an important environmental factor that affects humans' psychological and physiological conditions [12, 13]. Hence, to create lighting environments that are healthy and comfortable in windowless spaces, it is necessary to represent the characteristics and cyclical rhythms of natural light by means of artificial lighting methods.
Currently, underground lighting environments are designed in terms of spatial functions, and most of them maintain the lighting environments intended in the initial stage of design. As a result, occupants of underground space have to stay under poor, initially designed lighting environments for a long period of time and are exposed to high illuminance and color temperature. Such conditions cause various health problems such as stress and discomfort [14]. Various routines such as working, dining, and resting in the same space may occur depending on the situation. A lighting environment is a major factor in relation to each of these activities. Hence, it is necessary to maintain lighting environments according to the purpose of space as well as situational changes.
Existing studies analyzed a type of natural light with which humans would feel most comfortable and comparatively analyzed natural light with the colors of LED lighting to represent similar LED lighting conditions. One research examined lighting systems based on situational recognition to reflect changes in various characteristics of light and to sense the changing surroundings of an occupant [9, 15–18]. However, there are few researches on light-controlling systems that actually measure and construct a database of optical characteristics of natural light and LED, represent natural light in a certain space, interpret the surroundings of an occupant, and provide appropriate lighting environments accordingly.
This study aims to represent a variety of rhythms of light depending on changes in daily, monthly, and seasonal cycles of natural light by means of artificial lighting methods especially for windowless space such as underground space. It designs and implements a natural light reproduction system based on context awareness in wireless sensor networks through which appropriate lighting environments are created upon certain situations related to spatial characteristics and occupants' behaviors. To evaluate the suggested system's performance, a clothing shop which would occupy the largest portion of underground space was selected as an object space for the experiment, and the light-controlling scenarios were designed for a seller residing in that area for a long time. Such factors as conformity with the characteristics of natural light, comfort, and energy consumption were analyzed in comparison with existing lighting environments.
2. Experiment and Analysis
2.1. Natural Light Characteristics
To provide a lighting environment similar to that of natural light by means of artificial lighting methods in windowless space such as underground space where there is no natural light, it is necessary to actually measure and analyze natural light characteristics that would change depending on the daily, monthly, and seasonal cycles of natural light. Figure 1 shows the autologging system designed to measure natural light characteristics twice a week on selected days—clear, cloudy, and dark. Consisting of the chroma meter, spectrometer, and camera, the autologging system measured and accumulated in the database the optical characteristics of natural light including color coordinates, spectral distribution, illuminance, and color temperature at every minute from 6 am to 7 pm in consideration of the sunrise and sunset times. Table 1 shows the climate conditions on the experiment days—clear (October 3), cloudy (September 22), and dark and rainy (September 28).
Climate conditions on the experiment dsays.

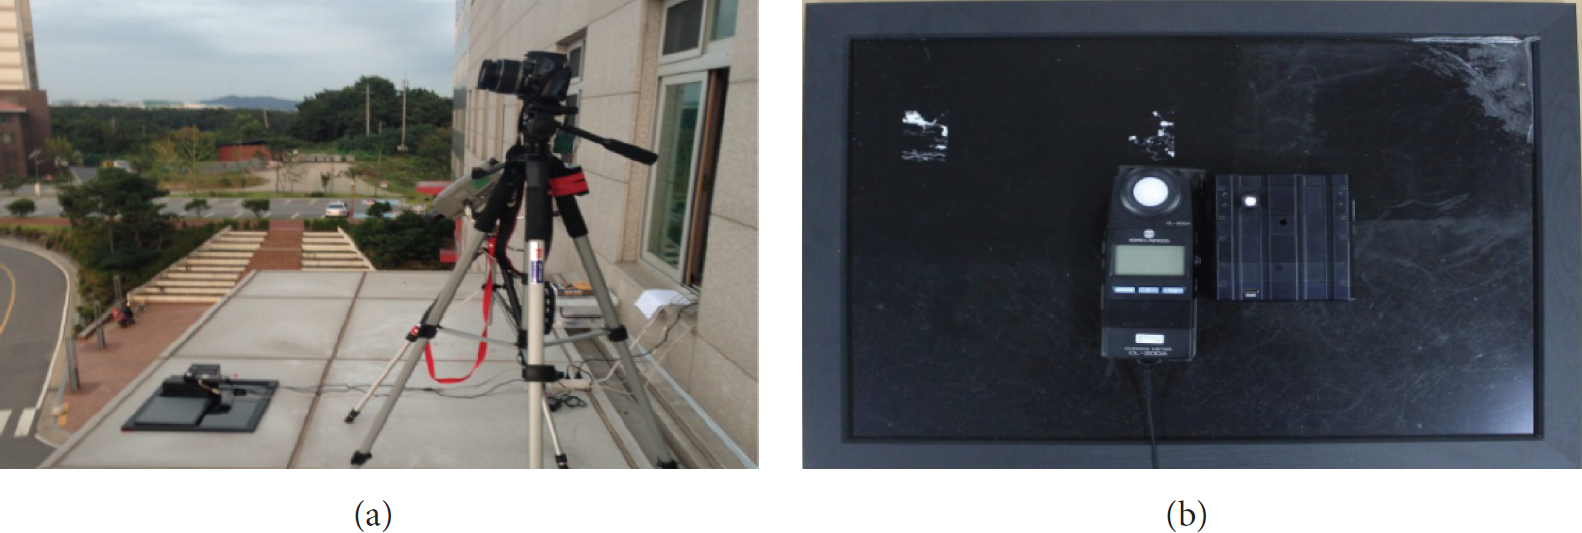
Autologging system based on natural light characteristics.
As illustrated in Figure 2(a), the experiment results show that on a clear (October 3) day with no cloud and on a cloudy day (September 22), the level of illuminance was a maximum of 91,733 lx and 96,035 lx, respectively. As illustrated in Figure 2(c), in contrast, on a rainy day (September 28), the level of illuminance was significantly low. On a clear day, the level of illuminance increased or decreased in a similar pattern over time, while on a cloudy day during which the average amount of clouds was 7, the volume of clouds frequently changed, causing the light intensity and color temperature to drastically change. While the range of color temperature on a clear day varied from 3,871 K to 6,406 K, the range of that on cloudy and rainy days was limited to 5,231 K–6,692 K, and the color temperature was consistently high compared to that on a clear day.

Natural light patterns changing depending on the climate conditions.
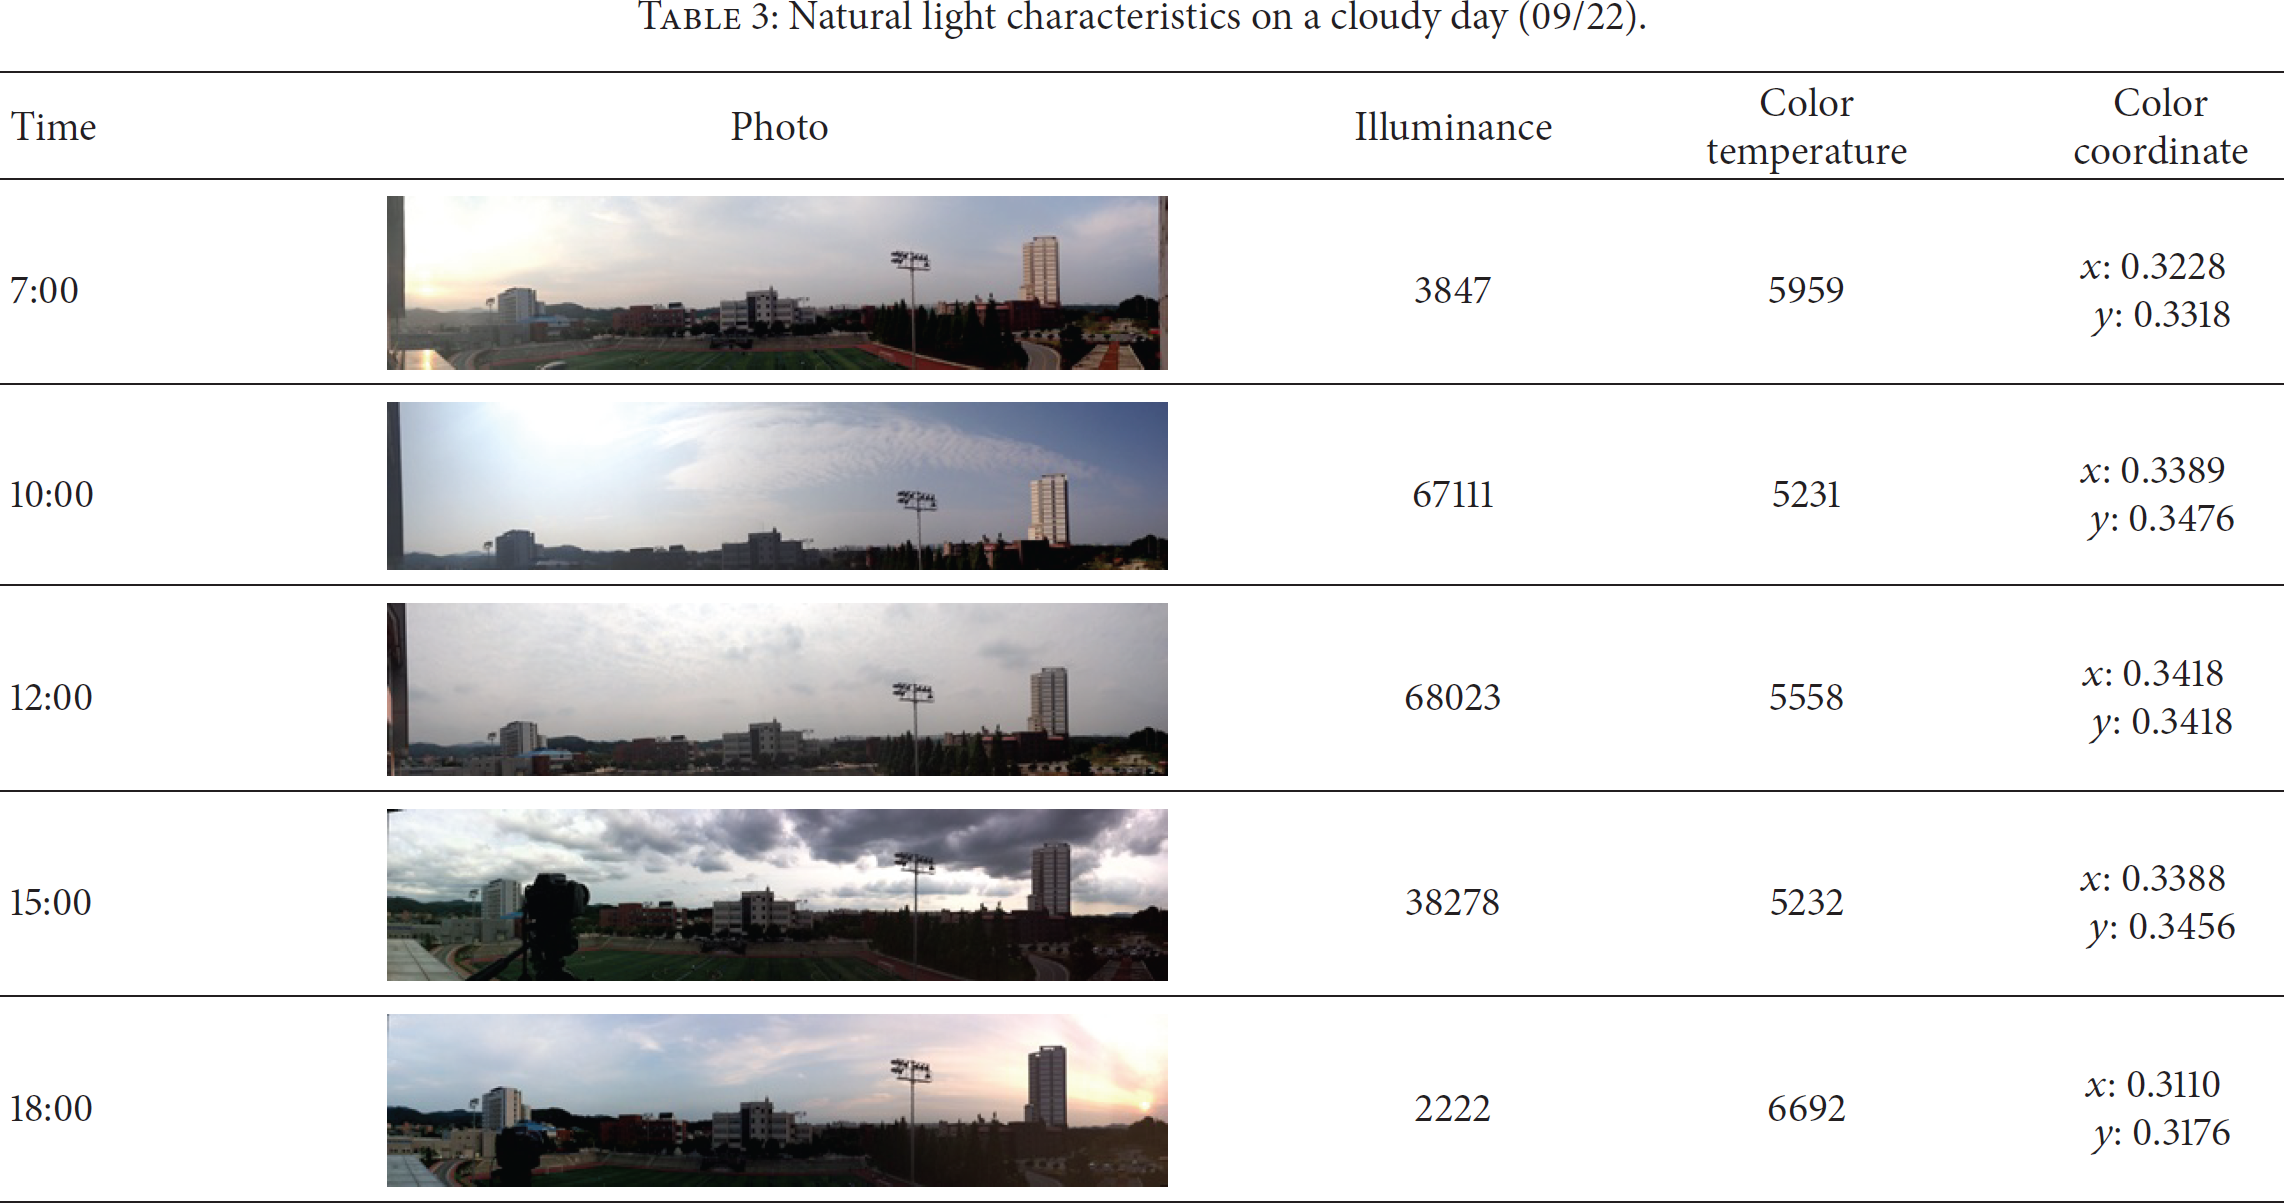
Data of natural light characteristics constantly changing depending on the time, season, and climate condition during the experiment is accumulated in the database and utilized for the artificial light controlling. Tables 2–4 show the extracted values at the course of sunrise (07:00), morning (10:00), noon (12:00), afternoon (15:00), and sunset (18:00) during the day that reflected the optical characteristics on the clear (October 3), cloudy (September 22), and dark/rainy (September 28) days with the panorama pictures. Unlike cloudy and dark/rainy days, the color temperature distribution was low during sunrise and sunset and showed an orange hue on a clear day. During daytime, the sky was blue and cloudless. On a cloudy day, red light was less than during the sunrise and sunset than on a clear day. In daytime, frequent movements of clouds drastically changed the value of illuminance, with color temperature relatively high. On a dark and rainy day, the distribution of color temperature remained high during sunrise and sunset, similar to that during daytime. The value of illuminance was far lower than that in clear and cloudy days.
Natural light characteristics on a clear day (10/03).

Natural light characteristics on a cloudy day (09/22).
Natural light characteristics on a dark and rainy day (09/28).

2.2. Artificial Light Characteristics
To control lighting environments flexibly and appropriately depending on the changing surroundings of an occupant as well as the characteristics of the space, it is necessary to actually measure changes in optical characteristics and construct a database on the basis of the hardware characteristics and controllable range of a lighting system. Accordingly, this study measures and saves optical characteristics in utilization of indoor LED lightings with the hardware features illustrated in Table 5 and designs the indexes for lighting environments of a basement clothing shop in different situations. As to the data transmission between the lighting controller and gateway, ZigBee wireless communication in accord with IEEE 802.15.4 was utilized.
Hardware characteristics of indoor LED lightings.

Table 6 illustrates the structure of the transmission packet for wWcW LED lighting control. The total length from STX (0x06), the beginning of a message, to ETX (0x07), the end of it, is 13 bytes. In ModuleID (1 byte) and GatewayID (2 bytes), IDs to distinguish each lighting and gateway are saved. Information to classify lighting types depending on luminous source combinations such as RGB and warm and cool is saved in Module Type (1 byte). In the 5-byte-long data (RGB lighting: 3 bytes; wWcW lighting: 2 bytes) area, the controlling percentage depending on the lighting type is saved. Basically, valid message packets are filtered by means of CRC (2 bytes) information.
Structure of a transmission packet for warm/cool LED lighting control.

As shown in Figure 3, changes in the color temperature, illuminance, and power consumption of artificial lightings depending on the dimming stages were measured in the experiment by means of the Lighting Box (1.2 M × 1.2 M × 2 M). To block light from outside, N5 painting was thoroughly applied so that a darkroom was created. By means of the experiment equipment and Java-based dimming application as shown in Table 7, the optical characteristic-measuring experiment was conducted for each dimming stage of the artificial lighting. The procedures were as follows.
Experiment environments for artificial light characteristic measurement.


Lighting box.
Step 1.
Install indoor lightings within a lighting box in consideration of the reasonable locations in a residential place.
Step 2.
Put the chroma meter and spectrometer on the position of 0.85 m from the ground; install the power meter and camera at the proper locations to collect data on the optical characteristics, power consumption, and images of the artificial lightings.
Step 3.
Set the dimming steps of the indoor LED lightings to 5 and controlling interval to 20 seconds for dimming. The changes in the artificial light characteristics were saved in the autologging file and database at every second. The experiments were divided to that for the characteristics of each luminous source and that for changes in the optical changes depending on the combination ratio.
Step 4.
The collected data of optical characteristics of the artificial lightings were integrated based on the times of measuring, and then the average for every 10 seconds was calculated.
The experiments were divided into the basic experiment to grasp the characteristics of each luminous source and another experiment that controls luminous sources in different combinations. Each luminous source was controlled with the five stages of dimming taken one after another. As shown in Figures 4 and 5, the value of illuminance lineally increased, and the value of color temperature was 2,700 K and 5,800 K, respectively. In the measurement of optical characteristics and power consumption with the five stages of dimming of warm white LED and cool white LED taken one after another simultaneously, the value of illuminance lineally increased as shown in Figure 6, but the value of color temperature was about 3,900 K similar to the average of the two luminous sources. While the power consumption of the two luminous sources was the same, cool white LED luminous source was brighter than warm white LED luminous source because of the difference in output illuminance values depending on the dimming stages of each luminous source. In the controlling section from 0 to 50, it failed to reach 3.3 W, the minimum driving power of the lighting devices, and thus they were not turned on (see Figure 7).

Optical characteristics of warm LED.

Optical characteristics of cool LED.
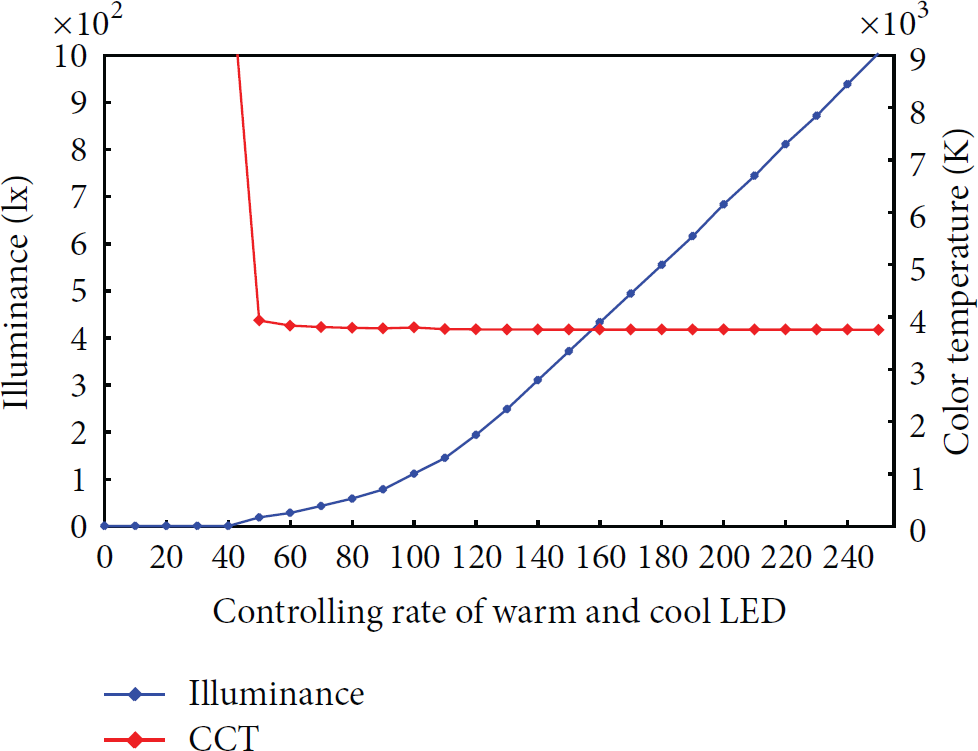
Optical characteristics of warm and cool LED.

Power consumption of warm and cool LED.
Figures 8 and 9 show the actual measurements of the illuminance and color temperature that changed depending on the combinations of luminous sources. It was possible to control the illuminance and color temperature in the range of 0–885 lx and from 2,700 K to 5,857 K. As in the basic experiment, the value of illuminance lineally increased in proportion to the dimming ratio, and the value of color temperature was low or high depending on the combinations of warm white LED and Cool White LED. Such optical characteristics of artificial lightings are analyzed in comparison with natural light characteristics and then can be utilized to create lighting conditions appropriate for the changing surroundings of an occupant.

Controllable range of illuminance.

Controllable range of color temperature.
3. Natural Light Reproduction System Based on Context Awareness
3.1. System Design
Figure 10 shows the suggested natural light reproduction system based on context awareness. By means of the three types of sensors (PIR, piezoelectric, electric power) supporting ZigBee wireless communication, various kinds of situational information around the seller staying in the underground clothing shop was collected. Situation information collected through sensors is utilized as input data of an interpretation algorithm, based on which the surroundings of the occupant such as persons in presence and behaviors of the occupant are determined. Once the situation is interpreted, such factors as illuminance and color temperature in the lighting environment are adjusted by means of the lighting condition indexes for each situation stored in the database so that the lighting condition service is provided according to the inhabitant's situation. Figure 11 shows the general process of the context awareness structure for interpretation after the collection and integration of context information collected from each sensor.
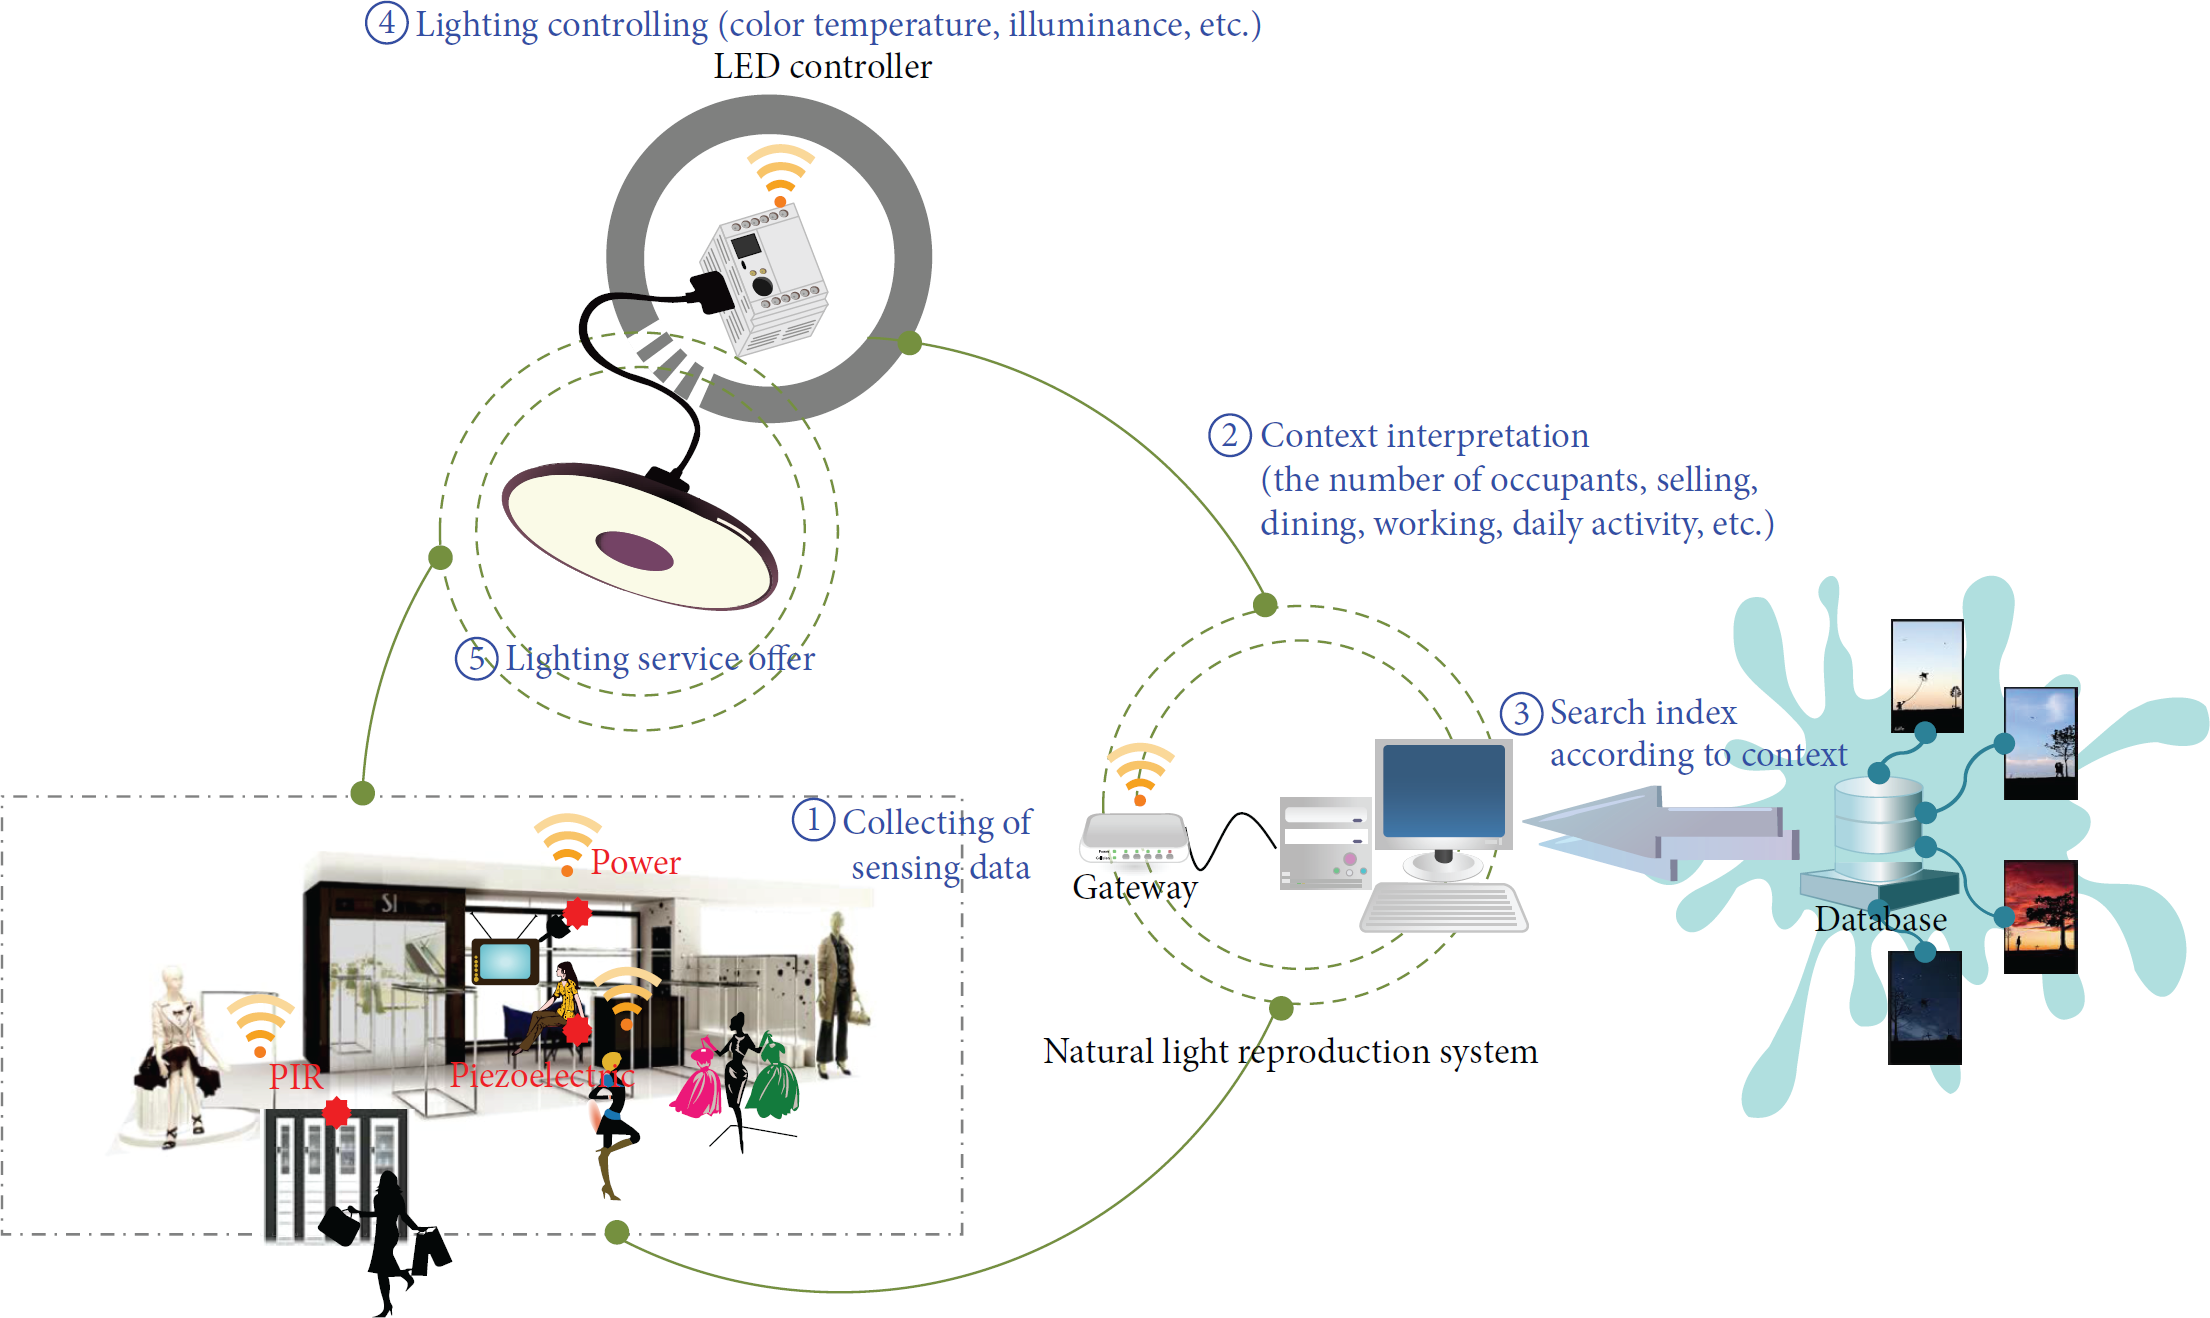
Overall system configuration.

Flow of context awareness.
(i) Context Collector. By means of PIR, piezoelectric, and electric power sensors, context collector obtains information on internal situations such as climate condition, and time, as well as external situations such as whether there is an object in presence, actions, and so forth. Once such information is saved in the History Database, it is delivered to the data integrator.
(ii) Context Aggregator. The collected situation information is a form of raw data. For appropriate service to be provided to users, it should be regenerated through an integration process. For instance, information on external situation collected by means of the power sensor and piezoelectric is combined with information on internal situation including weather and time to infer a certain situation.
(iii) Context Interpreter. Context interpreter interprets each context of “dining,” “working,” “daily routine,” and “selling” in reference to the index database where the sensor data combined through the integrator and the inhabitant's contexts are defined.
(iv) Reasoning Engine. Reasoning engine infers lighting conditions appropriate for the interpreted context by means of the “context interpreter” and in reference to the standard index for lighting conditions stored in the index database.
Table 8 shows the workflow of defining and determining four different situations—dining, working, daily activity, and selling—based on acts of a seller staying in the underground clothing shop for a long time. When there is one in presence, it indicates that the seller is the only one staying in that space. Such factors as time, whether a seat is taken, and power consumption are recognized to interpret each situation of dining, working, and daily activity. When there is more than one in presence, it indicates that a customer is with the seller in that space, which means a situation of “selling.” Each of the interpreted situations is delivered to the reasoning engine, and then the appropriate lighting environment is created in reference to the standard for that situation from the Index Database. The information of the current environment is then saved in the history database.
Situation defining and determining.

To interpret the situation by means of raw data received from each sensor, the data needs to be converted into an integrated message as shown in Table 9. PIR sensors are attached to the inside and outside of the gate and used to recognize the entrance and exit based on the time difference sensed by each sensor. In reference to the recognized entrance and exit data, the number of persons in the space is calculated: if there is one occupant, the data is converted to “1” seller and “0” customer; if the number of occupants is 2 or more, the data is converted to “1” seller and “1” customer. This way, an integrated message is generated to check the presence of a seller and/or a customer. The changes in currency measured by piezoelectric sensors are converted, when the measured change in the electric current is under 10, to “0” which indicates a seat is not taken, and when it is over the value, to “1” which indicates a seat is taken. Power sensors measure the minimum power consumption of each electronic device and convert the data into “0” or “1” to generate an integrated message.
Generation of an integrated message.

Table 10 shows an integrated message made by converting raw data from each sensor into binary code values. The value of an integrated message may be varied depending on the surroundings of a user such as the external context information. The collector recognizes PIR sensors inside and outside of the gate in the order, and it judges the presence of a seller and/or a customer and converts the code value of a seller and/or a customer into “1.” When a piezoelectric sensor recognizes a seat taken during meal time from 11 am to 1 pm, the internal situation information, which is a time data set, and the external situation information, data from a piezoelectric sensor, are processed by the integrated message manager and converted to the code value of “1010” indicating that the seller is “having a meal.” Reasoning engine then creates a lighting environment by adjusting the illuminance and color temperature according to the interpreted “dining” situation. Figure 12 illustrates the process of context awareness by means of an integrated message.
Integrated message for situational recognition.


Process of context interpretation.
As shown in Figure 13, the system suggested in this study consists of the system server and the sensor field with sensor nodes. The data collected from each sensor node is saved in packets and sent to base node. Packets saved in base node are delivered to the server through a serial port, go through the data converting and verifying the process, and are utilized as input data for context interpretation.

Diagram of a sensor network.
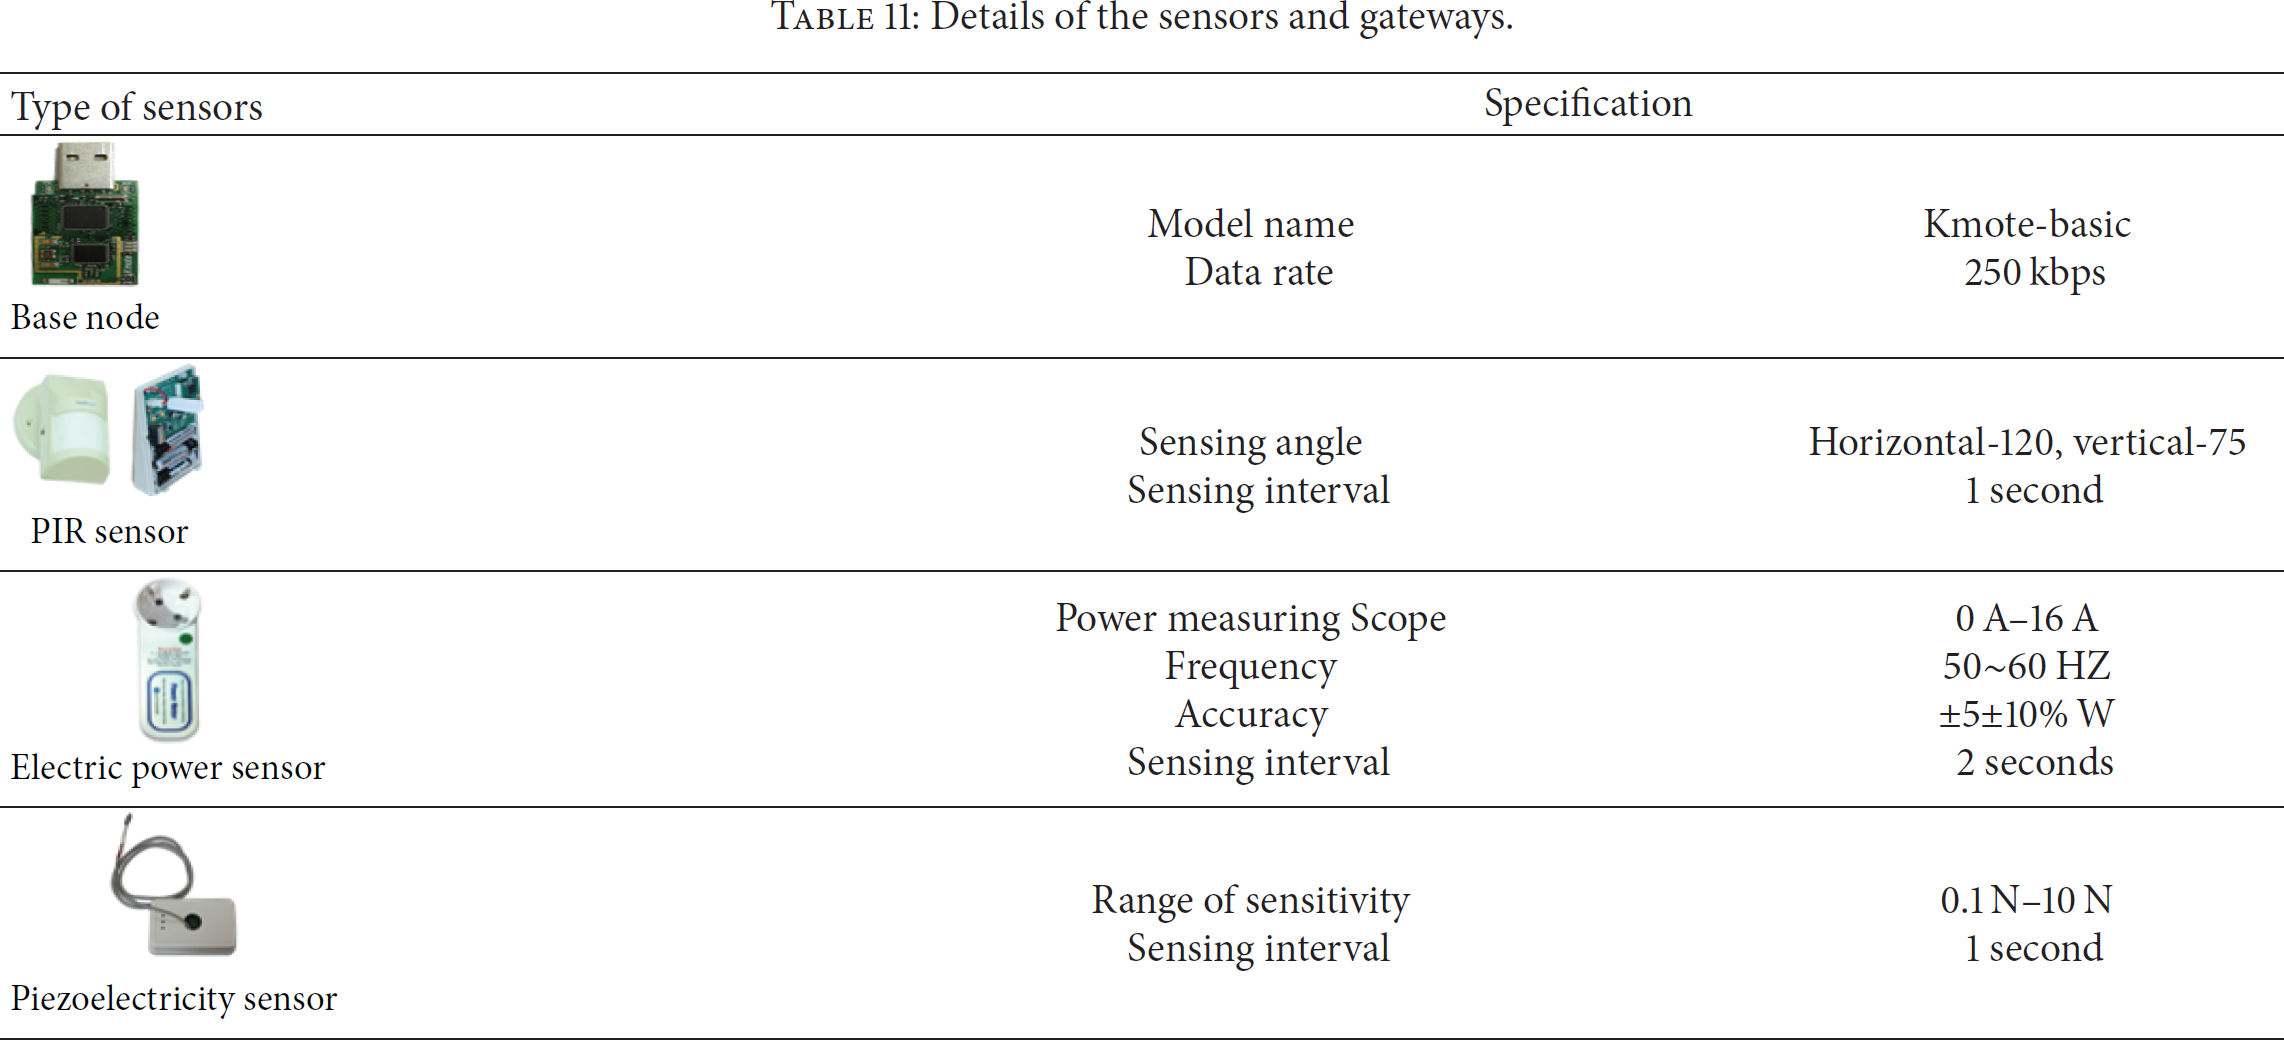
The sensor network contains the sensors and gateways of the hardware characteristics shown in Table 11. The data collected by each sensor is sent to the gateway through the packets whose structures are shown in Table 12. The types of 33 byte packet data are an identifier to classify PIR, piezoelectric, and power sensor. Node ID identifies difference among the same type of sensors. For context recognition, data collected by each sensor is saved in the area of raw data, and this indicates the presence of a user by “0” or “1” the actual measurements that are converted to the output voltage correspond to the power consumption of electric appliances in use and external force applied to piezoelectric elements.
Details of the sensors and gateways.
Packet structure of a sensor.

A PIR Sensor (Pyroelectric Infrared Ray Sensor) recognizes infrared ray waves and heats emitted from humans and animals. With the sensing angle narrowed, the sensors were installed on the inside and outside of the wall of the gate to recognize the entrance and exit of users in the order. Power meter sensor was designed to recognize user behavior, as well as changes in the power consumption of linked electric appliances. Piezoelectric sensor converts vibration generated by an instant force into electric signals. This is used to recognize when a user takes a seat. Figure 14 shows the location of installation and ways of utilization of each sensor.

Installation location and use of sensors.
3.2. System Implementation
Figure 15 shows the GUI screen of the suggested system, which contains functions such as monitoring, LED control, inquiry, and setting. The monitoring screen is used to refer to details of LED lighting environments that might change depending on spatial characteristics, time flow, and occupants' specific behaviors. The LED control screen consists of three types of controlling modes: first, manual controlling method that provides input fields through which a user can enter his preferred lighting environment; second, schedule-based LED light controlling method that changes lighting environments flexibly over time; and third, situation-based LED light controlling method that creates lighting environments according to the lighting environment indexes in recognition of the surroundings of an occupant by means of sensors. The inquiry screen shows the details of each lighting and the histories of lighting use. The setting screen contains additional functions such as grouping of LED lightings installed in the space, and communication linkage/disconnection.
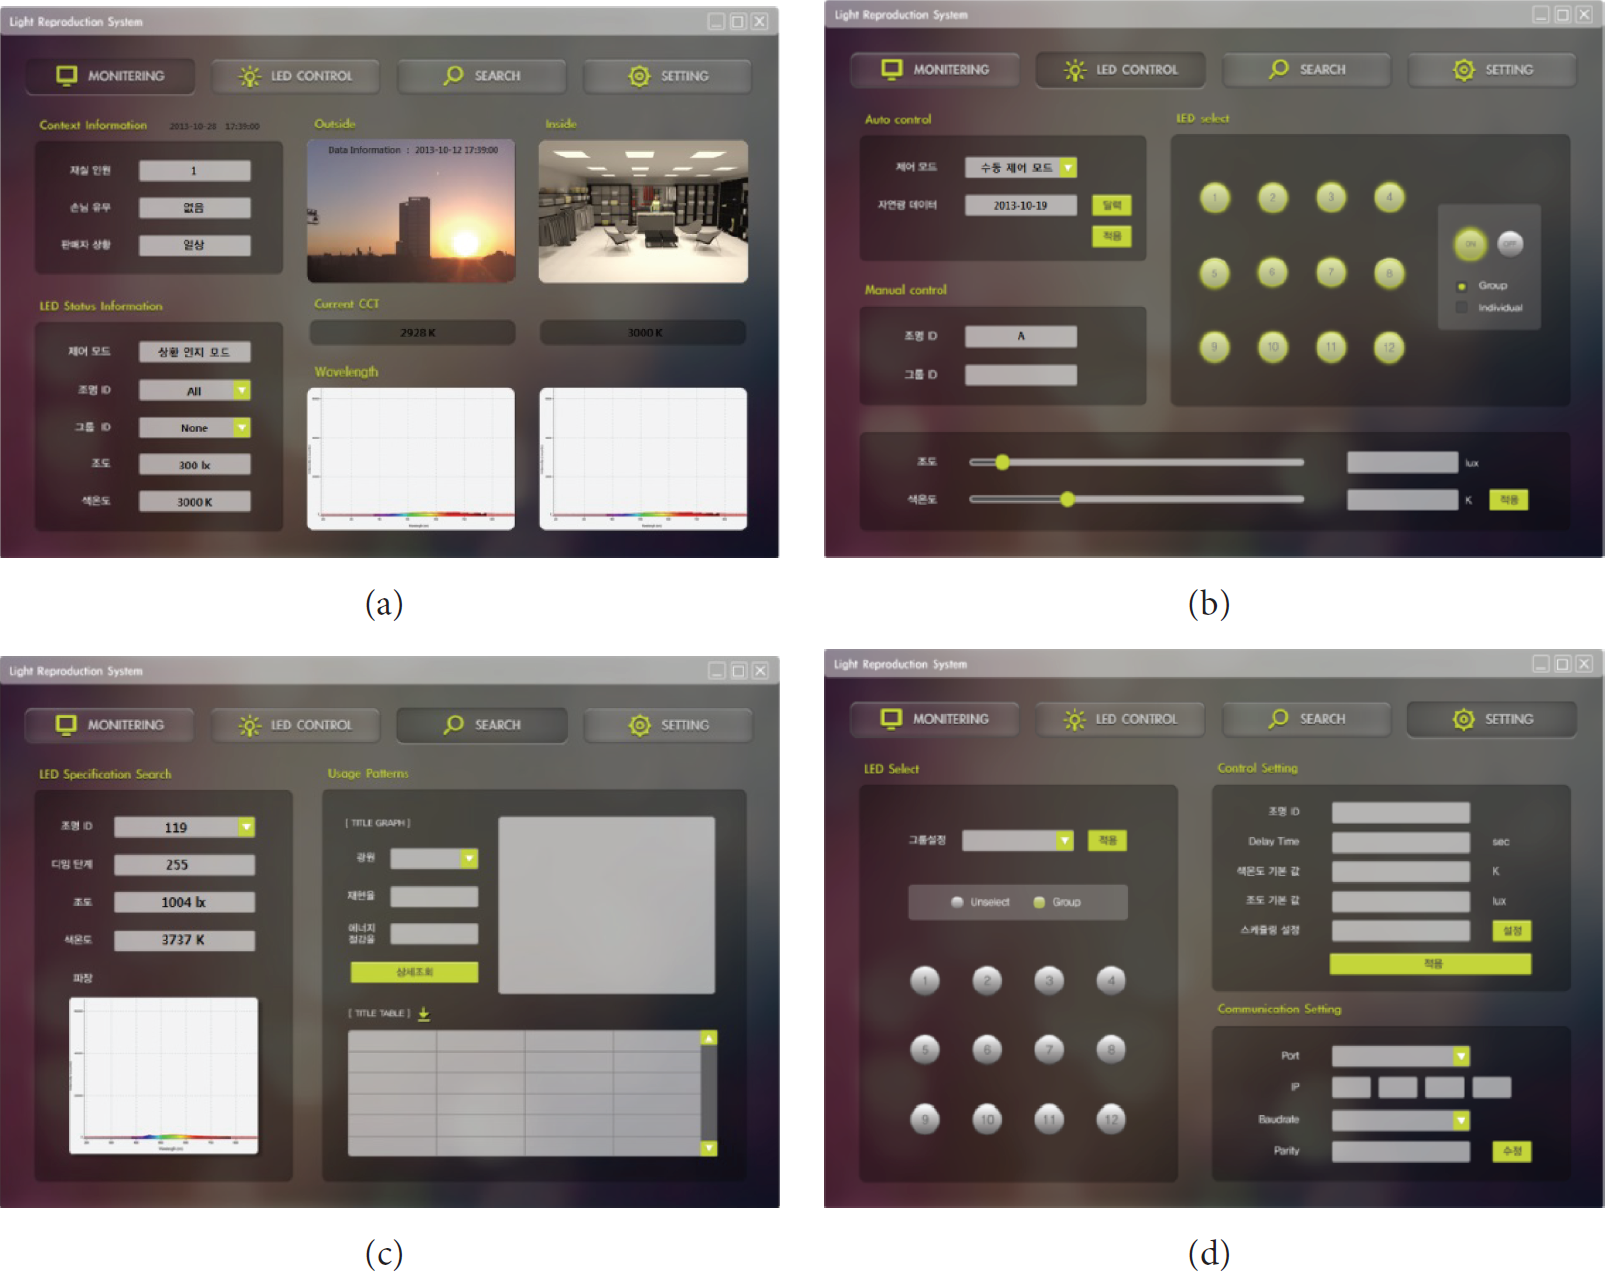
Graphic user interface.
Figure 16 shows the class structure of the natural light reproduction system based on the context awareness suggested in this study. Table 13 shows the details of each class. This system includes the main package for program implementation, UI Package for actual measurement monitoring, System_Connection Package for data transmission with LED lightings and sensors, Service Package for appropriate lighting environments, Context_Awareness Package to recognize an occupant's situation by means of sensors, control package to control LED lightings and sensors, DB Package for database management, and so forth.
Specifications of class functions.


Class diagram.
Table 14 illustrates a database used in the natural light reproduction system based on context awareness. This consists of 6 tables: Context_Info that contains lighting environments appropriate for each situation, Artificial_Light_Info that contains artificial light characteristics that change depending on the dimming stage, Natural_Light_Info that contains natural light characteristics that change over time, Light_Record that contains a user's history of lighting use, and settings of basic lighting environments and schedule-based input.
Table configuration.

4. Evaluation of System Performance
4.1. Lighting Environment Indexes and Scenarios
To evaluate the suggested system's performance, standard indexes for lighting environments were determined in reference to the situation information defined as “selling,” “working,” “dining,” and “daily routine.” These indexes are shown in Table 15. Among these, illuminance refers to KS A3011 and color temperature to the research findings of Kruithof curve and Oi [19–21].
Standard indexes of lighting environments according to the situations of a clothing shop.
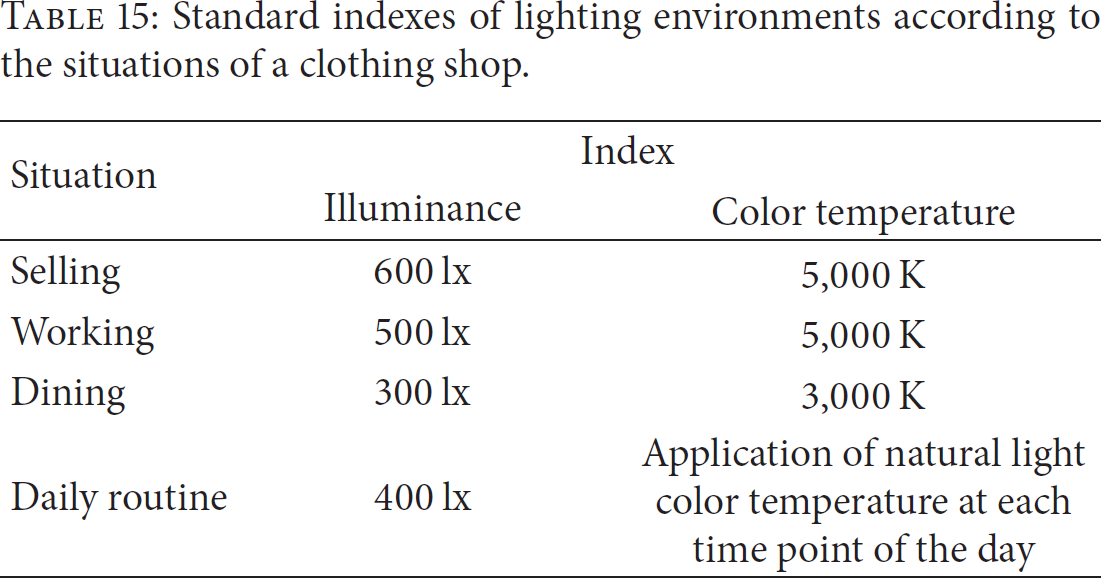
Table 16 shows the extracted data of the optical characteristics of artificial lightings in reference to the indexes of lighting environments in Table 19. Among the data sets of illuminance and color temperature that might change depending on the dimming stage of an artificial lighting, values close to the indexes of lighting environments were extracted and calculated for the color coordinates, power consumption, and controlling rate of a luminous source. It turned out that power consumption varied depending on the total dimming ratio or illuminance value. In the “selling” situation, the targeted value of illuminance and total dimming ratio were high, which increased the level of power consumption accordingly. In the “dining” situation, the targeted illuminance and dimming ratio were low, and thus the level of power consumption was low accordingly. In the situation of “daily routine,” the color temperature of natural light that might change over time was reflected so that the power consumption, controlling rate, and color coordinates could constantly change.
Lighting environments in each situation of a clothing shop.

Table 17 shows a light controlling scenario based on the working hours and behaviors of a seller at a clothing shop. The working hours of the seller were from 9 am to 8:20 pm. The behaviors included “working,” “selling,” “dining,” and “daily routine.” They were mixed during the day. In the situation of “daily routine,” the service was provided 30 minutes at a time during the four different time periods in reference to the color temperature of natural light in a clear day.
Seller-centered light controlling scenario.

4.2. Evaluation of System Performance
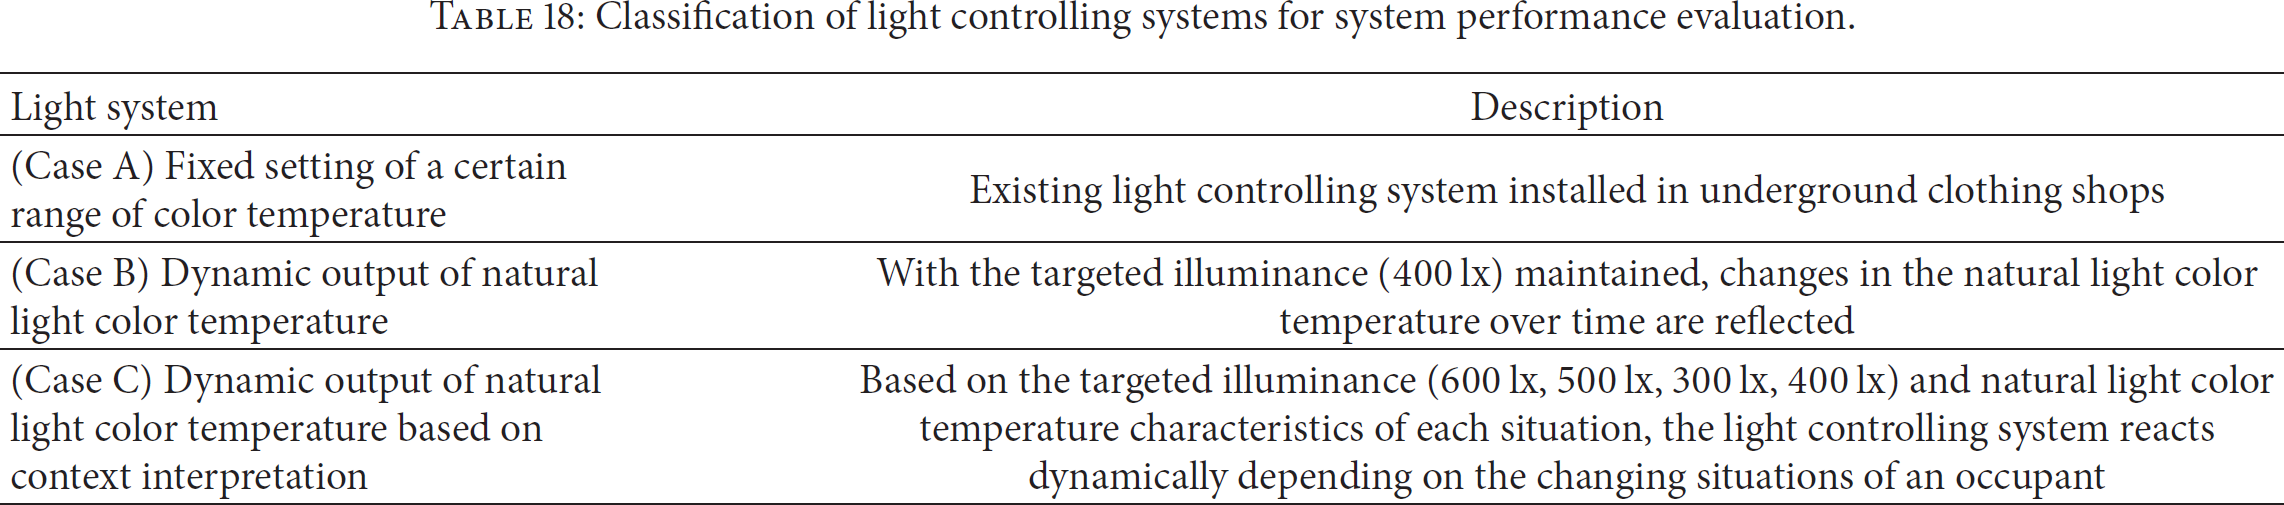
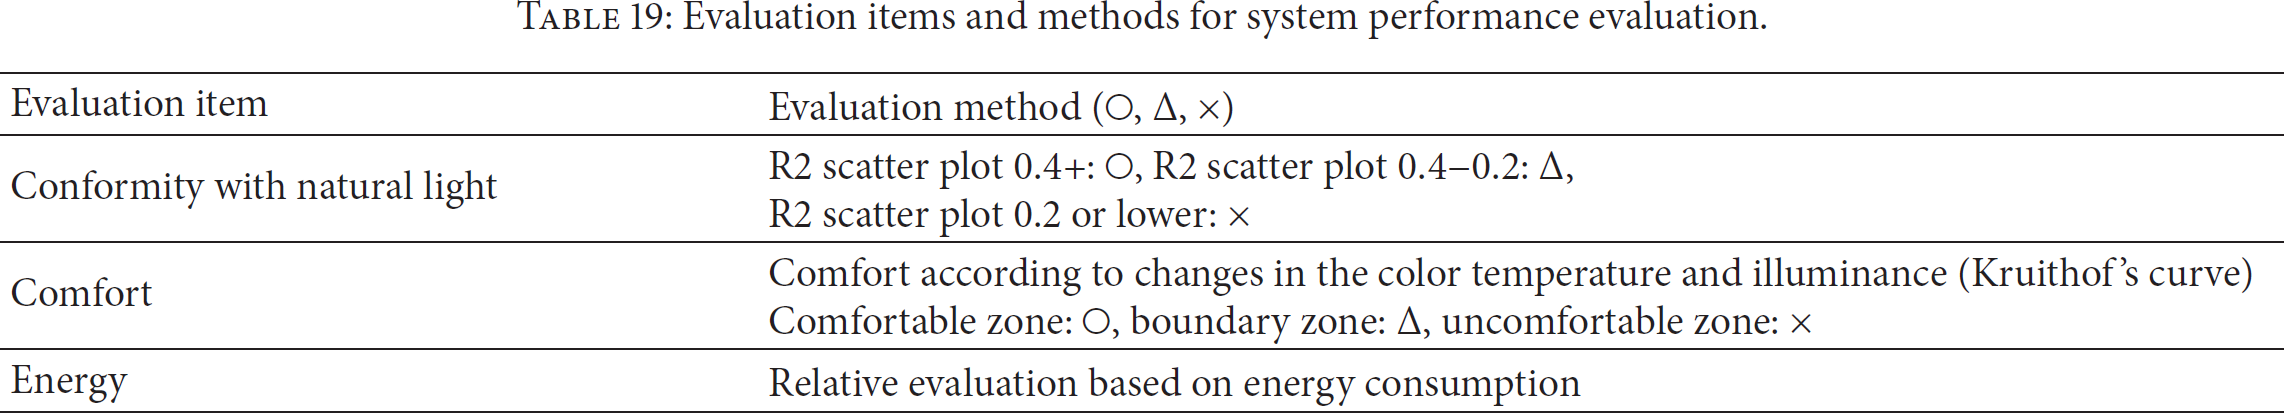
To evaluate the performance of the suggested system, this study classifies light controlling systems into three types as shown in Table 18. Case A is a lighting environment currently common among underground clothing shops. A certain range of color temperature is fixed for the lighting condition. Case B maintains the targeted range of illuminance in reflection of a spatial characteristic, controlling the condition according to the color temperature of natural light in each time point during the day. Case C is the method suggested in this study. It seems to be similar to Case B but actually different in that it automatically recognizes an occupant's situation and provides the illuminance and color temperature of natural light accordingly. For the light controlling system of each case, the three evaluation items and methods shown in Table 19 were comparatively analyzed. The fixed output of Case A was based on the actual measurements of the lighting environments at six different underground clothing shops near Gangnam Terminal (see Table 20), while Case B applies the color temperature values of natural light at different time points on a clear day, October 4, 2013. Case C applies the color temperature values of natural light and targeted illuminance according to an occupant's situation in a scenario.
Classification of light controlling systems for system performance evaluation.
Evaluation items and methods for system performance evaluation.
Actual condition of light environments of underground clothing shops near Gangnam Terminal.

Figure 17 shows the result of evaluating each light controlling system in terms of “conformity with natural light” from 9 am to 7 pm. The fixed output of Case A is applied to Case A-1 to Case A-6, reflecting the actual measurements of light environments at six underground clothing shops near Gangnam Terminal. As the fixed color temperature was investigated constantly, it turned out that it showed totally different patterns from those of natural light. In contrast, Case B that represented the color temperature in the daily cycle of natural light and Case C, which was a natural light reproduction system based on context awareness, showed similar patterns with the actual measurements of natural light color temperature, but in the situation of “dining” of Case C, the color temperature of natural light at noon was in inverse proportion to that of the light environment appropriate for the occupant.
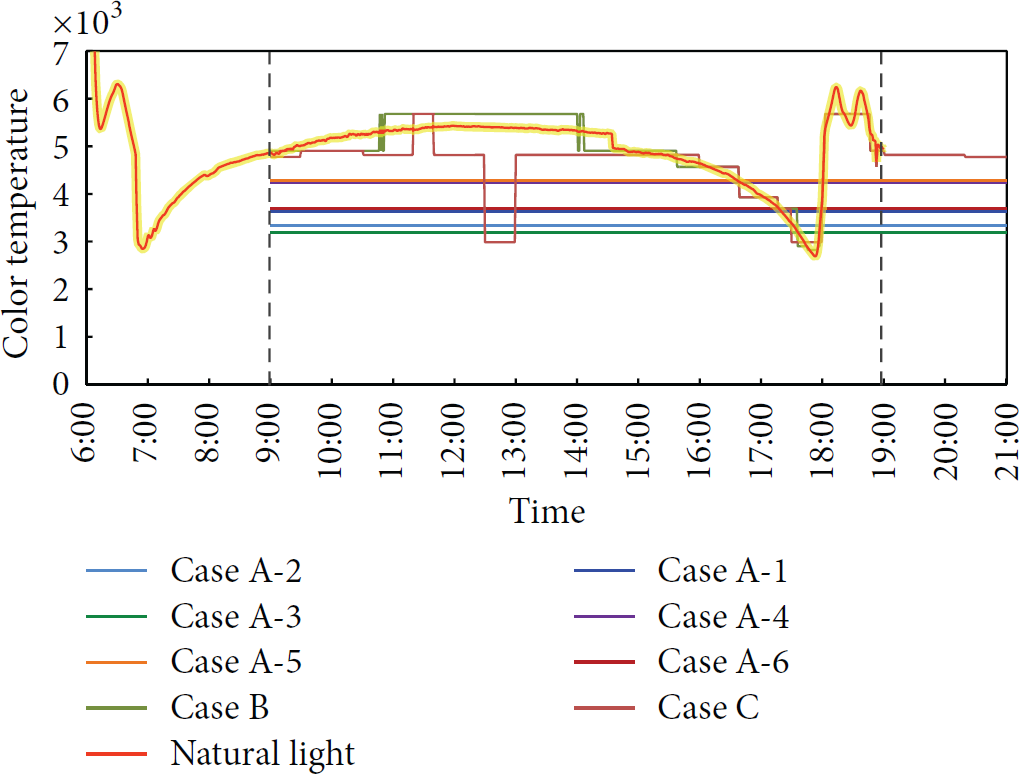
Conformity of color temperature of each case with that of “natural light.”
The conformity of color temperature of each case was compared with that of natural light by means of a scatter plot (see Figure 18). As a result, the fixed output of Case A showed a low relation between artificial lighting color temperature and natural light color temperature (Figures 18(a)–18(f)), while Case C, suggested in this study, showed a low level of correlation (correlation coefficient

Evaluation of “conformity” of each case with natural light in terms of color temperature.
Figure 19 shows the result of evaluating the lighting environments of the light controlling system of each case designed for an occupant's comfort by means of Kruithof's curve. All of the six underground clothing shops based on the survey of Case A maintained a high level of illuminance up to 400 lx, which is higher than the standard of KS illuminance. Some lighting environments involved color temperature as low as 3,000 K, which belonged to the level of “uncomfortable.” Case B is a system that reflected changes in color temperature in the daily cycle of natural light with the illuminance fixed to 400 lx. Except one lighting environment, all others remained in the area of “Comfortable.” Case C represented an appropriate range of color temperature of natural light in recognition of the surroundings of a user. All lighting environments provided according to the scenario remained in the area of “Comfortable,” and the performance was the best in terms of comfort.
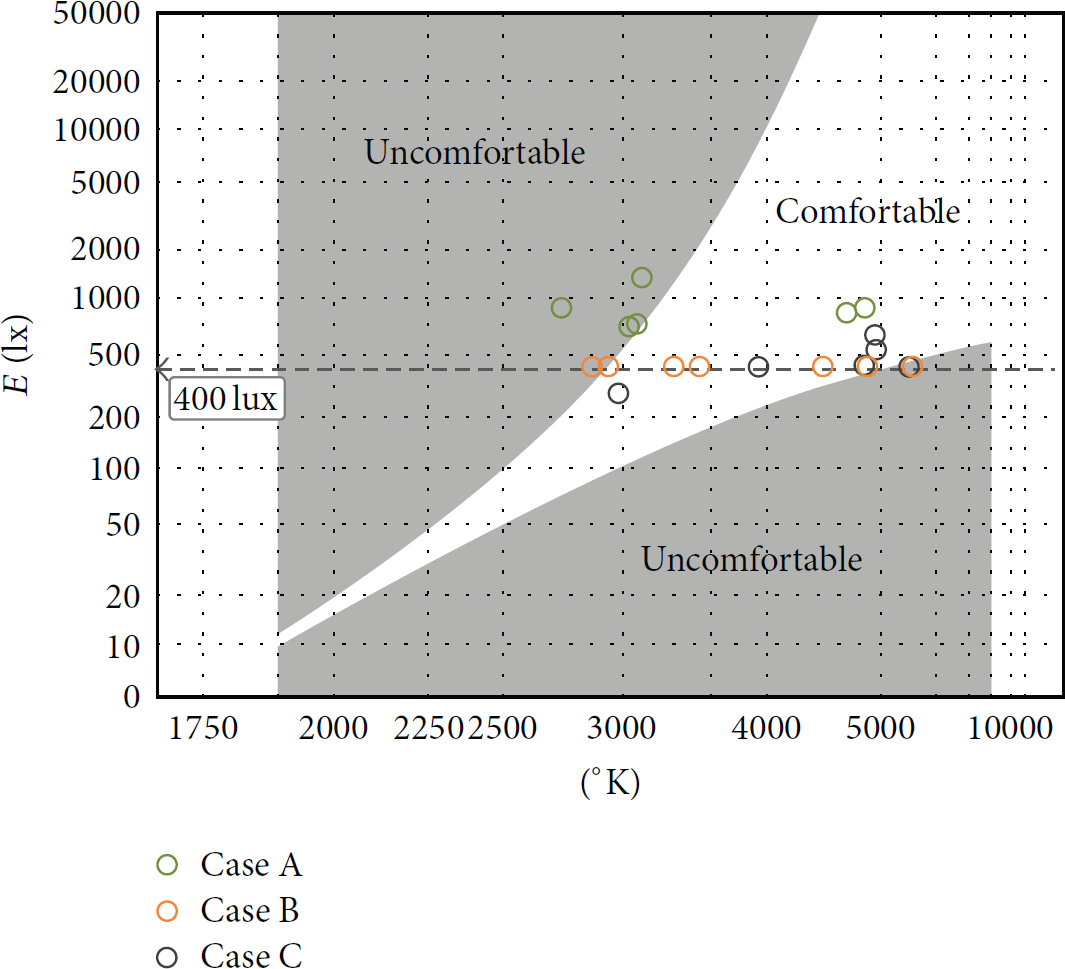
Evaluation of “comfort” of each case by means of Kruithof's curve.
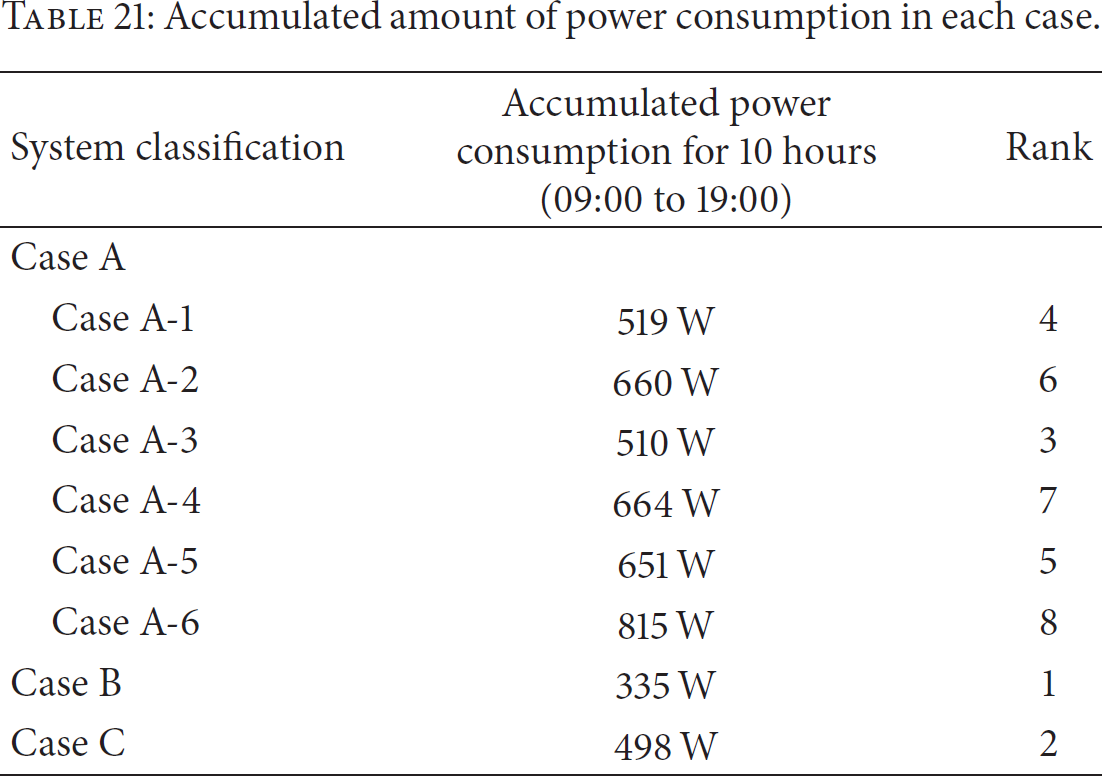
Figure 20 shows the power consumption of each light controlling system for 10 hours. Table 21 shows the accumulated amount of power consumption. It turned out that the power consumption of Case B was 335 W, which indicates the best efficiency, and then 498 W for Case C. Case A showed a higher level of power consumption than Case B and Case C because of the high illuminance condition up to 400 lx that does not meet the basic requirement according to the lighting environment index. Further, as the scenario of Case C changed according to an occupant's behaviors at different times of the day, the lighting environment index and the level of power consumption would change accordingly.
Accumulated amount of power consumption in each case.

Evaluation of “power consumption” of each case for 10 hours.
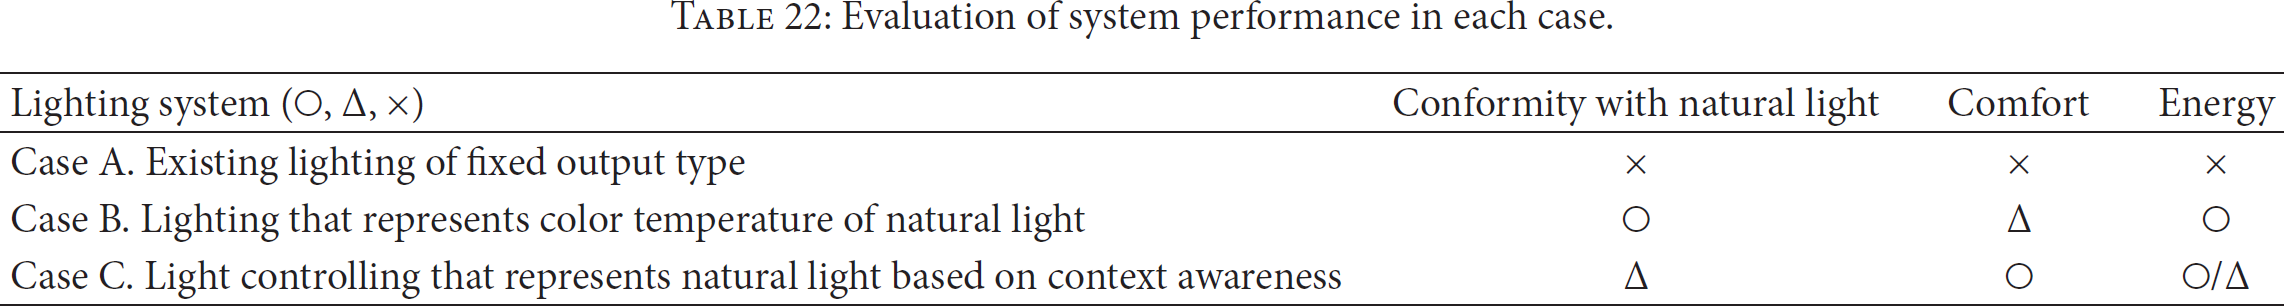
Table 22 shows the result of comprehensively evaluating the light controlling performance of Cases A, B, and C in terms of “conformity with natural light,” “comfort,” “convenience,” and “energy.” As to Case A of fixed output type, which is common among most shops, the scores of the three items were all low. As to Case B, the level of “conformity with natural light” and that of “energy efficiency” were excellent, but that of comfort was normal. Lastly, the suggested system of Case C, the conformity with natural light color temperature, was normal but the feature of an occupant's context awareness makes it possible to create a more comfortable and convenient lighting environment. In addition, the energy efficiency was superior.
Evaluation of system performance in each case.
5. Conclusion
This study aims to design and implement a natural light reproduction system based on context awareness to enhance the psychological and physiological conditions of an inhabitant residing in a windowless space such as an underground space with no natural light for a long period of time. By dynamically controlling lighting environments depending on an occupant's situation and in reflection of the daily cycle of natural light, this system provides a user with a healthy and comfortable condition. To this end, this study includes actually measuring and analyzing optical characteristics of natural light and artificial lighting, designing and implementing a natural light reproduction system based on context awareness, and evaluating the performance of the suggested system with various evaluation items.
First, the daily cycle of natural light that might constantly change over time and, depending on the climate conditions and optical characteristics of artificial lighting that might change depending on the dimming stages, was measured, analyzed, and saved in a database. Second, the four situations “Working,” “Dining,” “Daily Routine,” and “Selling” were defined, with each situation being recognized by sensors. The natural light reproduction system based on context awareness was designed accordingly to provide appropriate lighting environments. Lastly, to evaluate the suggested system's performance, the lighting control systems were classified into three major types: Case A, the existing system of fixed output; Case B, a system that represents the daily cycle of natural light; and Case C, a system that provides natural light characteristics appropriate for an occupant's situations. The performance of each system was then comparatively analyzed in terms of “conformity with natural light,” “comfort,” and “energy.” As a result, it turned out that the suggested system, Case C, showed a normal level of conformity with natural light and a superior level of comfort and energy efficiency. In other words, all of the lighting environments simulated according to the scenario showed a level of illuminance and a color temperature corresponding to the “Comfortable” area in Kruithof's curve. This system maximized a user's convenience by interpreting the situations based on the information collected by sensors without any need for a user's intervention.
As this system is applied to actual environments of underground space in the future, it is expected that rhythms of a daily cycle of natural light can be represented and thus maintain or enhance the health of the occupants, and that comfort and convenience are also secured by reorganizing the lighting environments dynamically according to the changing situations. Further, since it uses less electric power than existing lighting control systems of fixed output type, this system is of great value in terms of economic efficiency.
Footnotes
Conflict of Interests
The authors declare that there is no conflict of interests regarding the publication of this paper.
Acknowledgments
This research was supported by Basic Science Research Program through the National Research Foundation of Korea (NRF) funded by the Ministry of Education (2009-0093825). This work was supported by the research grant of the Kongju National University in 2013.