
Abstract
Biological and pharmaceutical (B&P) products are essential in modern life. Currently, the demand and requirements of these products are dramatically growing; product quality and integrity then become crucial. As a key factor for ensuring quality and integrity, the current product status monitoring system needs to be enhanced in a more sophisticated and comprehensive way. This research describes the design of a wireless sensor network (WSN) monitoring system for B&P products supply chain management. In this study, the system architecture is presented based on the proposed framework. The framework consists of three processes: the first one is to generate a WSN with full coverage, the second one is to determine the optimal position of the sink, and the last process is to add additional relay nodes for providing fault tolerance to the network. Finally, a feasibility test on B&P product storage in a hospital is conducted. The proposed system provides a systematic approach for the deployment of sensor nodes and relay nodes. It also provides a relatively simple and rapid method for industries in general to follow and implement when designing a WSN system.
1. Introduction
Biological products refer to natural substances obtained from living organisms [1], which include blood, blood products, tissue, tissue products, organs, vaccines, microbial samples, and cellular specimens. Pharmaceutical products are drugs or medicines in traditional and modern medicine [2]. Both biological and pharmaceutical (B&P) products are critical and essential in many different areas, such as in medicine, health care, pharmacies, and biotechnology. However, B&P products are highly susceptible to variation of environmental factors, such as temperature, humidity, vibration, tilt, light, and atmospheric pollution. Traditional handling processes of these products in the supply chain are straightforward but have certain drawbacks, in which there is no real-time and continuous monitoring. Thus, unrecorded mishandling will eventually cause microbial or chemical contamination, an increase in the products' decomposition rate, and leakage if no timely rescue action is taken [3]. Low quality products will jeopardize the health and even the life of end users and also lead to other serious consequences, such as monetary loss and reputation damage. Therefore, there is a need for a real-time and comprehensive monitoring system to keep tracking of the state of the pedigree of B&P products in the supply chain. To fulfill the emerging need, this research proposes a wireless sensor network (WSN) based monitoring system to prevent faults and to enhance the supply chain visibility.
A WSN refers to a collection of sensor nodes with the capability of wireless communication [4]. These sensor nodes are generally small in size and cheap, have limited computational power and memory, and are equipped with a limited power source, whose battery is the most common form. In typical usage, sensor nodes are distributed into a target region and form a wireless network. Each sensor node collects the physical or environmental information of the surroundings, such as temperature, humidity, light intensity, and vibration. Information is then sent to a base station (BS), also called a sink, which is a central information aggregation node. Through the sink, a backend system will store the information gathered and perform further analysis and processing. In case the monitoring area is large, hundreds, thousands, or even more sensor nodes can be deployed on the site.
In recent time, WSNs have attracted significant attention among researchers and practitioners and have been shown to have a high potential to be a highlighted technology in the next five to ten years [5]. Many WSN based monitoring systems for different applications have successively emerged. As with many new technologies, the adaptation threshold of WSN is relatively high. Considering the design of a WSN for a specific application, many design factors such as cost, energy efficient, coverage, network connectivity, quality of service (QoS), and fault tolerance should be taken into account. Furthermore, there are trade-offs existing between these design factors, so a better balance of the trade-offs has become one of the critical concerns. The design of a WSN is also specific to the application and environmental conditions [6]. Changes may adversely affect the cost and performance of the WSN, and this implies that redesign of the WSN is required. In particular cases, the warehouse of B&P products may vary from site by site. Therefore, a relatively simpler and more systematic WSN construction approach for B&P product monitoring systems will be helpful to both system operators and management. To address this issue, this research proposes a three-stage WSN construction process while considering three crucial design factors, coverage, network connectivity, and fault tolerance. In the first stage, the deployment of the wireless sensor nodes and the relay nodes is determined. Based on the result obtained, the deployment of sinks can be also determined in the following stage. In the last stage, the fault tolerance of the constructed WSN is achieved through the deployment of additional relay nodes, and the required number of the additional relay nodes is obtained using a statistical method.
The rest of the paper is organized as follows. The next section reviews the similar works in the literature. Section 3 presents a conceptual system architecture of the proposed system and a conceptual framework of the WSN management module is described. It focuses on discussion of the proposed common approach to balance the battery life of each relay node in a WSN. Section 4 is about operating the system using a feasibility test, which is studied to present the work procedure and the archived solution of the proposed system. Section 5 describes experimental analysis in comparing the proposed node deployment strategy with two general types of sensor node deployment strategies. Finally, conclusions are given in Section 6.
2. Related Works
The applications of WSN based monitoring systems can be classified into two categories: indoor and outdoor applications. Outdoor applications generally involve deploying a large number of sensor nodes in a large space; examples include precision agriculture monitoring [7], coal mine monitoring [8], and environmental monitoring [9]. The deployment of these applications is challenging due to the harsh outdoor environment. Thus, sensor nodes deployment, communication protocol design, and experiments for outdoor applications are difficult, costly, and time-consuming [10]. For indoor applications, such as data centre monitoring [11], patient monitoring [12], and industrial storage monitoring [13], many deployment strategies only consider the coverage and the network connectivity. However, these strategies may not satisfy certain applications requiring fault tolerance for long-term and reliable service. To address this issue, researchers have proposed solutions for some applications. A backup sensor placement algorithm for structure health monitoring (SHM) application was proposed in [14]. Backup sensors are placed beside potential failure sensor nodes, which are obtained by performing network analysis after the WSN is formed. Some other research works proposed k-connectivity approaches to optimize the number of additional sensor nodes, in which a k-connected WSN is able to tolerate
The contributions of interest for researchers in this paper can be summarized as follows. This paper describes generic system architecture for designing a WSN based monitoring system. It not only can be used for B&P products, but also is a reference for other applications. Considering the WSN deployment strategy, a relatively simple and systematic three-stage nodes deployment scheme is developed. In comparison with two general sensor node deployment strategies, the WSN constructed by using the proposed deployment scheme has longer network life than the other two.
3. Wireless Sensor Network (WSN) Monitoring System
The conceptual architecture of the proposed system is shown in Figure 1 and consists of four layers, namely, the information acquisition layer (IAL), network layer (NL), logic and processing layer (LPL), and service output layer (SOL). In the IAL, the product state information and the environmental parameters (i.e., temperature, humidity, and vibration) are collected by the wireless sensor nodes, which are widely spread in the target area, such as a container, warehouse, or distribution centre. The collected data is then routed to the sink through the wireless sensor network (WSN). The sink is located at the network layer to perform data gathering and exchange as well as delivering the control commands from the wireless sensor network management module (WSNMM) to the sensor nodes. WSNMM is one of the core modules used to configure and manage the wireless sensor nodes and optimize their performance. After that, the data is then passed to the data integration and analysis core (DIAC) in the LPL through the Internet via the general packet radio service (GPRS), 3G, Wi-Fi, or other wireless technologies. In the DIAC, the data from the NL can be integrated with the RFID data from the RFID readers deployed at the gateway of the storage region, and further analysis and processing can be performed for decision making. Before setting up the WSN, the user configuration, such as data reporting rate and technical specifications of the B&P products, can be injected into the LPL for configuring and fine-tuning the performance of the DIAC.

The conceptual system framework of the proposed system.
As the WSN is deployed, SOL will deliver service outputs based on the decisions made in the LPL, including visualizing the data, prompting alerts when abnormal conditions occur, triggering the operation of actuators, and storing the collected and processed data in the database for querying and further analysis in the future.
In this paper, the proposed monitoring system framework focuses on dealing with heterogeneous WSN, of which the WSN consists of both sensor and relay nodes. The sensor nodes are supposed to switch between sleep and wakeup mode to conserve energy and the relay nodes are set to be always active for routing the message from sensor nodes to the sink. For the deployment of both sensor and relay nodes, a three-stage process for WSN management is proposed. In the first stage, a WSN model is formulated by considering the sensing coverage and network connectivity. The sensor nodes are defined as a set


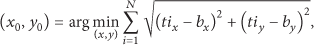
As the relationships between the nodes in the WSN are built up, the next step is to calculate the required number of sensor nodes. The objective of the first stage is to obtain the minimum number of sensor nodes so that the total sensing range covers all the space points in the monitoring area.
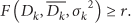
In the next stage, the position of the sink is considered. The sink is suggested to be located in an optimal place where the total power consumption of all the relay nodes for data transmission is a minimum [17]. In other words, it means that the total distance between each relay node and the sink should be minimized, because the rate of power consumption is proportional to the distance between the transmitter and a receiver. This can be represented as
After going through the first two stages, a ready-to-operate WSN is constructed. However, the WSN is still weak in tolerating node failure, especially relay node failure. As mentioned before, the relay nodes continue in an active state for routing data, the failure rate due to energy exhaustion, and hardware/firmware malfunction being significantly higher. Since the relay nodes form the communication backbone of a WSN, failure of any of them may cause data loss or network collapse. Therefore, in the last stage, additional relay nodes are inserted into the WSN to prevent relay node failure. The additional relay nodes are deployed around the existing relay nodes and stay in a sleep mode at the beginning. They will then wake up periodically and communicate with the existing relay nodes following the Ping-Ack protocol. Once a relay node fails, an additional node nearby will not receive an acknowledgement when it wakes up and polls the relay node. Then, the additional node will wait for a random time from one to five seconds and retry to poll the relay node. If the additional node cannot receive acknowledgement after five retries, the additional node will substitute the functionality of the original relay node.
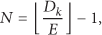
The number of the additional relay nodes is calculated following a series of procedures. Firstly, the monitoring area is divided into n regions based on the coverage areas of the relay nodes. Then, the number of days of different area usage rate is counted in a period when the batteries are expected to be recharged or replaced. The area usage rate refers to how many regions are used for inventory storage. For example, the days in period 1 in which the area usage rate stays above 0,


4. A Feasibility Study of the Proposed System
In this section, a case study is conducted to show the feasibility and describes the operation procedures of the proposed system.
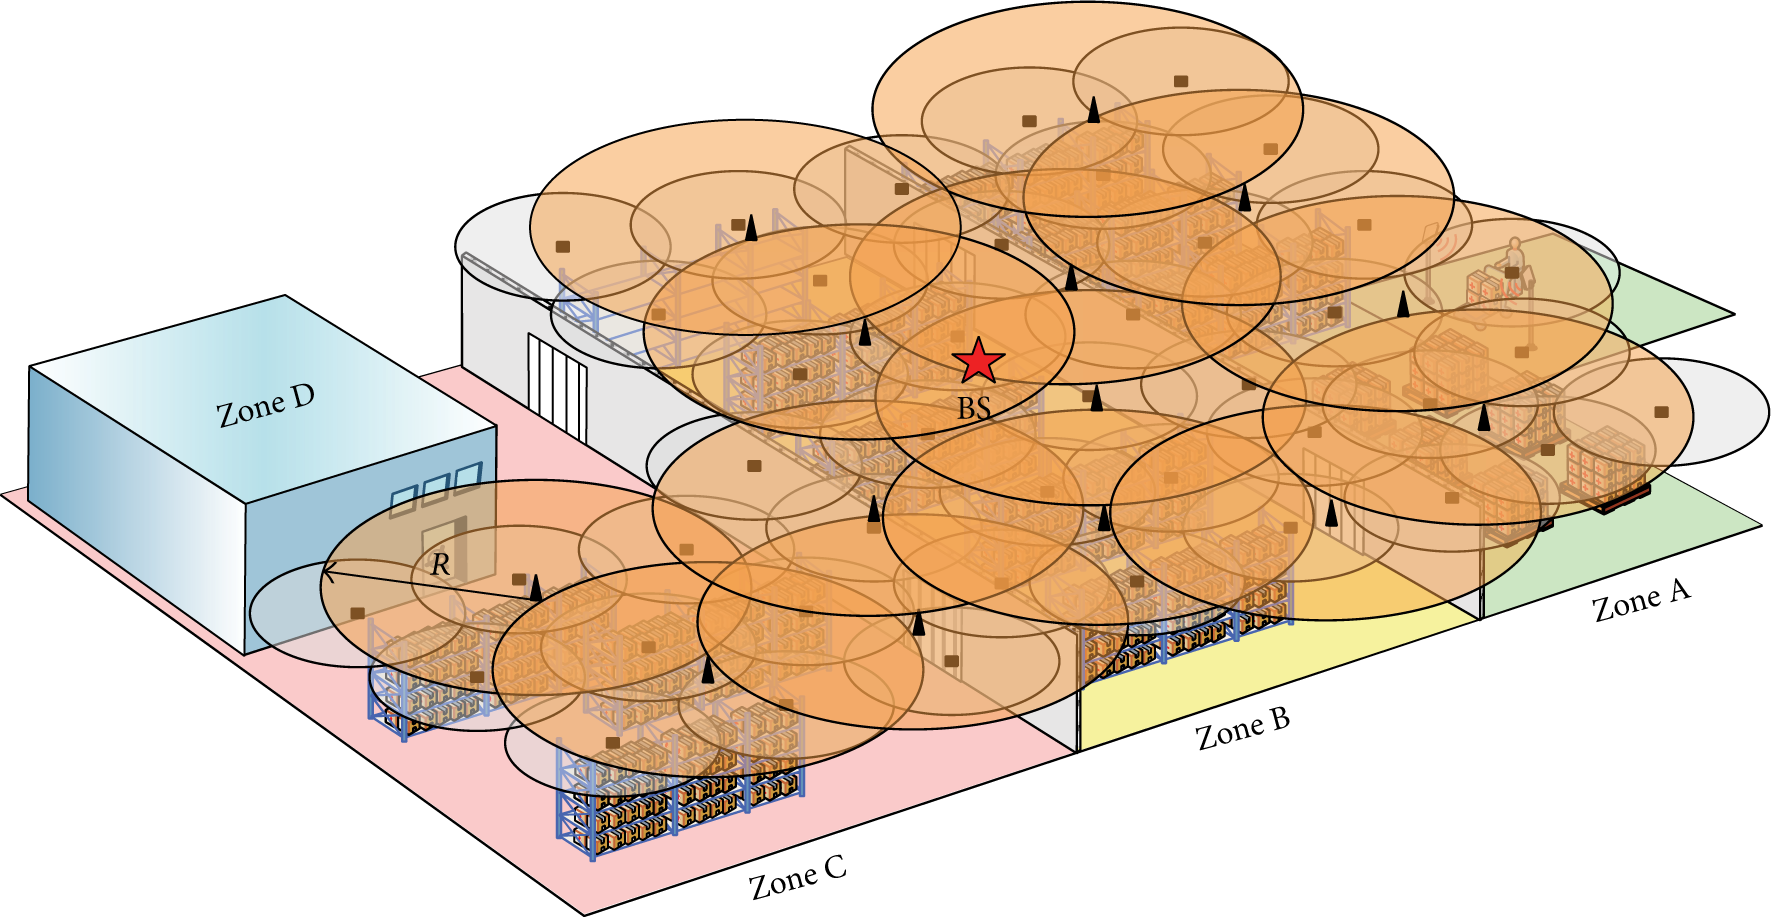
There is a storage room for B&P products in the studied hospital as shown in Figure 2, in which there are four zones. Zone D is a refrigerated area, which is for products with different storage temperature needs, where there are existing own monitoring devices. Therefore, we only discuss the devices designed and installed for Zone A, Zone B, and Zone C.

The storage zones for B&P products.
The wireless sensor nodes and relay nodes are deployed in the storage room to monitor the environmental condition surrounding the B&P products. According to the previous section, the procedure is divided into three steps. In the first step, the sensor nodes are deployed to cover all the area in the storage room by applying formula (1). The sensor node deployment strategy is based on a greedy algorithm. Pseudocode 1(a) shows the pseudocode of the sensor node deployment. In the initialization stage, P is defined as a set of small grid points representing the space points in the monitoring area.
(a) (1) (2) Set P as a set of grid points which P = (3) Set (4) Set S as a set of sensor nodes which (5) (6) (7) randomly place a sensor node (8) (9) (10) (11) (b) (1) (2) Set (3) Set T as a set of relay nodes which (4) (5) (6) place a relay node (7) (8) (9) (10)
The in-house developed sensor node used in the case study is shown in Figure 3. It consists of a digital humidity and temperature sensor, an ultrasonic sensor, and a ZigBee communication module.
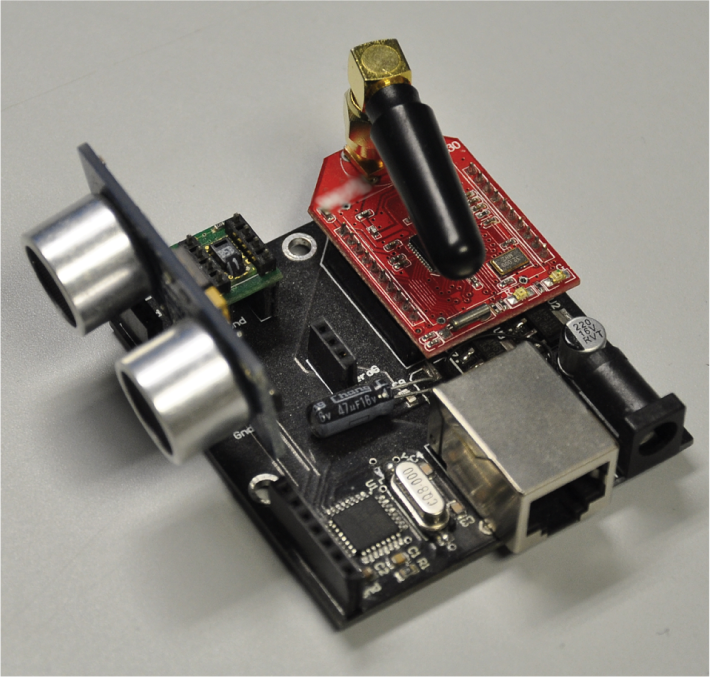
The sensor node used in the case study.
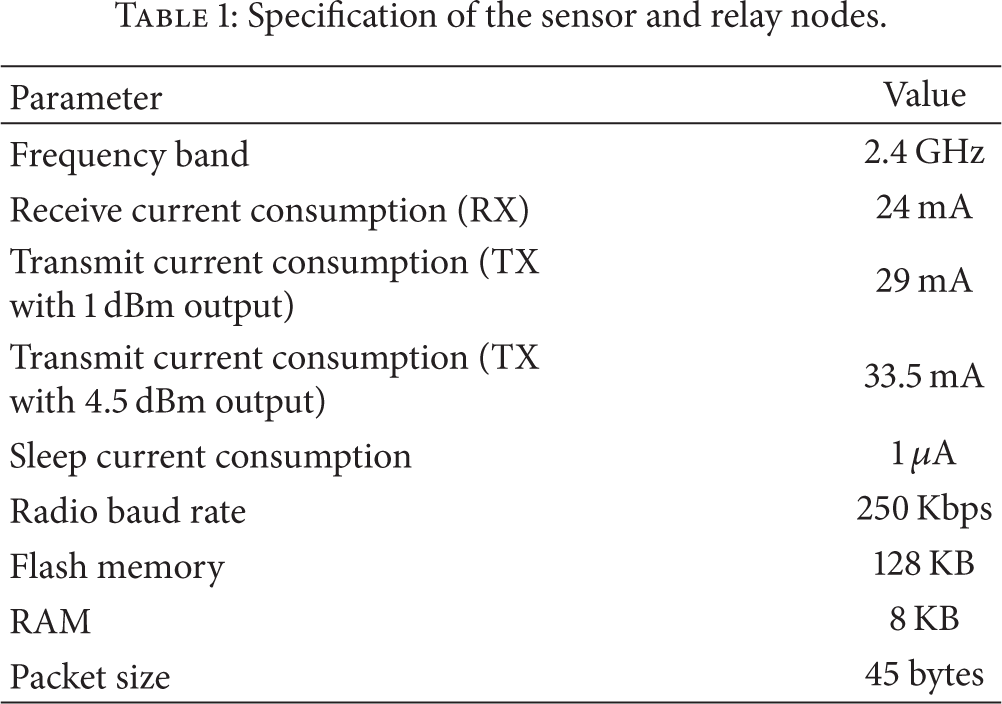
The relay node was developed using the same hardware architecture as the sensor nodes, but the wireless communication module is set as a ZigBee router instead of a ZigBee end device, and a higher grade of microcontroller is used. Table 1 shows the specification of the sensor and relay nodes. The sensor node deployment results are shown in Figure 4. After calculation, it was found that 42 nodes were needed.
Specification of the sensor and relay nodes.

Deployment of sensor nodes.
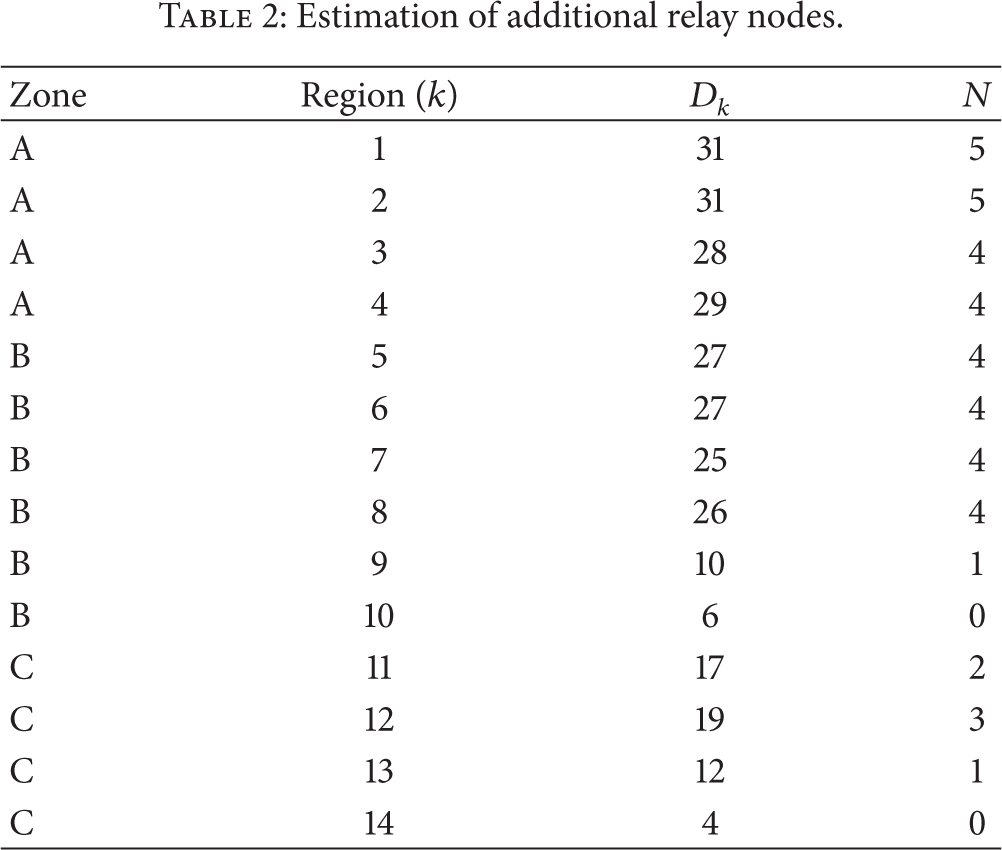
In the second step, formulas (1)–(3) are again applied to calculate the number of relay nodes to cover all the sensor nodes in the deployment area for receiving all the information. The pseudocode of the relay node deployment algorithm is shown in Pseudocode 1(b). It is also based on a greedy algorithm, which is similar to the sensor node deployment strategy. The optimal location of the sink is then determined by using formula (4). Figure 5 shows the location of the sink, and 14 relay nodes are needed. At this point, the initial instalment of the node deployment is finished. In the third step, an investigation is made to find whether the storage room is always full. If the answer is no, the instalment is finished. Otherwise, some additional relay nodes should be added. As 14 replay nodes are deployed, the room can be divided into 14 regions. Thus, the days that the inventory level stays above 0%, 7.1%, 14.2%, …92.3% are counted. In this case study, the historical inventory information is used for the statistics, and a normal distribution is obtained from the distribution fitting software, Stat::fit. Concerning the goodness of fit, the Kolmogorov Smirnov (KS) test was used and the result showed an acceptance of “Do not reject” with a significance value of 0.05. Batteries were replaced regularly each month (30/31 days). The average active working days for the battery of a relay node were 6 days. The reliability was set as 99.5%. After calculation by formulas (5)–(9), the additional relay nodes in each region were determined. Table 2 shows the results.
Estimation of additional relay nodes.
Deployment of relay nodes and the sink.
As the result shows, Zone A has the highest priority for deploying more additional nodes, and 4 to 5 additional nodes for each relay node are needed. Zone B has less priority and Zone C has the lowest priority. At first, all the additional relay nodes were set in sleep mode. If the warehouse was not full, the idle relay node in the region was also set in sleep mode.
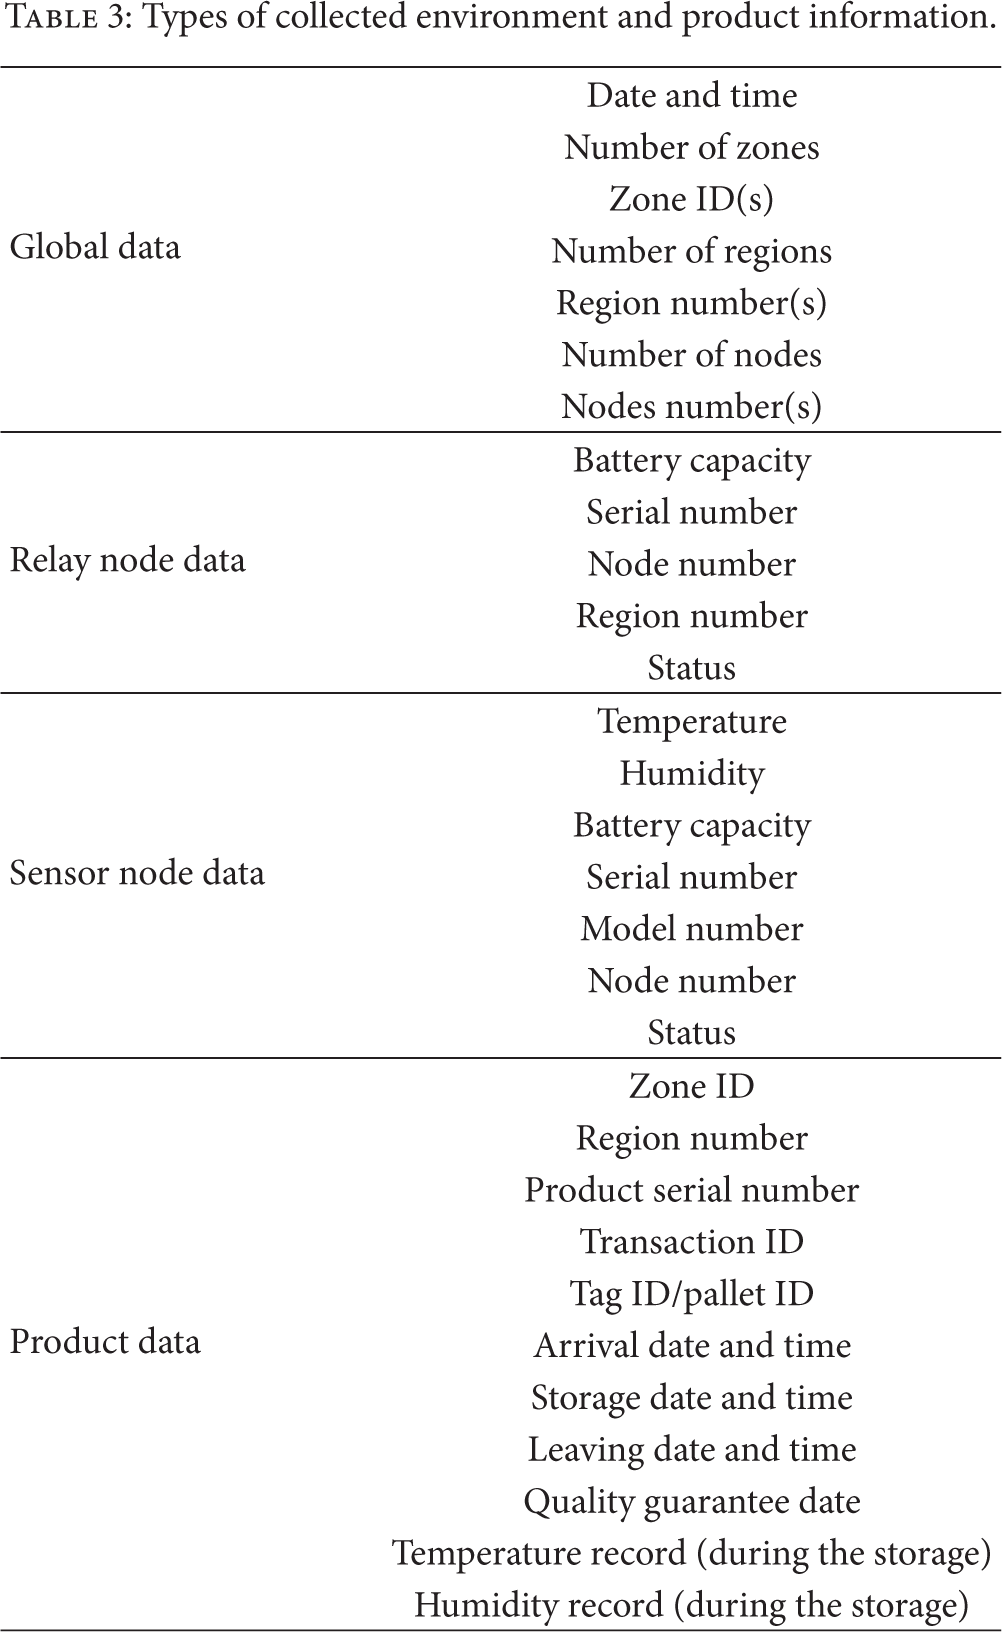
After the deployment of WSN, the system works to collect data. Figure 6 illustrates a main interface of the web-based system. In this case, the main function of the system is to monitor the stock in and out and, more importantly, the environmental factors (i.e., temperature and humidity) in the storage room. When there are products stored in a particular region, the corresponding relay node is set in active status. It activates sensor nodes in the region to monitor temperature and humidity. Once an abnormal temperature appeared, the system will send an alert to the users. Thus, the hospital can take immediate action to cope with any accidental events. RFID tags are recommended to be installed on the B&P products or pallets of the B&P products. The functions of the system can be therefore extended with the application of RFID. The arrival and leaving time can also be recorded automatically, making it useful for the management of B&P products. Table 3 shows the types of the information collected by the system.
Types of collected environment and product information.

The web-based interface of the proposed system used in the case study.
5. Experimental Analysis
For comparison, two types of general sensor node deployment strategies were used in this case study with the objective of achieving full coverage (i.e., the coverage metric
To perform the comparison more comprehensively, a new performance metric called network health is introduced, and an experiment is conducted to test the network health of the three approaches. The network health is measured as a percentage, in which 100% network health means that the data from all the sensor nodes can be received by the backend system under the assumption that the Internet can always be connected. If there are S nodes in total in a WSN, the connection loss of one node results in a
For conducting the experiment, each sensor node in the WSN sends a measurement data periodically every 5 seconds to the backend server through the sink when the products are stored in its sensing coverage zone. If there is no product detected, a node will send a message of no product present to the backend system and switch to sleep mode and will wake up every 10 seconds to check whether there are products in its sensing zone. The backend system will count the data from each node. If the data of a node is not received continuously over 1 minute (60 seconds), the node is treated as a dead node and the overall network health will decrease in proportion accordingly.
Table 4 shows the preliminary comparison results of these two general node deployment strategies (approaches A and B) and the proposed approach (approach C). In approach A, 58 sensor nodes were deployed in the targeted monitoring zone with 100% coverage rate and the LEACH clustering algorithm was used for the energy efficiency measure. Similarly, in approach B, 129 sensor nodes were deployed with 100% coverage rate and the LEACH clustering algorithm was used. In approach C, 42 sensor nodes were deployed with 100% coverage rate. Since the two-tiered clustering method was applied, 14 relay nodes were deployed for routing the data from the sensor nodes to the backend system, and also 41 additional relay nodes for fault tolerance. For the cost in terms of the number of sensor nodes, approach A is 58, approach B is 129, and approach C is 108, where the cost of a relay node used in approach C is equal to 1.2 times that of a sensor node. Figure 7 illustrates the experiment results in these three approaches. As the results show, the network health remained 100% at the beginning. Around the 14th day, the network using approach A started losing nodes. This node loss occurred in the network using approach B around the 16th day, which was later than approach A. For approach C, the network health drop occurred around the 18th day.
The deployment results of the three deployment approaches.


The experiment results of the three deployment approaches.
As the results show, the three approaches can achieve 100% coverage rate. Approach A has poorer performance in terms of network health than the other two approaches, although its cost is the lowest. For approach B, the occurrence of node loss is later than approach A. It may be because of more nodes sharing the routing load in approach B, but its cost is the highest. Approach C contains fewer nodes than approach B, but it had better performance in the experiment. The reason is that the relay nodes take over the routing works and they are fault-tolerated by the additional relay nodes. Another reason may be because there is no guaranteed number of redundant nodes to share the routing load in some critical regions (e.g., the region connecting two large portions of the network) in the WSN. When the energy of the nodes in these critical regions runs out, a large number of sensor nodes will become dead nodes and the network health may drop significantly.
6. Conclusions
Adopting WSN technology requires consideration of a series of design factors, including energy efficiency, sensor nodes placement, sensing coverage, and network connectivity. To manage these factors effectively, a three-stage framework is proposed. In the first stage, a minimum number of sensor nodes and relay nodes are placed, fully covering the monitoring area. Next, the sink is put in an optimal place where the total transmission power of all the relay nodes can be minimized. Lastly, the number of additional relay nodes is calculated, in order to provide fault tolerance to the relay nodes in a WSN. The proposed approach uses statistics to calculate the number of the additional relay nodes needed in a target area. Furthermore, a feasibility test is conducted to show the work procedure and functions of the system. In the case study, the proposed system shows its superiority over the common control and random sensor node deployment strategies, through which the WSN using the proposed approach can provide longer monitoring services. To conclude, the proposed system provides a systematic manner for the deployment of sensor nodes and relay nodes, which also provides a relatively simple and rapid method for industries, in general, to follow and implement when designing a WSN system. However, the proposed deployment algorithm is mainly based on a greedy algorithm. An optimal result in terms of the number of deployed nodes may not be guaranteed, which implies the total implementation cost of a WSN system using the proposed approach may not be well justified. Therefore, our future work will focus on designing and developing a rapid approach to optimize both the aforementioned basic design factors and the number of deployed nodes simultaneously.
Footnotes
Conflict of Interests
The authors declare no conflict of interests.
Acknowledgments
The authors thank the editors and reviewers for their valuable comments and suggestions that have improved the paper's quality. The authors would also like to thank the Research Committee and the Department of Industrial and Systems Engineering (ISE) and The Hong Kong Polytechnic University (PolyU) for their financial assistance to the involved research student (RT3C). This work is supported in part by the Department of ISE, PolyU (G-UB97), and School of Advanced Computing, Sun Yat-sen University (SYSU), under Grant no. 2015-28000-71010004. The authors' gratitude is also extended to the collaborative project partner (H-ZJE5), the School of Information Science & Technology of SYSU, and College of Information Science and Engineering of Northeastern University for their support on this project.