
Abstract
In order to improve the accuracy and reliability for detection of grains cleaning loss, a piezoelectric crystal sensor array was proposed in full width of distribution to realize the online multipoints detection. The dynamic model for grain collision sensor array was evaluated by the method of experimental model analysis. The distribution of low-level vibration and deformation was tested for the sensitive elements of detection array using dynamic signal tester. The location and quantity of the piezoelectric crystal units were determined. The simulation was done based on the software ANSYS for the impacts of grains on the sensitive elements. A quantitative analysis was developed to correct the positions of the piezoelectric crystal units and the construction was adjusted according to the deformation contours. The exact positions were quantitatively analyzed and corrected based on the numerical results for the deformation placement, which was used for optimizing the array construction. Then, the grain impact experiment was established on the test bench. The results showed that the performance was stable for the piezoelectric sensor array, and output signal amplitude was about 2.5 V, with uniform sensitivity in the whole range. The present array sensor helps to provide a technical foundation for detection of grain cleaning loss.
1. Introduction
The grain cleaning loss is an important index in the combine performance tests and it affects the harvesting machine productivity and job quality [1]. During harvesting, the grain amounts are less than those of the stems and the grass when they get across the sorting screen. The grain loss signals are so weak as to be submerged in the noises from the combine and the sieve when it is detected by the sensors, which, with the disturbance of the mixture of stems and grass, results in the difficulty in testing the grain loss amounts. Northup et al. developed the grain loss monitor by using transducer and tachometer that could measure grain loss per unit area [2]. The obtained grain loss signal is uncertain with this method because of only using a single measurement loss sensor. The grain loss rate is obtained by two types of sensors, and either kind of sensor performance and reliability will influence the grain loss rate detection accuracy. Strelioff et al. proposed that the sound of the grain kernels striking the sensor was picked up by a microphone, amplified, filtered, and fed to a ratio computing device which calculates the grain loss [3]. It is obvious that the result is influenced by the external interference, such as the sound of combine vibration caused. Eldredge fixed a piezoelectric crystal to the vibrational cleaning sieve [4]. Loss of grain impacted the piezoelectric crystal and caused electric signal. The signal was amplified and transmitted to the counting device. This detection has some disadvantages, such as small detection range, big error, strong signal interference, and fragile piezoelectric ceramics. In order to improve the grain loss sensor installation method, Osselaere put the sensor into a sealed enclosure [5]. This device protected the grain loss sensor static performance from the external interference, but the dynamic performance of the sensor has not been improved, and the influence of the combine vibration, the ground bump, and the stems on grain signal cannot be restrained during harvesting. Diekhans and Behnke and Qi and Wann suggested that an electroacoustic transducer was fixed on the back of metal plate to detect the grain loss that impacted the plate [6, 7]. But the plate structure was not calculated and designed in detail. When the grains impact the plate, the signal attenuates slowly and radiates noise, which makes the sensitivity distribution on the plate surface uneven.
In order to improve sensor performance, Strubbe designed a transducer associated with the sensor plate according to grain loss signal frequency characteristic [8]. The transducer has a resonant frequency in the range of 8 to 25 KHz. Furthermore, they developed a high-pass filter to differentiate the grain signal from stems signal. Because of a single transducer and a single sensor plate, the device output is small, the grain loss signal is vulnerable to interference, and vibration signals cannot be restrained. Bernhardt and Hubner advanced an indirect means to measure grain loss [9]. The method reduces the drawbacks of direct measurement and improves measurement accuracy. Li et al. provided some improvements for decreasing vibration to improve the grain loss sensor sensitivity and the dynamic characteristic [10, 11]. As a consequence of using a single piezoelectric crystal as a force-sensitive element, its accuracy is still relatively low, and the proposed measures are not applied to the field test. Zhao et al. proposed a grain loss detection system based on PVDF [12], but the sensor is still under research.
From the existing reports about the grain loss detection of agricultural harvester, grain loss detection sets focus on pasting the piezoelectric unit on a flat panel. This structure does not bring into play the piezoelectric ceramic mechanical and electrical conversion capabilities. And the output signal is characterized by the weakness and the poor linearity. Since it is sensitive to the noises, its reliability is poor [13].
In this paper, the method about a full-width piezoelectric detection array construction is presented for the grain cleaning loss. And the information is obtained based on the method from the multiregional and many-sided access. The dynamic model for grain collision detection sensor array is studied by the experimental modal analysis method. The structure of the detection array is built. The finite element model is set up and the numerical simulations are done based on the ANYSIS software for the grain collision on the sensitive element. The array structure is optimized according to the numerical results and a uniform sensitivity distribution is obtained in full-wide range for the sensitive element. The optimized piezoelectric crystal sensor array performance is verified by the experiment on the test bench.
2. Signal Detection Methods for Grain Cleaning Loss
The grain and the stems are discharged from the sorting screen and fall into the sensitive elements installed in the rear of the sieve [14]. It is a space-time continuum process. The information obtained is usually incomplete and inaccurate by a single sensor detection method. And it is susceptible to the sensor's performance and other noises, so the data from the sensor are very uncertain. Array sensor detection methods can reduce the uncertainty in virtue of the information from the multiregional and many-sided access. And the system reliability is enhanced by the extra data and the complementary data form the sensor array. Meanwhile, the single sensor performance is extended [15].
Sensor array is fixed to the sensitive element in a certain way. When the mixture of the grain and the grass impacts the sensor, the sensitive element begins to generate a damped vibration. The signals from the damped vibration are trapped by the piezoelectric crystal sensor array and are converted into weak electrical signals correspondingly. Thus, the size and layout of the sensor array will affect the signals recognition accuracy for grain loss. Because the signals frequency and amplitude from the grain are different from those from the stems for their different impact force on the sensitive element, these signals will be processed by the conditioning circuit and the signal of the grain loss also will be separated from other signals.
3. Experimental Analysis of Sensitive Element
3.1. Sensitive Element of Piezoelectric Detection Array
When the grains impact the sensitive element, the piezoelectric crystal units and the sensitive element deform together. So, the strain value is proportional to the output charge occurring in the elastic deformation range; namely, the greater the former, the more the latter [16]. Therefore, the piezoelectric crystal unit is pasted in the local site with a remarkable strain. According to the method, the sensor array is constructed to recognize the signal of the grain loss and the resolution is improved.
Because the detection array sensitive element is impacted directly by the grains from the sorting screen, the materials and structural design of the sensitive element have an important effect on the signal acquisition and recognition [17]. The above study will be developed additionally [18, 19]. The structural parameters of the sensitive element are (1) structural forms: flat, (2) materials: 304 austenitic stainless steel, (3) size: length 300 mm, width 200 mm, and (4) thickness: 1.5 mm. An elastic film layer is pasted on the front facet of the sensitive element to reduce the bending waves generated from the grain impacting the sensitive element.
3.2. Experiment
Sensitive element is fixed to the four corners on the desktop and uniformly spaced 30 points are selected on its surface [20]. These points are marked from number 1 to number 30, respectively. The light piezoelectric sensor is affixed to the center of the sensitive element, as shown in Figure 1. The impact force generated from the grains is simulated by the test hammer forces on each point along the Z direction. The response signals are recorded by the dynamic signal analyzer correspondingly. The experiment interconnection is shown in Figure 2. In order to ensure the accuracy and reduce the error, the tests are divided into 3 groups including 90 points [21].

Sensitive element of the sensor for grain cleaning loss.

Diagram for experiment interconnection.
3.3. Result Analysis
The data are collected by a dynamic signal analyzer and are processed by means of the Me'scope VES4.0 software, from which the low-level resonant frequency and the strain distribution of the sensitive element are obtained. According to the sensitive element structure parameters and the distribution of the test points, a test model of the sensitive element is established based on the Me'scope VES4.0 software, as shown in Figure 3.

Sensor test model.
Seeing Figure 3, the 30 test points are corresponding to the 30 working points in Figure 1. The deformation scale at each point can be used to determine the strain distribution of sensitive element, which helps to decide the quantity and position of the piezoelectric crystal units [22, 23]. The deformation is shown in Figure 4 for each test point.
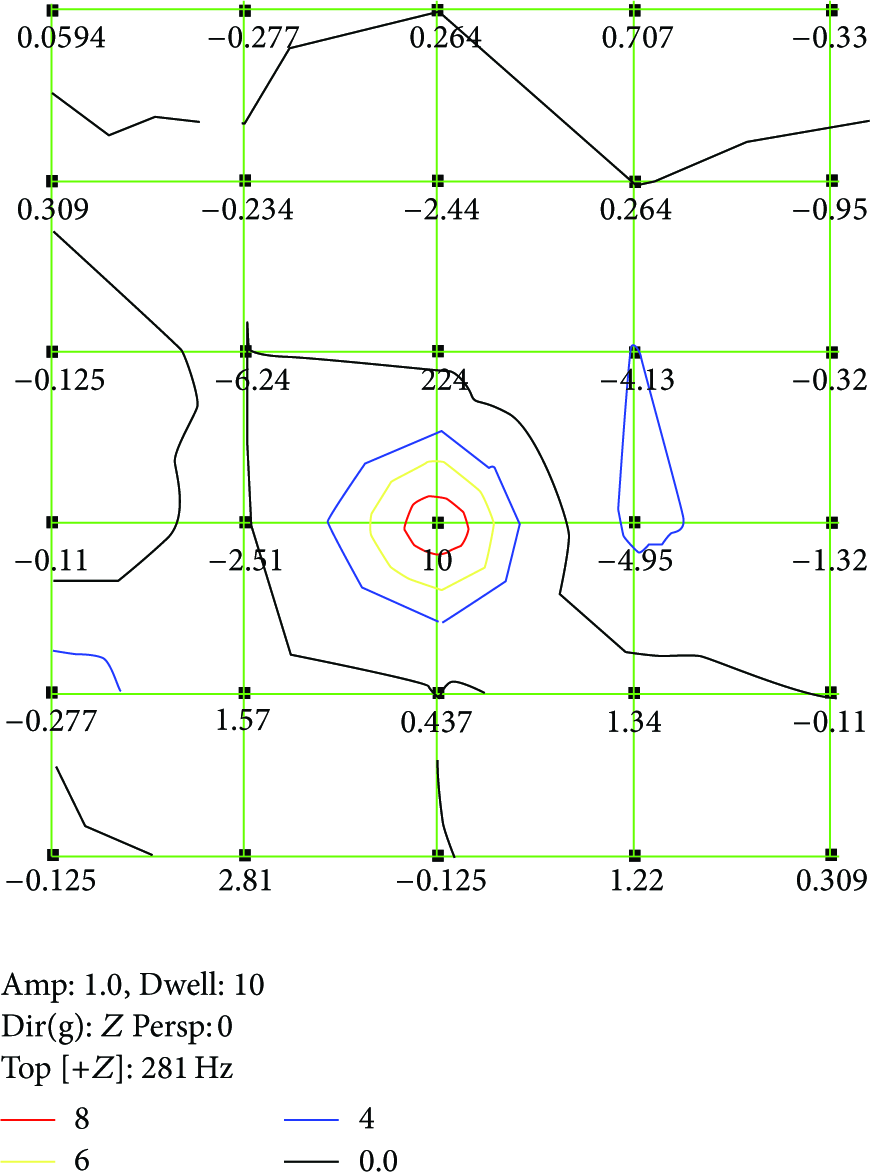
Map of sensor dynamic deformation. Note: the figure numbers indicate the point related to the amount of deformation.
As shown in Figure 4, the largest dynamic strain occurs in number 18 (10); the lighter strains occur in number 2 (0.125), number 5 (0.22), number 10 (0.264), number 25 (0.11), number 26 (0.109), and number 27 (0.125); above points are located in fix points along the peripheral zone near to the sensitive elements. Except number 18, the more obvious responses occur in number 12 (6.24) and number 14 (4.13) and number 19 (4.95). Based on the above test data, the sensor array is constructed by selecting four piezoelectric crystal units to paste on number 12, number 14, number 18, and number 19. The detection results will be satisfied with this method.
4. Structural Optimization of Piezoelectric Detection Array
4.1. Sensitivity Distribution
To ensure the impact responses from each point in the sensitive element to uniform, the structure must be optimized for the piezoelectric detection array to obtain the same sensitivity wholly. The piezoelectric crystal position is determined according to the more obvious strain points. It can enhance the weak signal from the grains impact. The motivation and the response from the detection array are different when the same grain acts on the different position because of the mutual independence among the piezoelectric crystal units. By experiment, it is found that the detection array will generate a larger amplitude when the motivation acts on the points 18 and 19, and, inversely, it will be lighter in other points. The main reason for this phenomenon is the difference deformation amplitude value and the absolute sensitivity for the piezoelectric crystal units in the array. So the uneven distribution for sensitivity creates a variant output for the same motivation.
4.2. Detection Array Optimization Based on Finite Element Analysis
After the sensitive elements finite model is established and meshed, the simulation of the grains impact on the sensitive element is done based on the ANSYS software [24, 25]. Because the sensitive element is a symmetric plate structure, it has taken the selected test points in 1/4 model size into account and the static force is applied on these test points to simulate, as shown in Figure 5.

Finite element model and position of static force for sensitive elements. (The numbers denote the grid labels.)
The grid length is 5 mm and the grid labels are automatically generated by ANSYS software. For convenient description, the point positions are marked by the grid labels. The symmetric points are selected to simulate the grains impact, such as number 1367, number 1361, number 1350, number 1395, and number 1946, and 1N load is applied to the sensitive elements. The deformation contours are obtained along the Z direction by automatic solving in postprocessing, as shown in Figure 6.

Deformation contours for the points after static load on sensitive elements. Note: (a) force at point 1361; (b) force at point 1367; (c) force at point 1395; (d) force at point 1946; (e) force at point 1350.
The qualitative analysis of the deformation for the piezoelectric crystal units can be done according to Figure 6, and, combined with Figure 3, it can be found that the sensitive element deformation is almost equivalent in number 12 and number 14, but it is relatively larger in number 18 and number 19, even if it is above the three contours. The piezoelectric crystal detection array is pasted in number 12, number 14, number 18, and number 19, which enhances impact signal intensity and increases the resolution but cannot obtain the same sensitivity overall within the framework. The sensitive element sensitivity is uniform on the premise that array layout can ensure the intensity of grain impact signal. Therefore, a fine modification must be done for the original array construct. The steps are as follows. Firstly, the grid labels for number 12, number 14, number 18, and number 19 must be found among the uniformly spaced 30 points (see Figure 3). Then the piezoelectric crystal units are moved locally along the contour and the numerical results are extracted from the ANSYS postprocessing along the Z direction. Last, the displacement sum is computed for all the nodes to correct the position located by the piezoelectric crystal units in the array. The adjustment and computation and verification are repeated more until the placement sum is similar. The results from number 483, number 503, number 2199, and number 2219 are satisfactory based on the repeated test. As shown in Table 1. “
Displacement for piezoelectric crystal units in the array nodes.
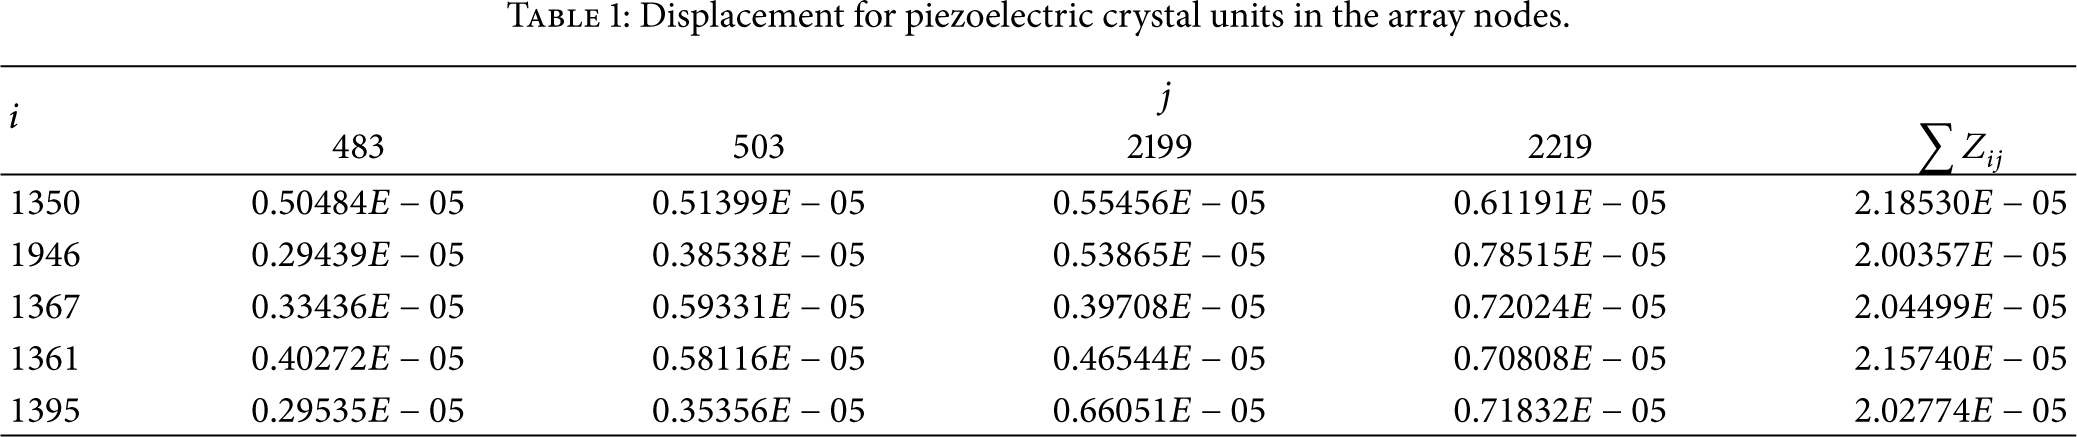
When forced on the sensitive element, the deformations are variant at different points in the sensor array. Larger deformation can be found when the force point is near the piezoelectric crystal units and it is lighter when the force point is far from the piezoelectric crystal units. However, the deformation sum is approximately equal for all the piezoelectric crystal units in the array. So the sensitivity is uniform among the range for the grains impact signals detection.
4.3. Experimental Validation
The grain impact experiment is developed on the nonvibrating test bench in the laboratory to test the performance for the piezoelectric crystal sensor array. The piezoelectric crystal units with the similarly parameters are pasted on the back of the sensitive elements and they are correspondent to the points. The four corners are fixed to the test bench. The grains freely fall down from 300 mm above the test bench and impact the sensitive element at random. Four-channel charge amplifier, with 10 pc/unit sensitivity and a gain of 10, is taken as the presignal conditioner for the piezoelectric crystal detection array; a gain compensation amplifier is used to adjust the output signal amplitude. Grain impact signals are recorded by a high-speed data acquisition system with a frequency of 40 kHz. The results are shown in Figure 7.
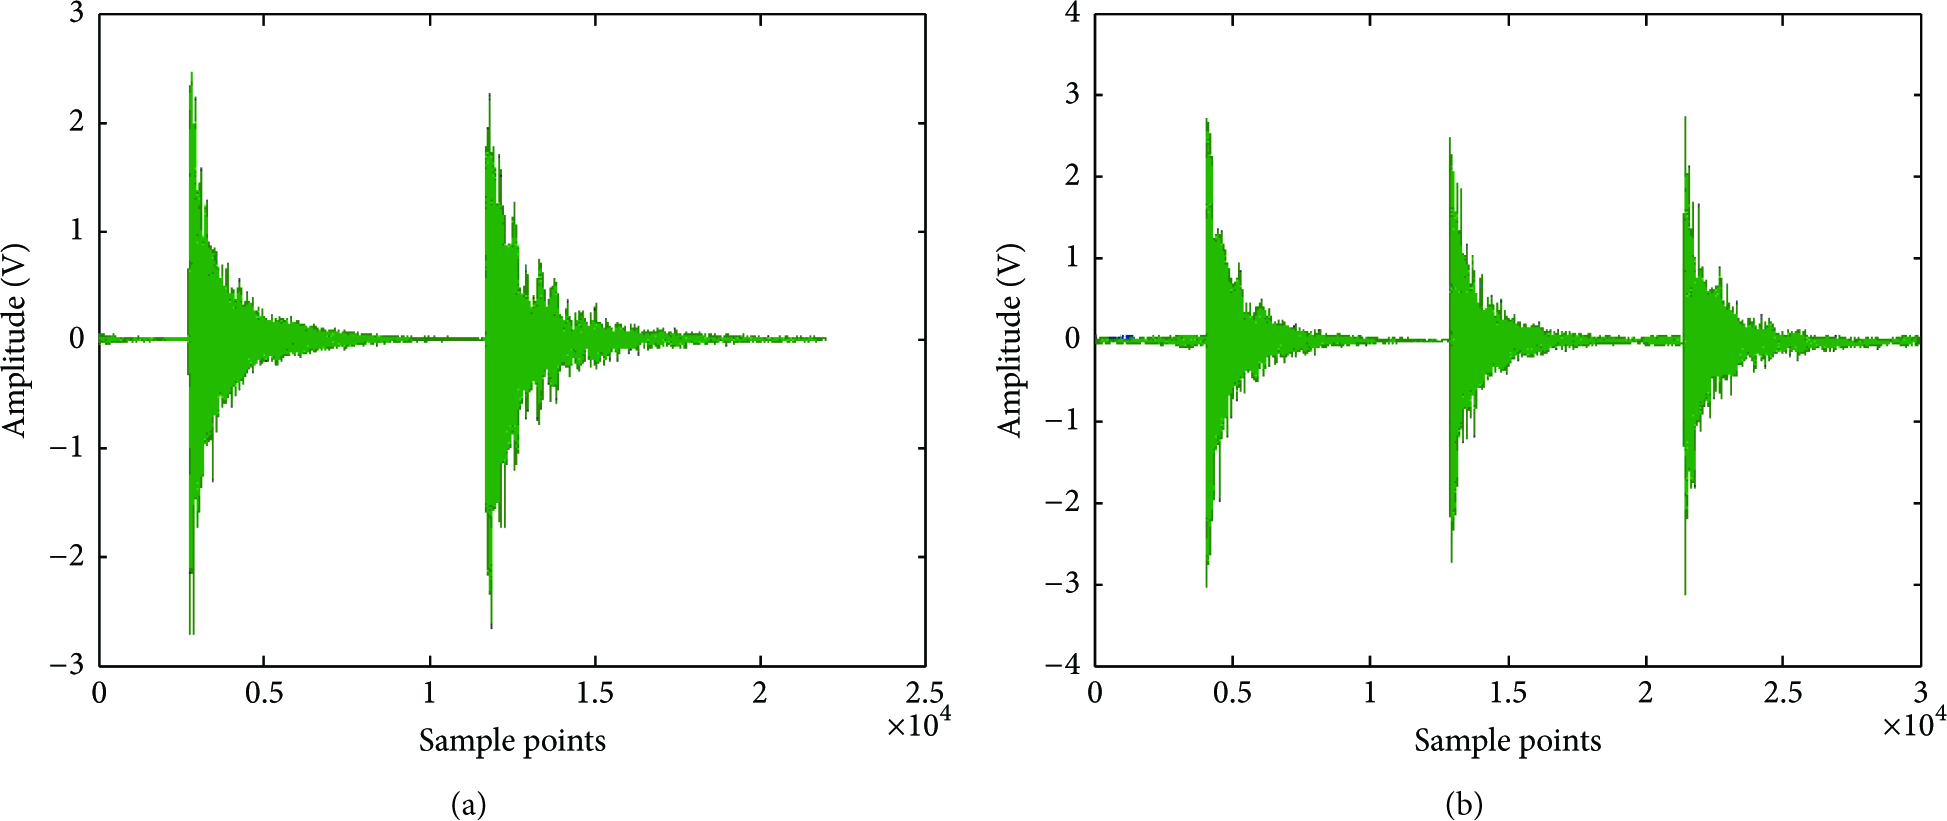
Signal response of grains impact for optimized detection array.
Seen from Figure 7, a signal with an about 2.5 V amplitude is output from the detection array when a grain impacts the sensitive element at random. The array performance is stable and the resolution is good for different test points. Meanwhile, the impact response tends to be consistent for the grains impact.
5. Conclusions
The dynamic analysis was conducted for impact of grains on the sensitive element, and then the piezoelectric crystal detection array was constructed. Based on the process simulation using ANSYS software, the array construction was optimized. An experiment was established on the test bench to verify the performance of the sensor under study. The results showed that the piezoelectric crystal detection sensor array not only enhanced the signals for grain cleaning loss, but also gave a uniform sensitivity in the all-width range for the sensitive element. The sensor array was characterized by the stable performance and good signal-to-noise ratio. The present sensor lays a foundation for quantitative online monitoring of the grain cleaning loss.
Footnotes
Conflict of Interests
The authors declare that there is no conflict of interests regarding the publication of this paper.
Acknowledgments
The senior author would like to express his gratitude to all those who helped this research, with particular thanks to Professor Mao who offered many valuable suggestions.