
Abstract
With the development of the Internet of Things (IoT for short), innumerable Wireless Sensor Networks (WSNs) are deployed to capture the information of environmental status in the surrounding physical environment. The data from WSNs, called sensor data, are generated in high frequency. Similar to data of other open-loop applications, for example, network monitoring data, sensor data are heterogeneous, redundant, real-time, massive, and streaming. Hence, sensor data cannot be treated as the IoT business data, which brings complexity and difficulty to information sharing in the open-loop environment. This paper proposes a dynamic sensor data processing (SDP) system to capture and process sensor data continuously on the basis of data streaming technology. Particle Swarm Optimization (PSO) algorithm is employed to train threshold dynamically for data compression avoiding redundancy. With the help of rules setting, the proposed SDP is able to detect exception situations. Meanwhile, the storage models in SQL and NOSQL databases are analyzed and compared trying to seek an appropriate type of database for sensor data storage. The experimental results show that our SDP can compress sensor data through dynamically balancing the accuracy and compression rate and the model on NOSQL database has better performance than the model on SQL database.
1. Introduction
The Internet of Things (IoT) [1–3] is a concept which aims to integrate the virtual world of information technology with the real world of things seamlessly. The perception layer of the IoT consists of a large number of Wireless Sensor Networks (WSNs) [4]. Sensors in WSNs are adopted to sense the environment bridging machines and physical world, especially in manufacturing and logistics applications. Sensors frequently collect heat, power, light, sound, speed, and so on as signals to provide raw information for information systems. These signals are sensor data which reveal the environmental status. In traditional sensor applications, such as greenhouse monitoring, sensor data were processed and stored in a single system. Accordingly, there was little need for exchange of data across organizational boundaries. Hence, the traditional sensor applications often become close-loop applications. The IoT applications, which always involve various stakeholders and require information exchange and sharing, are open-loop applications. Similar to other applications in the open-loop environment, the sensor data in the IoT applications have the following five characteristics.
Sensor Data Are Heterogeneous. The types and functions of sensors are diverse. Temperature and humidity sensors and illumination sensors are common in agricultural and logistic applications, while blood sensors monitor blood pressure, heart rate, and other body indices. Different types of devices monitor various indices. Besides, the protocols the devices use are diverse. The data from various sensors are in heterogeneous formats.
Sensor Data Are Redundant. The state of the environment or the human being whom a sensor is monitoring is stable during a short time. For example, the temperature of a room may remain unchanged or float little in 5 minutes in common situations. Since sensors collect information in seconds, database will meet heavy load, grow quickly, and have a bad performance if storing all of those data.
Sensor Data Are Real-Time Data. Sensor data are collected over time. So sensor data are real-time data in fact. Processing the sensor data in time can bring benefits into the IoT. For example, once an abnormal situation occurs, a timely exception detection can help operators make decisions or adjust measures fast to reduce the loss.
Sensor Data Are Massive and Streaming. As the production costs of sensors come down, more and more sensors are applied to detect complete environmental information. Meanwhile, sensors are set to collect data in seconds. Hence, sensor data are generated and streamed to the Internet. And the amount of sensor data is large.
In order to maximize the use of sensor data, the processing systems are required to recognize these characteristics. We propose an IoT sensor data processing (SDP) system based on data streaming technology, trying to do dynamic data compression reducing redundancy with the help of Particle Swarm Optimization (PSO) algorithm and to detect exception situations in real-time. Meanwhile, we seek an appropriate type of database to store massive sensor data. The experimental results show that compression method can train a threshold to balance the accuracy and compression rate, and the model on NOSQL database has distinctly better performance than the model on SQL database.
The remainder of the paper is organized as follows. Section 2 describes the related work. Section 3 introduces the preliminary notions. Section 4 presents the framework of the proposed processing system SDP. In Section 5, we conducted experiments on real sensor data and present the results. Section 6 concludes this paper.
2. Related Work
Existing researches on sensor data processing can be summarized into two categories: the bottom-up approach and the top-down approach. The bottom-up category models sensors and sensor networks from the device perspective. SensorML [5], IEEE1451 [6], and GSN [7] fall under the bottom-up category. SensorML models the sensor related processes for consistent handling. IEEE1451 defines transducer interface to access and manage smart transducers. GSN abstracts sensor data sources, specification, and query tools into XML description offering plug-and-play detection and deployment. The researches in bottom-up category noticed the heterogeneous and streaming characteristic; the other three were not in their consideration. The top-down category builds from the application perspective by analyzing functional requirements. The sensor network services platform (SNSP) [8], Cougar [9], sensor information networking architecture and application (SINA) [10], and COSMOS [11] belong to the top-down category. SNSP proposed a set of fundamental services and interfaces primitives to provide query operations on sensor networks. Cougar offered an in-network query processing mechanism. SINA attempt to find an optimal way to facilitate querying, monitoring, and tasking of sensor networks. COSMOS provided a method to integrate data over heterogeneous sensor networks and defined a standardized communication protocol and message formats. The researches in this category were all focusing on the heterogeneous characteristic; the other four were not considered in their papers.
Those methods mentioned above could not handle the sensor data according to all characteristics and support dynamic processing in an open-loop environment. Compared with those frameworks, the proposed SDP system which belongs to the bottom-up category pays attention to all the five characteristics and differs in the following aspects:
Based on unified data model, data compression method employing PSO algorithm is present to reduce redundancy. The proposed system adopts data stream technology to monitor real-time and streaming exception situations. Relational and NoSQL databases are compared and analyzed to seek a better model for massive sensor data storage.
3. Preliminary Notions
3.1. Particle Swarm Optimization
Particle Swarm Optimization (PSO) [12–14] proposed by Kennedy is an artificial intelligent algorithm aiming to help finding the optimal state in D-dimensional search space with the help of the interactions between particles in the swarm.
Every individual particle i moves toward the


The structure of PSO is asshown in Algorithm 1. The
Initialize a population of particles with random positions and velocities on D dimensions in the search space. (1) Calculate new (2) Update the position (3) Evaluate the value if update
Algorithm 1
3.2. Data Compression Measurement Indices
To evaluate the accuracy and the compression rate of data, we employ Amplitude Error index to represent accuracy and Compression Ratio index to stand for compression rate.
3.2.1. Amplitude Error Index
Amplitude Error (AE) [16] is a measure of similarity between the input numerical list and the output numerical list of a method. It is often used to evaluate the accuracy of ECG data compression [17]. The smaller AE value between the recovered list from the output list of a compression method and the original ECG list reflects that the higher accuracy is achieved by this method. Our sensor data compression is similar to ECG data compression; we borrow this index to evaluate our compression accuracy.
Given an input numeric list, IList =

3.2.2. Compression Ratio Index
Compression Ratio (CR) [18] also comes from ECG data compression. It is a measure of the changes in the data amount. The smaller CR value represents that the larger amount of data have been compressed.
Given an original numeric list, OList =

3.3. Fundamental Elements in the IoT
In an IoT information system, there are four fundamental concepts [19–21].
Entities. These include all RFID-tagged entities, such as items, cases, pallets, and even patients with RFID [22] bracelets.
Readers. There are two types of readers. One type is RFID reader; the other type is sensor reader which refers to the base station of WSNs. RFID readers use radio-frequency signals to communicate with RFID tags and also create business events, which describe the life cycle of an entity. Base stations collect data from the gateways of WSNs and stream all the data out to the Internet.
WSNs. WSNs collect and aggregate the environment information through sensors and communicate with base stations through gateways.
Container. A container is symbolized to represent where entities or readers or sensors locate. It may be a warehouse or a truck. The common identification of a container is the Global Location Number (GLN) [23] code defined by Globe Standard 1 (GS1) [24]. In general, more than one reader and at least one sensor are deployed in one container for tracking entities and monitoring environment.
4. Sensor Data Processing System
Figure 1 shows the components of proposed IoT sensor data processing (SDP) system and its relationship with the applications in the open-loop environment. We treat each piece of sensor data as an event, called sensor event. In the open-loop environment, there are WSNs deployed in physical containers and applications requiring information exchange. The SDP system consists of Observation Capturer, Real-Time Exception Monitor, and Dynamic Compression, three components. Sensor data streamed into SDP are in unified format, called Observation. One single index which describes a physical phenomenon state is called Phenomenon Event in SDP. Observation Capturer receives all the Observations from distributed base stations and split Observations into different Phenomenon Event according to the type of index. Real-Time Exception Monitor detects exception Phenomenon Event and pushes exception warning out. Dynamic Compression employs PSO algorithm to train threshold to compress Phenomenon Event.

Framework of SDP system in IoT.
4.1. Unified Sensor Data Definitions
We first introduce the new concept of Observation (O for abbreviation), which is a data object recording the basic information a sensor and the values of phenomena. A phenomenon is a collected condition state. For example, a temperature of value 23.2°C is a phenomenon.
Definition 1 (Observation).
Consider
O := <S_addr, Time, P> P :=
Here, S_addr refers to the address of the sensor. The addresses of sensors in different WSNs differ with each other. The most common types of S_addr are <gateway ip, sensor_set_off>, and sensor_ip. Time means the collected time of an Observation. <ph_type, ph_value, ph_unit> is a triple, where ph_type refers to the type of a phenomenon, ph_value refers to the value of a phenomenon, and ph_unit denotes the unit of ph_value. The sign + indicates that there may be more than one triple of phenomena generated by a sensor.
The following is an example of O.
Examples
<“192.168.0.12”, “01”, 2014-04-30 14:52:36,
We split Observations into Phenomenon Event (PE for abbreviation) list.
Definition 2 (Phenomenon Event).
Consider
PE := <Ph_Type, S_addr, Time, Value, Unit>.
Here, Ph_Type refers to the type of a phenomenon. S_addr and Time are inherited from Observation. Value is the numeric value of a phenomenon recorded by a sensor. Unit denotes the unit of Value.
The example in Definition 1 is split into two PEs:
PE1 = <“air_temperature”, “192.168.0.12_01”, 23.3, “C”, 2014-04-30 14:52:36> PE2 = <“air_humidity”, “192.168.0.12_01”, 65.0, “%rh”, 2014-04-30 14:52:36>.
4.2. Collection
4.2.1. Observation Capture
Base stations which wear the managing gateway of WSNs parse pieces of raw sensor data into the form of Os. Once Observation Capturer catches an O, it splits O into several PEs and puts them into time windows according to their Ph_Type and S_addr attributes. A time window, which is set to output a list when time is up or the list is full, collects PEs for a preset time. Phenomena with the same Ph_Type and S_addr are pushed into the same time window. When a time window is full or the time is up, Observation Capturer gathers the PEs in the window into a PE list and passes this list to Dynamic Compression. The PEs in this list contain values of the same phenomenon and from the same sensor. So, the values are comparable.
4.2.2. Dynamic Compression
Dynamic Compression (DC) component, here, tries to compress data discarding the redundant PEs to reduce the load of Real-Time Exception Monitor system and data repository.
One data compression method is to record the first value in a sequence which contains the continuous same values. Hence, once a new value comes into the sequence, it will be the next recorded value. Using this method, PEs generated by a sensor containing two different air temperature values, 23.3°C and 23.4°C, would be two recorded Phenomenon Events. However, 0.1°C, the difference between 23.3°C and 23.4°C, does not mean a significant change of environment in some situations, such as in the greenhouse.
The other way called Threshold Compression is to preset a threshold and then discard the values whose difference with the last record is less than the threshold. This is the most common data compression method. It has three limits when it comes across the IoT sensor data. Firstly, the bigger the threshold is, the more values would be thrown away causing lower accuracy. In other words, when the threshold is reduced, higher accuracy will be achieved but more redundant data are stored. The previous method is one special case of this method with the smallest threshold zero. So, finding an appropriate threshold is a balance between accuracy and storage size. Secondly, there are various types of phenomena in the IoT. Presetting thresholds for all phenomena needs a lot of work. Thirdly, sensor data change all the time. A current appropriate threshold will be improper for future data sequence.
Here, DC seeks a threshold for each phenomenon type dynamically to balance accuracy and compression rate with the help of PSO algorithm and the crossbreeding of particle swarms. The primary goal of DC is to get the minimum AE. Based on this goal, we try to reduce the redundancy of PEs in PE list making smaller CR.
Once a PEList comes, DC executes the following steps to get a compressed PE list, CPEList.
Step 1.
Initialize two particle populations of size m with random positions and velocities on
Step 2.
Update the velocity and position of all particles in CRP and AEP with (1) and (2).
Step 3.
For each

Step 4.
Replace
Step 5.
Generate compressed PE lists for all particles in CRP with their positions as thresholds. Evaluate CRs for the particles in CRP using their compressed PEList with (4).
Step 6.
Generate compressed PE lists for all particles in AEP with their positions as thresholds. For each particle, reconstruct time-value line with the PEs in its CPEList using the process described in Section 4.2.3, and calculate AE between PEList and CPEList.
Step 7.
For each particle in CRP, compare its current CR value with the CR of its
Step 8.
For each particle in AEP, compare its current AE value with the AE of its
Step 9.
Determine the global best particle, gbCRP, in CRP with the smallest CR value.
Step 10.
Determine the global best particle, gbAEP, in AEP with the smallest AE value.
Step 11.
Use the position of gbCRP as threshold to generate a compressed list, CRCPEList from PEList, and calculate the AE value between CRCPEList and PEList.
Step 12.
Compare the AE value from Step 11 to the AE value of gbAEP. If the AE value of gbAEP is bigger, then set the position of gbAEP to gbCRP's positon.
Step 13.
Repeat Step 2 to Step 12 until a sufficiently good AE or a maximum number of iterations are met.
The position of gbAEP after the above 13 steps is the optimal threshold that can help us to compress PEList into CPEList balancing accuracy and compression rate.
4.2.3. Time-Value Reconstruction
All of the PEs in a PE list are of the same type; two key attributes in a PE are time and value. So reconstruction of a PE is to recalculate the phenomenon value with a time. The time-value pairs in the compressed PE list are discrete points. For reconstruction, we make Time attribute as X coordinate and Value attribute as Y coordinate. For all PEs in a compressed PE list, mark (Time, Value) points one by one, and draw lines between two adjacent points. The Y values in the connected line are the reconstructed values of PEs for a certain time.
For example, given a compressed Phenomenon Event List, CPEList,
CPEList =
The points on the line in Figure 2 are the reconstructed Phenomenon Events.
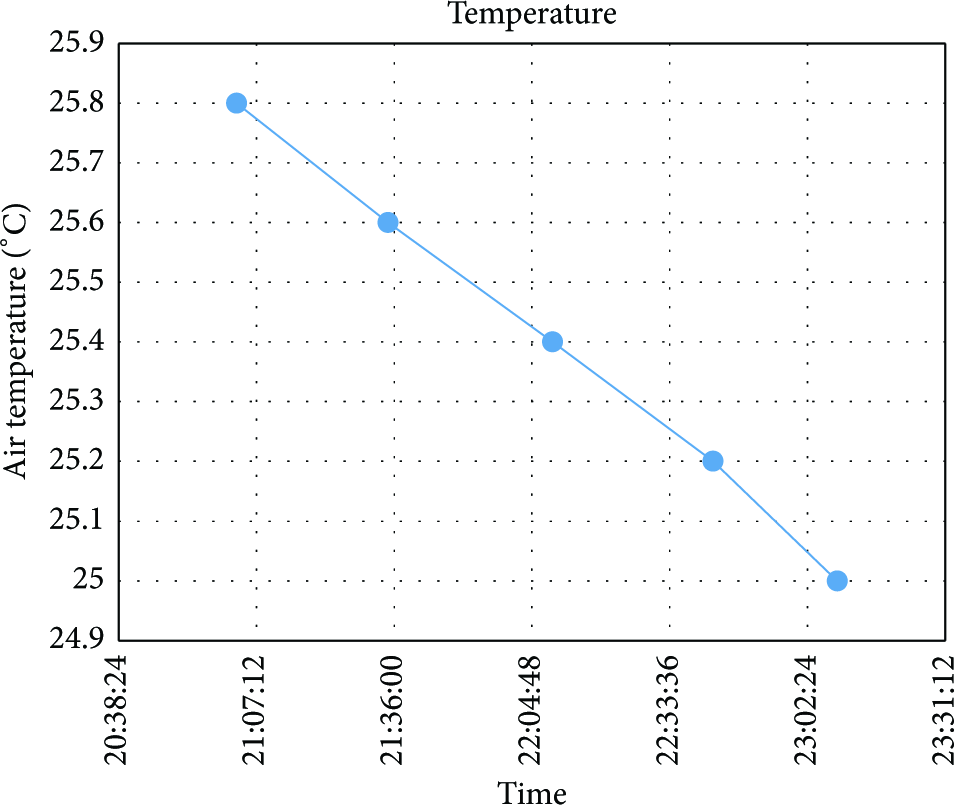
Example of time-value reconstruction.
For example, the value at time 2013-06-19 21:50:24 on the line chart is 25.5. So the reconstructed PE is <“air_temperature”, 192.168.0.12, 0x001, 25.5, C, 2013-06-19 21:50:24>.
4.3. Real-Time Exception Monitor
As explained, sensor data reflects the phenomenon status in the physical space. Hence, sensor data are closely associated with the containers. The monitored containers require that the phenomenon states are stable in certain intervals. For example, a warehouse in a cold train loaded with meats requires air temperature maintained at [−18°C, 0°C]. Once the air temperature is out of this interval, especially, beyond the limits, warnings are required to be pushed out to the applications.
Real-Time Exception Monitor (REM) receives compressed Phenomenon Event List, CPEList, from Dynamic Compression (DC) to detect exception situations. Although the elements in CPEList are not the complete captured Phenomenon Events, they are still key elements collected with a threshold. Therefore, the Phenomenon Events in CPEList can represent the actual exception situations.
REM maintains a Rule Repository and a core execution component Real-Time Exception Monitor Core (REMC for short). Rule Repository stores a set of rules defining the standard phenomenon interval. Every rule is formatted as a RL:
RL := <GLN, Ph_Type, Min, Max, Unit>.
Here, GLN is a thirteen-digit number used to identify parties and physical locations. Ph_Type denotes the type of a phenomenon. Min and Max describe a standard range with Unit of Ph_Type. The following example shows a standard air temperature interval [−18°C, 0°C] of a warehouse with GLN 6901404000029 in meat cold chain.
Examples
<6901404000029, “air_temperature”, −18, 0, “C”>.
REMC focuses on the exception monitoring execution. Once a compressed PE list comes, REMC first uses the common sensor address of elements in CPEList to get the respective GLN number. Then, REMC retrieves RL for the container from Rule Repository with the GLN and the common Ph_Type of PEs. From all hit RLs, REMC looks for the maximum Min and minimum Max to form the minimum standard range for all types of entities. For each PE in the compressed PE list, if the value is not in the range, REMC will send out a warning.
4.4. Sensor Data Storage
As described in Section 3, an information system manages several containers and at least one sensor is deployed in a container. Meanwhile, the sensors collect information of various phenomena in seconds. As a result, the number of Phenomenon Events generated each day is large. Although PEs have been compressed in Dynamic Compression, the stored number still increases fast. To find a better way to store and retrieve Phenomenon Events efficiently supporting environment information discovery for entities, we attempt to maintain sensor data in two ways, SQL database and NoSQL database.
4.4.1. SQL Database
The structure of sensor data in SQL database is designed as Figure 3. A container contains one or more sensors, and sensors generate several types of events. Considering the insertion and selection operations focus on single type of phenomenon, we classify events into different tables according to their types to reduce the size of Phenomenon Event table. In this way, if more phenomena are monitored, more tables will be created. To improve data retrieving efficiency and reduce the storage space, we define fields using variable characters instead of characters, float replacing decimal number, and timestamp rather than datetime.

Database structure in SQL DB.
Insertion. PEs in the compressed PE list are stored directly into corresponding table grouped by their Ph_Type.
Query. The most common query on sensor data like the following example takes a GLN number and a time slot to search the records of a specific phenomenon. GLNCode in Container table and time in Phenomenon Event tables appear often:
Select
∗
from AirTemperatureEvent a join sensors on a.SensorID = s.SensorID join Container c on s.ContainerID = c.ContainerID where c.GLNCode = ‘1’ and a.time between ‘2013-06-19 20:00:00’ AND ‘2013-06-20 16:59:59’.
For dereasing the event retrieving time, we add indices on GLNCode field and time field.
4.4.2. NOSQL Database
NoSQL database maintains sensor-GLN collection and Phenomenon Event collection. Algorithm 2 shows the storage example tuple in NoSQL database. Since NoSQL database stores data in collections, this paper divides the Phenomenon Event and basic information of sensor and containers into two collections. Sensor-GLN collection maps the relationship between sensor address and GLN number of physical container managing [S_addr, GLN] tuples. Phenomenon Event collection stores [Ph_Type, S_addr, Ph_Value, Ph_Unit, Time] tuples. S_addr, which represents the sensor deployed in container and the data source of Phenomenon Events, is the key value to build relationships between physical containers and the actual values of phenomena, while physical containers are identified with GLN code.
Example of Sensor-GLN collection { “Sensor_Addr”: “222.73.86.252.0003”, “GLN”: “6901125000107”, } Example of Phenomenon Event collection { “Sensor_Addr”: “222.73.86.252.0003”, “Ph_Type”: “air_temperature”, “Ph_Value”: 23.6, “Ph_Unit”: “C” “Time”: 2015-02-03, }
Insertion. PEs in the compressed PE list are stored directly into Phenomenon Event collection without extra operations, since all tuples in this collection record their Ph_Type.
Query. The most common query is also finding the Phenomenon Event that happened in a container during a time slot. This query would require executing querying operation two times. Firstly, get the S_addr list with GLN from sensor-GLN collection. Secondly, for each S_addr, find all events records generated over this period.
To reduce the query times, there is another way to store PEs. It is to find the GLN number with S_addr before inserting a PE and store [Ph_Type, GLN, Ph_Value, Ph_Unit, Time] tuples in Phenomenon Event collection. However, as to the current situation, insertion operations of sensor data happen more frequently than queries. Hence, we adopt the first design on NoSQL DB.
5. Evaluation
5.1. Experiment Setup
We implemented a prototype of the proposed sensor data processing system SPS. Our experimental platform consists of a PC running Windows 7 professional with 4.00 GB memory and Intel(R) Core(TM) i3-3220 CPU @ 3.30 GHz processor. The parameters of PSO are set as in Table 1. The selected SQL database is MySQL, and the representative of NoSQL database is MongoDB.
Parameters of PSO.

5.2. Performance Evaluation
In order to evaluate performance of our SDP system, three experiments are conducted. The first experiment is to show whether DC can compress data dynamically according to the characteristics of data sequences. The second experiment is to show how the number of PEs affects the compression speed and how the selections of database affect the storage speed. The third experiment is to show how the setting of database affects the tracing speed.
Testing data came from Wuxi Institute of Fudan University. These data were recorded every 5 seconds by the sensors in a greenhouse. For each experiment, we set the window size to 30 seconds. To test the performance of our framework, all PEs were submitted to the sliding window in 30 seconds.
There are many factors affecting the performance of the proposed IoT sensor data processing SDP system, such as the characteristics of the PEs, the number of PEs, and the settings of database. In our evaluation experiments, we focused on how the number of PEs and the selections of database affect performance. Meanwhile, we try to evaluate whether the data compression (DC) can compress data dynamically according to the characteristics of data sequences. The initial parameters of PSO are set as in Table 1 before experiment.
The first experiment was conducted with the 1867 pieces of air temperature records and 1868 pieces of pressure records as PEs. We measured the accuracy, AE, and the compression rate, CR, when DC outputs a compressed PE list for a phenomenon type. The experimental results are shown in Figures 4 and 5. We can see that DC keeps all PEs whose value of pressure differs from their previous recorded value, while DC finds the trend of air temperature in Figure 5 and records only 5 points. DC can find a threshold to balance the accuracy and compression rate. Meanwhile, the value of AE index approximates 0.00321, and the value of CR is near 0.5133 in Figure 4. And the data compression of air temperature in Figure 5 can achieve AE value of 1.28197 and CR value of 0.00268. This part of experiment shows that the proposed dynamic data compression can identify the trends of data and balance the accuracy and compression rate. Redundancy from sensor data can be avoided.

Compression result of pressure data.

Compression result of air temperature data.
The second experiment was conducted with the number of sensor data varying from 500 to 1000000. We measured the time when DC begins compressing, the time of DC after compression, and the time after storage. The second one subtracted by the first one was considered as the compression time, and the last one subtracted by the second one was taken as the storage time. The result is shown in Figure 6 and it reflected that the compression time of DC has linear relationship with the number of PEs. The time storing PEs into MySQL database increases faster than the time storing data into MongoDB.

Compression and storage time with various numbers of PEs.
The third experiment was conducted using a query to trace the air temperature information during the lifecycle of an entity with an EPC. The number of recorded PEs in database varied from 69880 to 1985247. The query time of MySQL and MongoDB is shown in Figure 7. We learned that the tracing time of MongoDB grows faster than the time of MySQL. The reason is that MongoDB had to execute two queries when the number of tuples increases. However, comparing to the storage time, the time cost by the sensor data queries of MongoDB is short.

Query time with various numbers of tuples.
Hence, when applications are faced with a large amount of sensor data storage, it is better to store sensor data into nonrelational databases, while when the number of environment information discovery queries is larger than storage, rational databases have better performance.
6. Conclusion
In this paper, we present a new IoT sensor data processing (SDP) system to process sensor data dynamically in the context of the Internet of Things. First, heterogeneous sensor data are captured and transformed into unified data format. Second, Particle Swarm Optimization algorithm is employed to do data compression avoiding redundancy and helping to reduce the load of database by adding crossbreeding operation on PSO algorithm. The proposed SDP system detects exception situations by setting the standard phenomenon rules of containers. Meanwhile, an appropriate type of database suitable for the sensor data storage in the IoT is sought and analyzed in this paper. The experimental results show that the proposed compression method can find a threshold achieving high compression rate and keeping accuracy, and NoSQL database has better performance in sensor data storage while relational database does better when executing environment information discovery queries.
Footnotes
Conflict of Interests
The authors declare that there is no conflict of interests regarding the publication of this paper.