
Abstract
Web and mobile platforms have provided an environment of technical cooperation through technical development and the diffusion of related devices. Large-scale data sets have been available to analyze web interaction and data analysis. Particularly, large-scale data make us learn new patterns and insight into several research fields. For healthcare field, most chronic diseases are caused by environmental and genetic factors (Van der Laan et al., 2003). The relationship between environmental exposure and gene factors is crucial regarding disease etiology (Swift et al., 2004). For example, Tobacco is considered one of the biggest environmental factors responsible for many diseases each year. Schwartz and Collins (2007) discussed the importance of gene and environment factor correlation in human diseases. Thomas (2010) published a review of different approaches on gene-environment association studies attempting to explain some of the most complex diseases. Although previous studies have studied chronicle diseases with their causes one by one, those studies do not show integrated relationships between various diseases and their related human genes. Therefore, this study investigates the gene-disease relationships which are affected by tobacco and is able to find new association links with social network analysis and other mining techniques.
1. Introduction
Web and mobile platforms have provided an environment of technical cooperation through technical development and the diffusion of related devices. Based on text mining, large-scale data sets have been available to analyze web interaction and data analysis. Particularly, large-scale data make us learn new patterns and insight into several research fields. For healthcare field, most chronic diseases are caused by environmental and genetic factors [1]. The investigation of causal relationships between environment factors and human genes is important regarding disease etiology [2, 3]. For example, tobacco is considered one of the biggest environmental factors responsible for many diseases each year. Schwartz and Collins, in 2007 (science), discussed the importance of gene and environment factor correlation in human diseases. In 2010, a previous study published a review of different approaches on gene-environment association studies attempting to explain some of the most complex diseases [4]. Although previous studies have studied chronicle diseases with their causes one by one, those studies do not focus on the integrated relationships between various diseases and their related human genes. Therefore, this study investigated analyzing the gene-disease relationships for tobacco and finding out new association causal links conducting social network analysis and mining techniques.
2. Related Works
2.1. Chronic Diseases and Data Mining
Previous studies have investigated the chronic diseases with data mining [5]. To find out how to decrease risk of chronic diseases, many works used data mining technics like case-based reasoning and machine learning [5, 6]. According to previous studies, data mining can help improve diagnosis systems and treatment of chronic diseases [6, 7]. Data mining technics make professionals improve treatment for patients of chronic diseases. Previous studies have investigated the effectiveness of data mining and its performance for improving clinical data repositories and diagnosis systems [6, 8]. Although data mining technics are powerful for treatment and diagnosis systems, there has been no study related to diagnosis of chronic diseases with social network analysis. In addition, this study tried social network analysis with collaborative filtering to find out causal relationship and correlations with gene and chronic diseases.
2.2. Social Network Analysis
Social network analysis (SNA) is the analysis of social relationships based on network theory. Social network consists of nodes (i.e., individual entity within the relationships) and ties which represent relationships between the nodes like human relationship. The social network is a simple and powerful concept in that it can find out types of interaction or connection of users or entities [9]. This aspect constitutes various social phases with familiar or chance subjects. Usually, social network can provide numerous points of advantages by reinforcing the connection between node and node or among network itself. From these ways, the social network concept has been applied in many fields, especially in information system and data analytics [10]. For instance, web-based social websites such as Facebook, Linked-in, and Twitter make efforts to provide specific and diverse social services by determining the relationships of users.
In the health care area, social network analysis helps researchers to understand each disease and human gene relationships based on overall disease-gene network structures [11, 12]. This aspect is important because it helps us to understand network structures of diseases and related associational human gene and identify the characteristics of the most influential human gene in the early phase of a disease. The structure of network can make accessibility of a lot of information related to disease-gene relationships available [13] and also increase performance for medical treatment and prevention of diseases by providing the primary causes of diseases. Particularly, social network analysis in diseases-gene networks could increase understanding for a sense of unity by many patterns and elevate the performances for their prevention [14].
2.3. Collaborative Filtering
Collaborative filtering (CF) is called a social information filtering technique because it generates the process of using relationship to decide whether item would link certain items [14–17]. CF is an algorithm used to study prediction and used primarily as a recommender system [18, 19]. We used collaborative filtering because this approach identifies genes related to particular diseases in the collected data.
Collaborative filtering recommends items based on the preference similarities of users in the preference or taste information of many other users [20–22]. According to characteristics of CF algorithms, this study tried to apply CF algorithm to the human gene network. SVD (singular vector decomposition for collaborative filtering) algorithm is matrix factorization models to solve collaborative filtering problem [23, 24]. SVD maps both users and items with a joint latent factor space of dimensionality. The latent space tries to find similar products or services by comparing users and product information (i.e., descriptions and features of products). SVD assumes that only a small number of factors can influence the preferences. Also, SVD assumes that preference of users on each item is determined by how each factor is related to the user and the item. This can be formulated as a MF problem. Namely, in a k-factor model, given the preference matrix (1) (2)
To find matrices U and M, SVD solves the following optimization problem using stochastic gradient descent:
where
3. Empirical Methodology and Results
3.1. Data Collection and Methodology
We collected human gene of Symantec type terms with disease names related to tobacco based on their cooccurrence in PubMed abstracts. For our raw data gathering we set the term tobacco as a query and collected 82,538 abstracts in XML [25, 26]. Using a Java program, we parse the abstracts and create a text file in a form of PubMed ID/Title/Journal/abstract/year. In the next step, we extracted the Bio Entity from the text file and made a MySQL Database in a form of Extracted Term/ULMS Symantec ST/CUI (UMLS's Unique Identifier Code) and preprocessed the list of diseases. To unify our terms, this study included CUI into the UMLS and corrected as a preferred term. Also, we matched the preferred terms to Gene Ontology and counted only when disease and genes cooccurred (disease-gene: count pair) and made an undirected network.
By doing research procedure, the network contained 479 disease nodes, 869 gene nodes, and 2195 edges. After obtaining the undirected network with weight we had to clarify the network. We used Pearson's correlation to change the heterogeneous network to homogenous network. The disease 2-mode network was changed into 1-mode network to test social network analysis. To find out the correlation among diseases, Pearson's correlation was conducted. The bigger the correlation score is, the higher the similarity between two diseases is. According to the evaluation of the results, this study used SNA (centrality, closeness, and PageRank centrality) and collaborative filtering, clustering PAM.
3.2. Results
Social network theory explains that central positions provide greater access to and control over information. Centrality of a node in a gene network determines the relative importance of the social power of node in the network. Usually, nodes of greater centrality are located in central positions of network visualization. The degree means nodes are directly connected to each other. In the disease-gene networks, “clique” is considered as every disease is directly tied to every gene. “Component” and “clique” are major measures for the cohesion of the network. However, because this study conducted relationships of disease-gene using referred social network measures as in Table 1 and Figure 1, we used centrality measures, not cohesion measures. Among those measures, we firstly tested degree for the network. A degree means the number of links which is connected to other nodes.
Degree centrality.
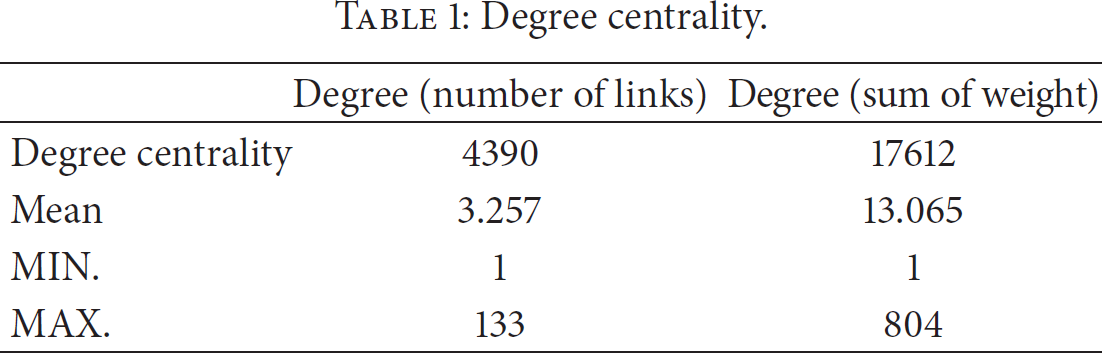

Degree centrality.
Closeness centrality is information related to the centrality of point in the network and that information can be measured by closeness or distance between each point in the network as shown in Figure 2 and Table 2. The distance between two points means the shortest distance of the connecting path of two points. The point that has low value of the sum of path distances is the central position of centrality in the network. According to result, the network closeness centralization index is 25.774%. Node betweenness centrality appeared similarly in the viewpoint of difference between two countries' clan networks. Betweenness centrality indicates the number of shortest paths between each node to others. This measure describes the connectivity of the node's neighbors. Thus, betweenness centrality generates higher central score when nodes connect node clusters in the entire network. The measure reflects the degree of the fact that each disease is connecting the related human genes. The network node betweenness centralization is 24.485%. PageRank centrality counts the number and quality of connections to a node to describe an estimate of how important the node is in the network. Options for this measure are as follows: the number of Iterations is 200 and Dampening Parameter was 0.85.
Centrality measures.

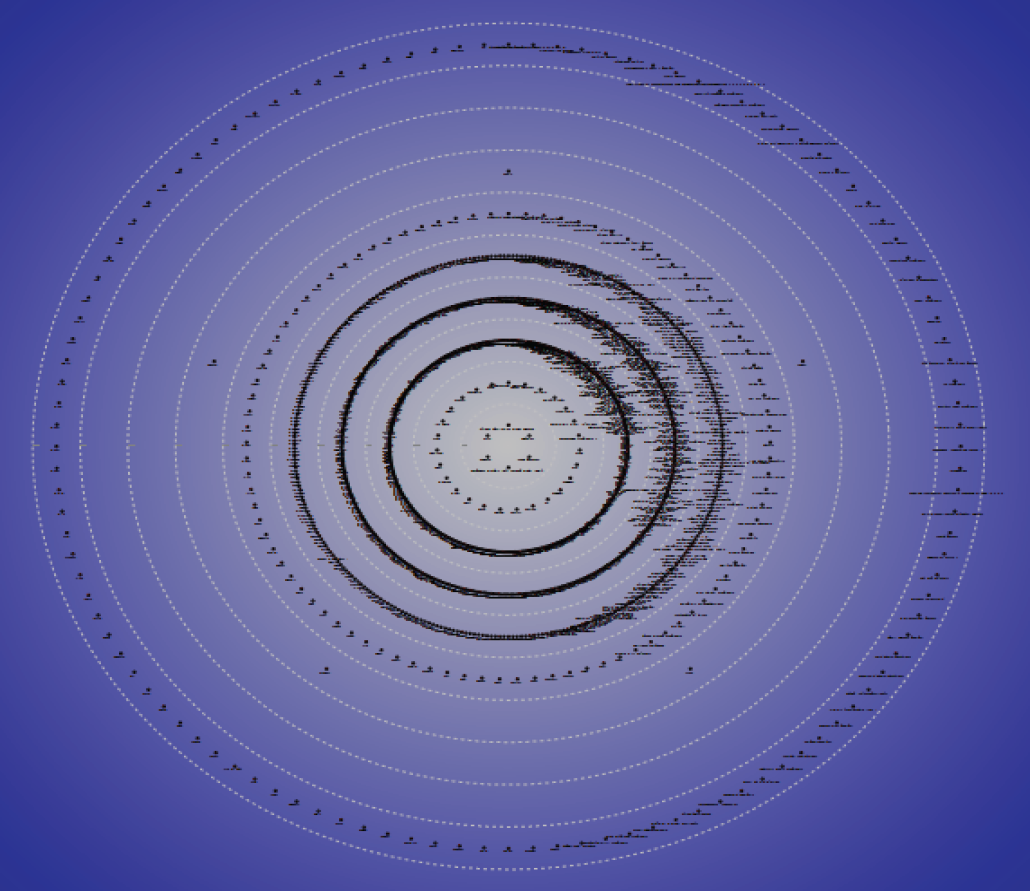
Closeness for disease-gene network.
As shown in Table 3, we compared our result with CDC (Centers for Disease Control and Prevention). In data analysis, many genes are related to cerebral palsy and lung diseases whereas lung and heart diseases are in high ranking in the CDC report. Thus, the correlation results among genes and diseases provided the important implications for which genes affect increasing the risk for some diseases.
Comparison result.

According to SNA result, this study compared the outcomes with actual diseases to evaluate performance for clustering results in this study by conducting clustering PAM (Partitioning Around Medoids) [26, 27]. Clustering refers to the process dividing the data set into some clusters. Clustering methods have two ways: partitioning and hierarchical. Partitional clustering is determining k-clusters make optimal cluster function based on Euclidean distance. With its specific, there are k-mean and k-medoids.
The k-means clustering describes vector quantization originally from signal processing and this method is popular for cluster analysis in data mining. k-means clustering classifies objects on a set of user selected characteristics [28, 29]. This results in a partitioning of the data space into shortest area from a point. Meanwhile, the k-medoids are used as a clustering algorithm related to the k-means and the medoidshift algorithm [14, 30, 31].
Both algorithms generate partitions through breaking data set up into each group and minimize the distance between all points and a point as a center of cluster [30]. In contrast to the k-means, k-medoids choose data points as centers and consider an arbitrary matrix for distances among data points [2].
The most common realization of k-medoids clustering is based on the Partitioning Around Medoids (PAM). PAM is considered to initialize clusters by randomly selecting k of the n data points as the medoids. Associate each data point to the closest medoid. k-medoids generate better performance than k-means as shown in Figure 3 at some situation. Figure 3 demonstrated that in the asymptotic of large-scale data sets the k-medoids take less time. In this study, we optioned the k-medoids as Symmetrize (method = “MAX”). Number of medoids (clusters) is 25, maximum number of swaps is 1000, and proximity is set as similarity. According to the result, sum of distances to the nearest medoid is 1,301.446. Average of distances to the nearest medoid is 2.717 and maximum of distances to the nearest medoids is 5.062.

k-medoids clustering.
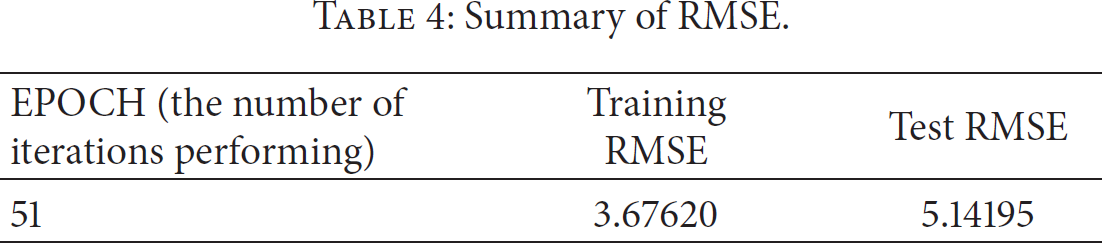
To test relationships for diseases-gene network as in Figure 4, this study used collaborative filtering. The number of features (rank) was 10 and the number of items to the recommendation was 10. If |the training error at i iteration − the training error at
Summary of RMSE.

Classical MDS Algorithm.

The results of RMSE.
4. Conclusion
The purpose of this study is analyzing and understanding the relationship between diseases-gene networks using various mining methods based on biofield research articles. To identify the research purpose, we collected 82,538 abstracts for research papers in PubMed, querying tobacco. After cleansing data set, we extracted 479 diseases nodes and 869 gene nodes. Also 2195 links were also extracted in the rule which same appearing in an abstract. Based on this information, we conducted social network analysis, clustering, and collaborative filtering.
With degree scores which were weighted as equally appearing in previous papers, we gave the order and compared diseases with CDC report. Using Pearson's coefficient, we also compared gene and disease network with closeness, betweenness, and PageRank centrality. Also, we evaluated how each gene was clustered with disease and recommend new genes related to diseases except for the relationships between disease and gene.
This study focused on the data set and its analysis with SNA and collaborative filtering. But the future study needs to find out more detailed knowledge for evaluating human genes with some experts. Also egonetwork analysis for disease related to tobacco still needs to be tested to see which gene factors affect the attack of a disease in the first stage of a disease.
Footnotes
Disclosure
This work was presented at ISBSS Conference 2014.
Conflict of Interests
The authors declare that there is no conflict of interests regarding the publication of this paper.
Acknowledgments
This research was supported by the Soonchunhyang University Research Fund. This work was supported by the National Research Foundation of Korea Grant funded by the Korean Government (NRF-2014S1A3A2044046).