
Abstract
The population growth, technological improvements, and the need for repairing old or installing new utilities result in a high demand for trenching and drilling activities. However, penetrating the subsurface incurs the risk of damaging existing underground facilities because they were not properly documented, if at all. Ground Penetrating Radar (GPR) constitutes a well-established technology that uses electromagnetic waves to identify objects underground by detecting their reflections. The work presented in this paper focuses on the timing and other characteristics of radar pulses reflected from the buried utilities. It is hypothesised that integrating the knowledge of construction practice, geophysical principles, and electromagnetic wave propagation behaviour in various soil conditions will improve the reliability and accuracy of GPR. This paper presents the results of field experiments that studied the effects of large void such as sinkholes or drainage pipes in several undergrounds. It provides important insights into the features and patterns that can be used to improve current methods.
1. Introduction
Urbanisation necessitated infrastructure facilities to be placed underground to protect them against damage by vehicles, vandalism (and pilfering), hurricane winds, ice, and other natural causes and also to maintain each city's “beauty.” This fact has reached to a point that nowadays “the urban underground has become a spider's web of utility lines” [1]. Urban underground usually contains myriads of objects such as electrical conduits, water, gas, and drainage pipes.
More recently, the underground facilities have been located based on utility records as well as information maintained by utility companies and supplemented by on-site trial investigation of “key holes.” In Australia, “Dial Before You Dig” is a free public service acting as the first and only point of contact to receive information about underground utility at any excavation site. Similar services are available in many countries, but the information provided by these services is usually inaccurate, incomplete, or out of date [2]. As a result, in most cases current utility maps are not precise enough to reliably locate underground utilities. Despite reduction in the number of accidents per unit length of buried utilities, growth of new utility developments exacerbates the number of utility cut incidents [3].
Different sensing technologies have been deployed to streamline real time utility locating [4]. For example, the GPR uses electromagnetic radiation to survey the world of underground. Electromagnetic reflections are then collected to discover targets or specify substantial changes in the media. GPR is widely used to “see through” the soil via many disciplines such as geology, archaeology, and tunnelling and to detect landmines. But, difficulties in data interpretation and operation complexity have limited its broad implementation [5, 6]. Maturity in sensing technology enables more efficient use of augmented reality [7] and Building Information Modeling (BIM) [8] in the built environment [9]. Virtual construction worksite [10] is an example of mingling sensing technology and management endeavor. While augmented reality offers the capacity to model process based on collected data, Wang [11] has discussed challenges for future applications. However, research is ongoing to expand the promising features of GPR by further understanding the reflection pattern and developing more efficient processing algorithms. Roth et al. [12] applied GPR to detect personnel mines and showed that depth of burial has a negligible effect on the accuracy of features extracted from GPR image. In another study, Allred et al. [13] demonstrated the negative effect of water content on GPR detection capability. Indeed, no reflection was recorded in their studies on pipes with diameters as small as 5 cm laying in saturated soil. Such a result was mainly attributed to the deconstructive effect of water in absorbing the electromagnetic waves.
Material is also reported as a key factor contributing to the successful detection. Concrete is durable, highly resistive (i.e., against corrosion), and versatile and hence it is the preferred material for larger pipes [14]. However, detecting some large concrete pipes by GPR may be very challenging. In this regard, pipe size, ranging from fractions of a meter to few meters, is another variable affecting the suitability of GPR for projects involving maintenance, rehabilitation, and replacement of aging sewers and drainage systems. Zeng and McMechan [15] reported that reflection features of large diameter pipes are significantly different from others. As expected, increasing the distance between the top and bottom of the pipe produces an increasing gap in the arrival times of the reflected pulses. Similarly, this study recorded flattened reflection hyperbola for larger pipes compared to results obtained from smaller pipes. In other words, the curvature of reflection decreases as pipe diameter increases and so large pipes can be considered underground cavities with regular boundaries.
Another phenomenon linked to the performance of the GPR in detecting large pipes is resonant scattering. An incident pulse may be entrapped within the boundary of an enclosed object as a result of sequential reflections. Accordingly, the trapped electromagnetic energy may resonate with the surrounding object. Resonant frequency of a closed object is determined based on object size and electrical properties of target material and surrounding media. Resonance occurs when the frequency of the wave is close to the resonant frequency of closed objects. However, the duration of resonance depends on the dissipation rate of the resonant energy which is dictated by the difference between the permittivity constant of the object and ambient material [16]. Permittivity is a constant of proportionality between electric displacement and electric field intensity. The research presented in this paper tries to integrate priori knowledge about pipe and underground environment to the algorithm that processes GPR data to locate large drainage pipes more efficiently. The following sections will describe how material properties and ambient conditions influence GPR scanning and then present the research framework applied in this study.
2. Materials and Methods
Characteristics of survey area significantly affect performance of the signals. GPR emits electromagnetic pulses and measures the return time of reflected signals. Electromagnetic emissions are waves of energy with a frequency falling within the electromagnetic spectrum. To investigate the effect of various parameters on GPR outcome, the theoretical foundation upon which GPR operates needs to be explained. Derived from Maxwell's equations, the well-known Helmholtz equations (1) explicitly describe the diffusion or wave propagation nature of a response of a medium to an electromagnetic input. For a magnetic field H and an electric field E, the Helmholtz equations are as follows:


Assuming (2), when the imaginary component of
Figure 1 shows a simplified GPR unit and data collecting system. A GPR consists of four core components: pulse generator, transmitter, receiver, and signal processor. The transmitter emits a short pulse of high-frequency electromagnetic radiation (10–1000 MHz) that is able to reveal the changes in electrical properties of the underground medium, specifically dielectric constant and electric conductivity throughout its path. Changes in electrical properties of the media could cause a reflection, refraction, or diffraction of the primary signal. The receiver collects the reflected signals and records them in a standard format, ready for further processing.

Schematic of GPR unit and Ultra Wide Band impulse.
2.1. Dielectric Constant
A signal's velocity has an inverse relationship with the dielectric constant of the media. The dielectric constant is the ratio of the permittivity of a material to the permittivity of vacuum [17]. According to the coulombs’ law of forces, the force between two charges
Dielectric constant of a medium depends on different parameters such as mineralogy, porosity, water saturation, natural frequency, lithology, geometries, and electromechanical interactions [17]. However, dielectric constant, especially in frequencies that most GPRs operate on, is mainly a function of three parameters: water content
In all GPR surveys, magnetic permeability, dielectric permittivity, and electrical conductivity of the medium affect the results. Buonanno et al. [18] mentioned permeability of obstacles as an important parameter controlling the resolution of radiofrequency imaging. On the other hand, dielectric constant and electric conductivity of the underground materials govern the signal's velocity and its attenuation. Indeed, the relationship between velocity and frequency changes at different conductivities. Davis and Annan [19], however, state that at conductivities under 100 mS/m velocity remains constant in frequencies from 10 to 1000 MHz which is the operating range of common GPR antennas. Furthermore, for frequencies from 400 to 800 MHz, no change in the velocity was measured in the conductivities from 100 to 1000 mS/s [19].
For many geological materials, the displacement (polarisation) properties dominate the conductive properties at high frequencies. In this case, either the dielectric constant or relative permittivity is the parameter used to describe the high frequency electrical properties of materials. Consequently, Lester and Bernold [20] conclude that the dielectric constant is enough to anticipate speed of electromagnetic waves.
On the other hand, velocity is highly dependent on the water content of the soil because high dielectric property of water (dielectric constant = 80) compared to that of dry rock and soil material (=3–8) controls the electrical properties of geological materials [21]. A brief review of Table 1 reveals that increase in water content causes reduced signal velocity. In fact, such variation in signal velocities makes detecting the depth of targets very challenging.
Electrical properties [19].

2.2. Reflection Pattern of Cylindrical Objects
Radiation from GPR antenna represents a conical shape similar to light illuminated by a study lamp. The higher electric constant results in slender cones while lower dielectric constant means widened footprint. Typically, dielectric permittivity increases in the overlaying layers of soil. As a result, the radar energy cone becomes narrower when radiation travels deeper. The footprint has direct relation with depth and is inversely correlated to dielectric constant. When a point object placed in depth “d” falls into the radiation cone, a reflection would be recorded. If the speed of radio waves is assumed to be constant in the host medium, then as explained in Figure 2 the travel time can be calculated as

Point object detection in GPR.

Pipe detection in GPR.
When GPR passes over an object (e.g., a pipe), the result of plotted travel time has a hyperbolic profile. This fact, which is known as a migration effect, makes the interpretation of the data very difficult. Migration effect is an expected result of approaching to a distinct object when some pulses reach the target and reflect back before GPR comes over that object. At the first step, the distance and travel time from the antenna to the target are long, while both of them are reducing up to a minimum, exactly above the target. Overall, the recorded pulses form an object that resembles a hyperbolic profile with a hill, which shows the exact position of the distinct object. However, as the sender and receiver are behind each other in the GPR antenna, symmetry is not recognisable in the raw GPR image.
2.3. Scanning over Inclined Surfaces
Consider the configuration demonstrated in Figure 4 in which the interface of two layers of homogeneous soil is in the following form:
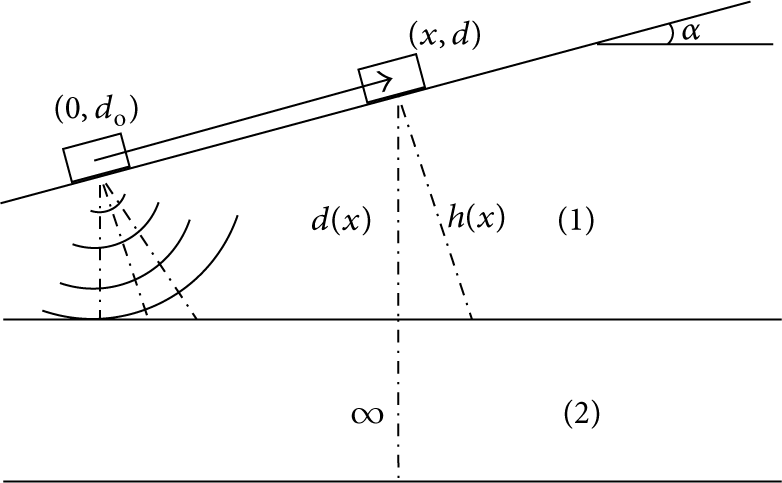
GPR sampling on an inclined surface.

Ideal radargram distinguishing two layers with the inclined top layer surface.
2.4. The Effect of Construction Activities on Soil Property
In construction, it is usual to excavate soil, make a trench, set up different kinds of utility pipes and communication cables in the trench, and finally backfill the trench. Moreover, in many cases, concrete ducts and manholes are built for maintenance reasons such as relocation and repair in the future. This process makes some changes in the underground environments; at least it loosens the soil after the backfill. The change in density alters dielectric constant of the medium that causes in different reflection pattern of the pulses. Figure 6(a) illustrates clearly the boundaries (walls) of a trench in a GPR surveying over a target pipe located in a channel. Figure 6(b) also demonstrates the density change in road surface, which in this case is asphalt and concrete.

Different reflection patterns caused by construction activities.
2.5. Ray-Based Modeling
A concrete pipe with an inner radius of a and an outer radius of b with the thickness of t resembles a perfect conducting circular cylinder with an infinite length and radius a coated with a homogeneous dielectric layer of thickness t. Wang [22] has derived the time harmonic solution for these conditions. Accordingly, the typical Watson transformation techniques can be applied to convert the Eigen functions proposed by Wang [22] to ray solutions. The ray solution for far-zone backscattered field is given in 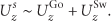

The most two important reflection modes causing noise in radargram.
In recent years, different research groups in both academic institutions and industry have worked on developing postprocessing methods with the aim of providing a user-friendly GPR data analysis procedure. To continue with these efforts, the present work attempts to promote the GPR analysis methods by proposing an innovative process using geophysics and construction information simultaneously. This work refers to many GPR measurements done in Sydney, Australia, in different areas including Eastern Suburbs and North Beaches by the research team.
2.6. Procedures for Data Collection and Data Analysis
The experiments commenced with pretests to appraise the efficiency of GPR for utility detection in sandy soils. Potential test-beds satisfying two main attributes were selected for pretests. Two requirements were access to the underground utility via manholes and availability of utility/services maps. In this approach precise information about size and depth of the pipes was obtained without disturbing the soil conditions. In total 30 surveys were conducted to evaluate the sensitivity of the sensor to the different operational settings. The best parameter setting attained in this stage was used in the main tests over a large concrete pipe at Freshwater Beach in Sydney's north shore. The significant features of selected pipe which made it important will be discussed later.
Figure 8 demonstrates fusion of data streams from different sources. Linking construction, geophysics, and GPR principles makes a powerful data analysis tool for interpretation of patterns in the images. On the other hand, patterns themselves provide worthwhile feedback about the analyses and can be used for data processing. Construction data provides useful information about utility types and the technologies used to bury them. Additionally, information about standard utility size and depth is available in construction resources and national standards. For example, while GPR helps to locate the exact position of a pipe, complementary information about pipe diameter can be extracted from construction sources.

Diagram of the proposed data processing method.
In the proposed method, signals’ velocity and dielectric constant have been calculated based on the water content
3. Results and Discussion
3.1. Evaluation of GPR Performance in Sand: Selected Pretests
Profiles 1 and 2 show GPR surveys over two pipes which were covered by dry sandy soil with a 30 cm concrete layer on top. The Sydney sand has the density of 1.5–1.7 (gr/cm3) (porosity of 0.43–0.36 or void ratio of 0.6–0.8).
Profile 1: GPR Radargram Created by a 380 mm Diameter Concrete Pipe. A preliminary draft of underground utility (Figure 9) was generated based on the service map of the area. Because of the access to the pipe, the sketch was double-checked with real world. Correspondingly, as summarised in Table 2, the wave speed and its time domain equivalent were calculated for each layer based on the mediums’ characteristic. This new piece of information helps to narrow down the search zone where the target is expected to be identified. As a result either the human or machine interpreter is able to ignore any prospected object outside the calculated layer. As shown in Figure 10, the pipe is detectable in specific equivalent depth of 8–11 nanoseconds.
Calculation for profile P1.

The 380 (mm) concrete pipe model.

Profile P1: (a) raw GPR data, (b) filtered (removed ringing noises) data.
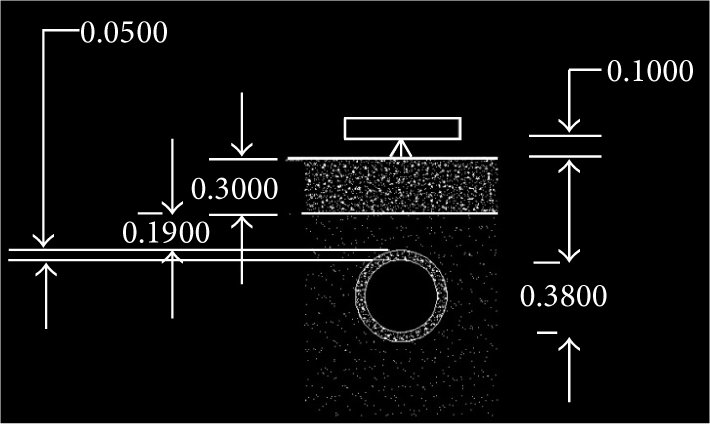
Profile 2: GPR Radargram Created by the Second 380 mm Diameter Concrete Pipe. Similar to Profile 1 velocity adoption is used to validate signal velocity in the sandy soil. The velocity adoption is a useful tool available in most GPR software which helps in calculating the signals velocity. Figure 11 shows how this tool is used to measure signal velocity at 0.15 (m/nsec) for this profile. This pipe was also detectable in specific time interval of approximately 8–11 nanoseconds. The promising results from the pretests showed that fusion of construction specific information and geophysics not only assures proper setting of the parameters for GPR antenna but also leads to a more efficient GPR data analysis.
Profile P2: (a) filtered GPR data, (b) velocity adoption tool in the software used to find the signal velocity.
3.2. GPR Features of a Large Drainage Pipe
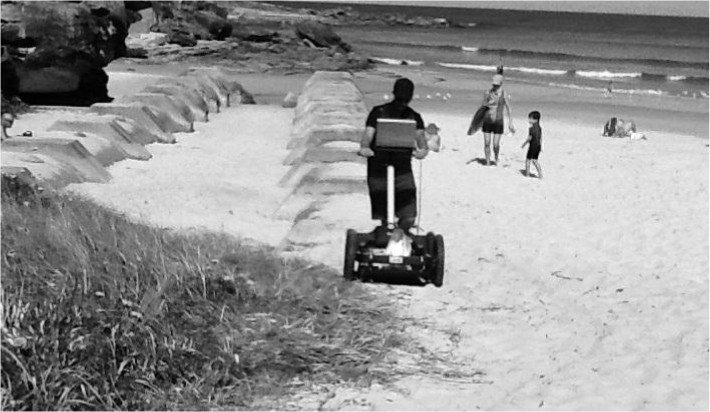
As expected, the GPR pulses reflected by a large diameter concrete pipe drastically differ from those created by small pipes. Figure 12 shows GPR surveys over a large concrete pipe at Freshwater Beach. This pipe was stabled on the earth horizontally while the thickness of the sand layer covering the pipe increased gradually. Measurements conducted at the exposed part of the pipe result in following data: the outside diameter of the pipe was 1860 mm; the stabilising collars on which the pipe was embedded had 400 mm thickness; the spaces between all concrete collars were 3600 mm, except for the last ones with 2400 mm distance.
Figure 13 demonstrates the raw GPR outcome of longitudinal scan along the centreline of the pipe. The top surface of the pipe is recognisable in the raw GPR radargram as a visible layer. Similarly, one can easily distinguish the stabilising collars in this radargram. The extra information about the distance between collars reduces number of false detection associated with noisy features created by hard objects inside the pipe such as hardened sludge or small rocks. Velocity adoption resulted in signal velocity of 0.11 m/ns for this set of experiments.
GPR along the concrete pipe at Freshwater Beach (profile P3).

Raw GPR for the profile P3.
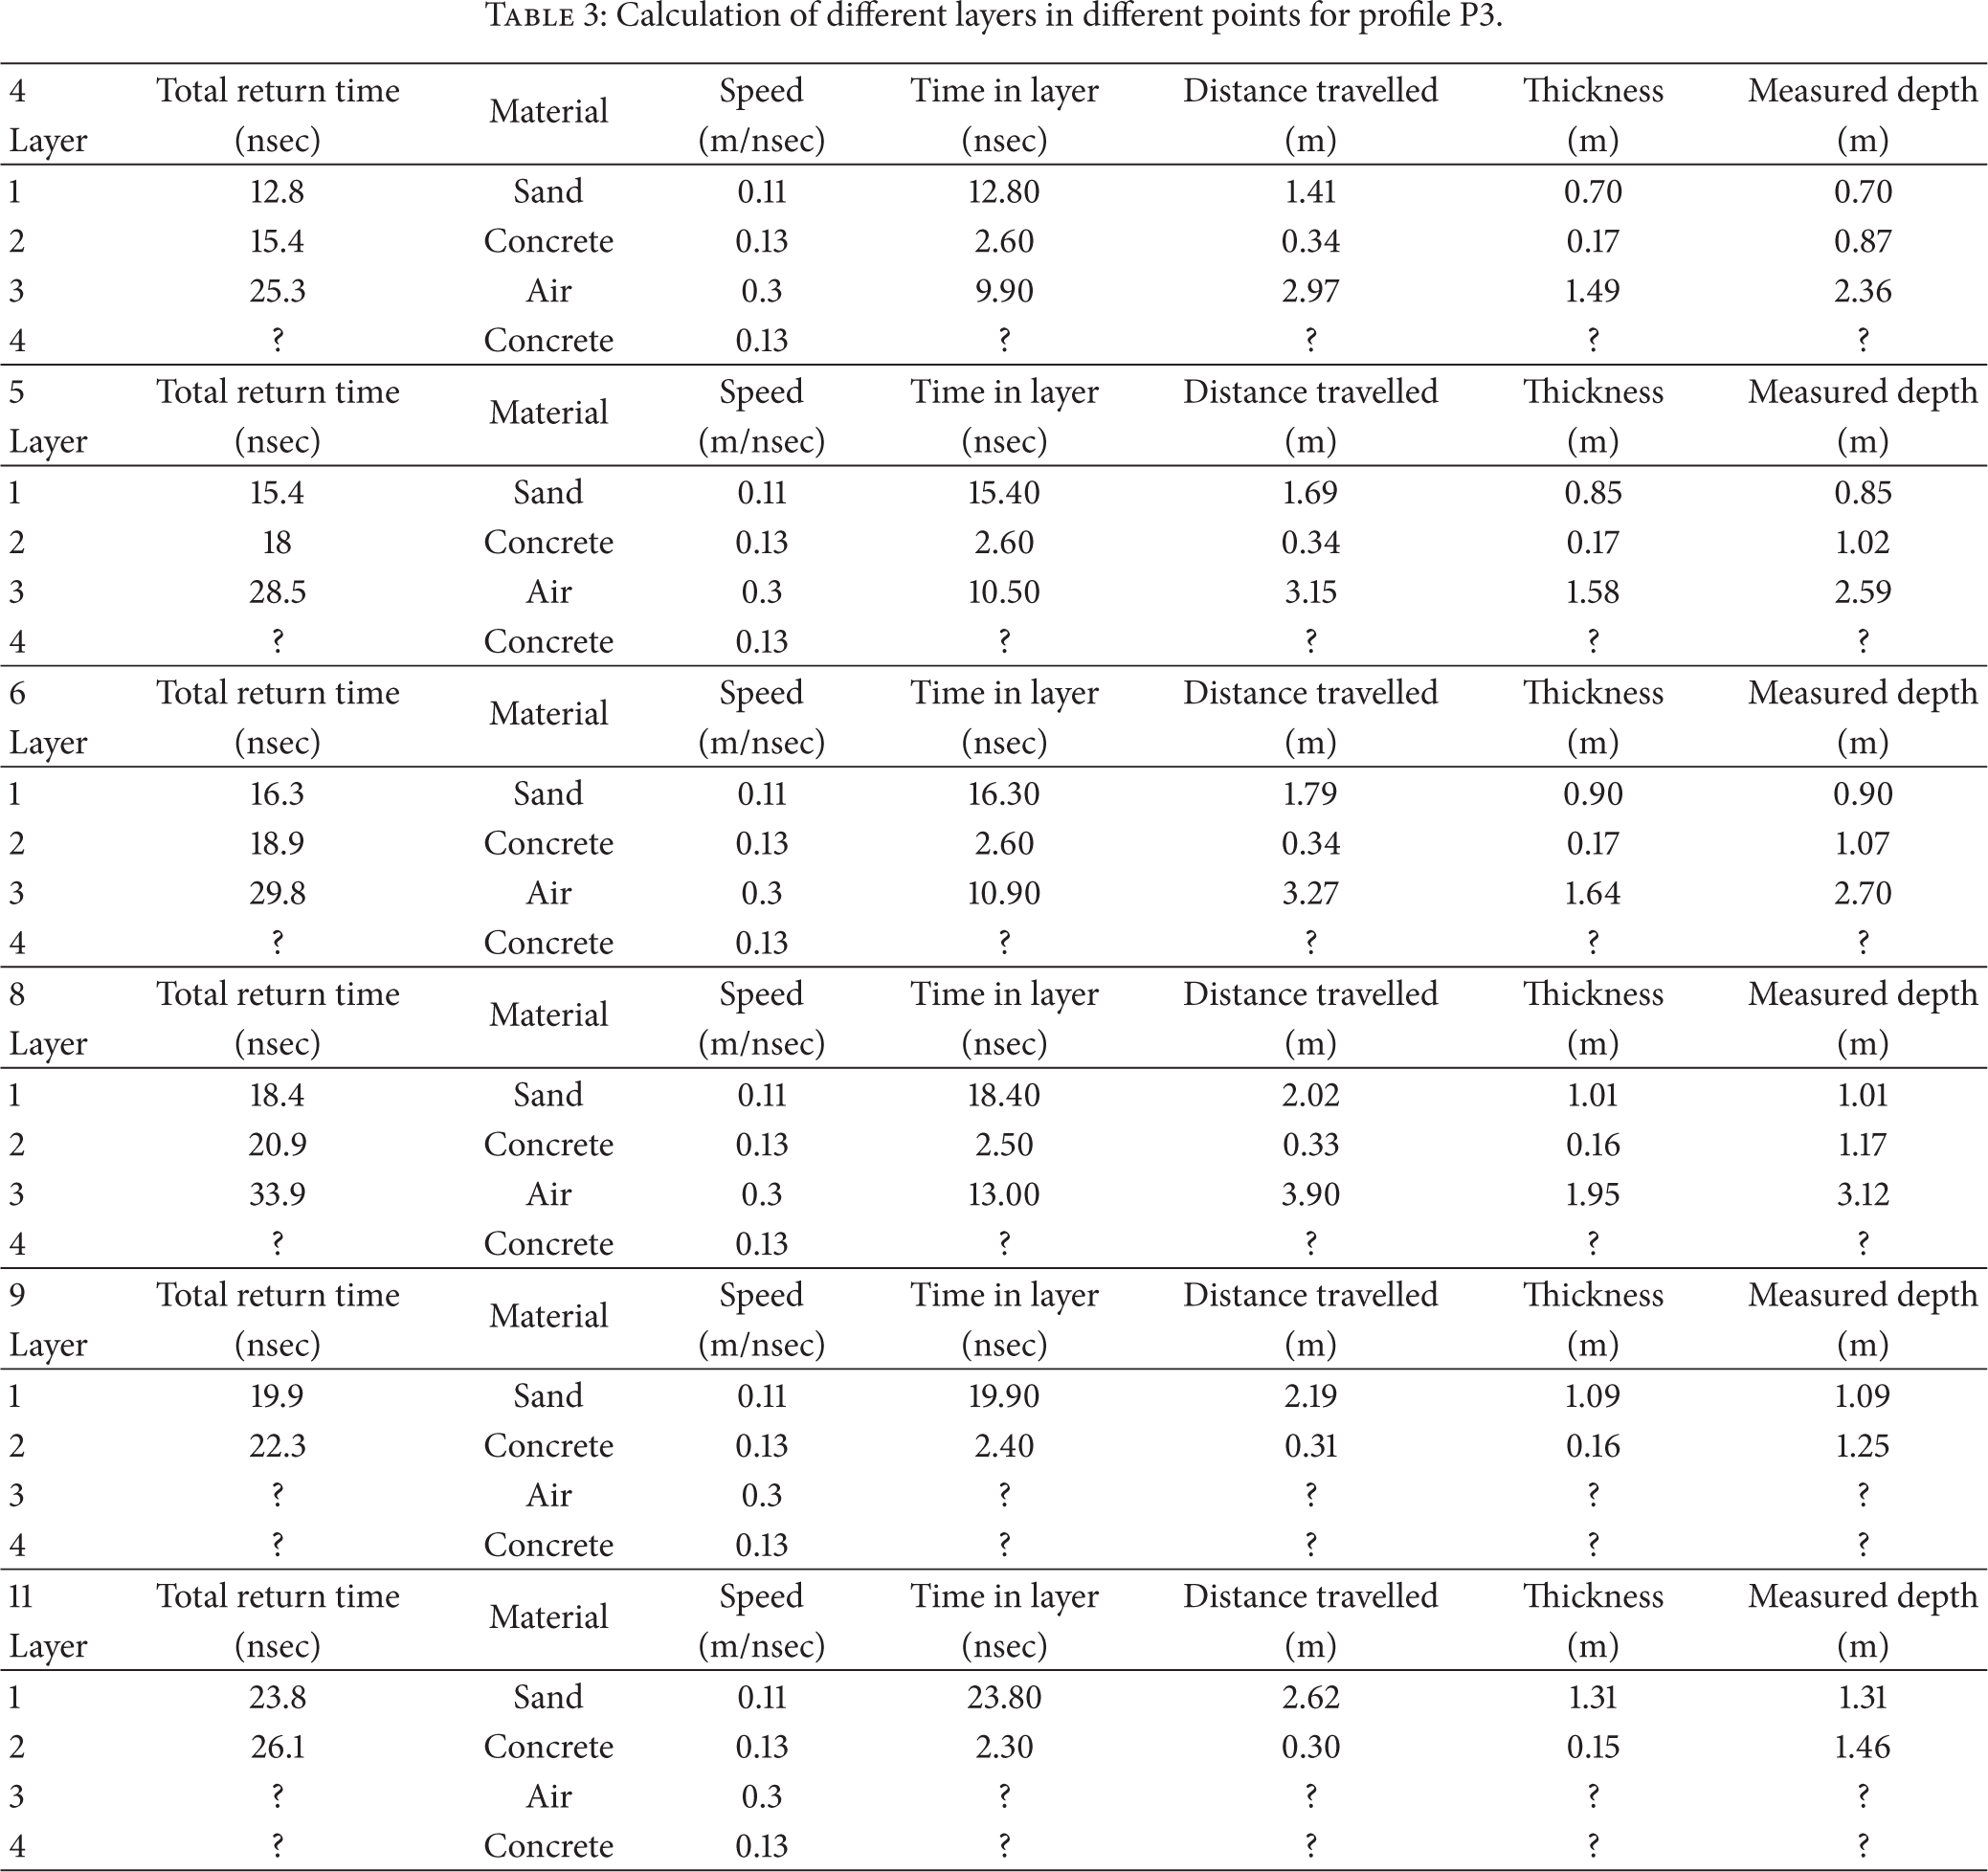
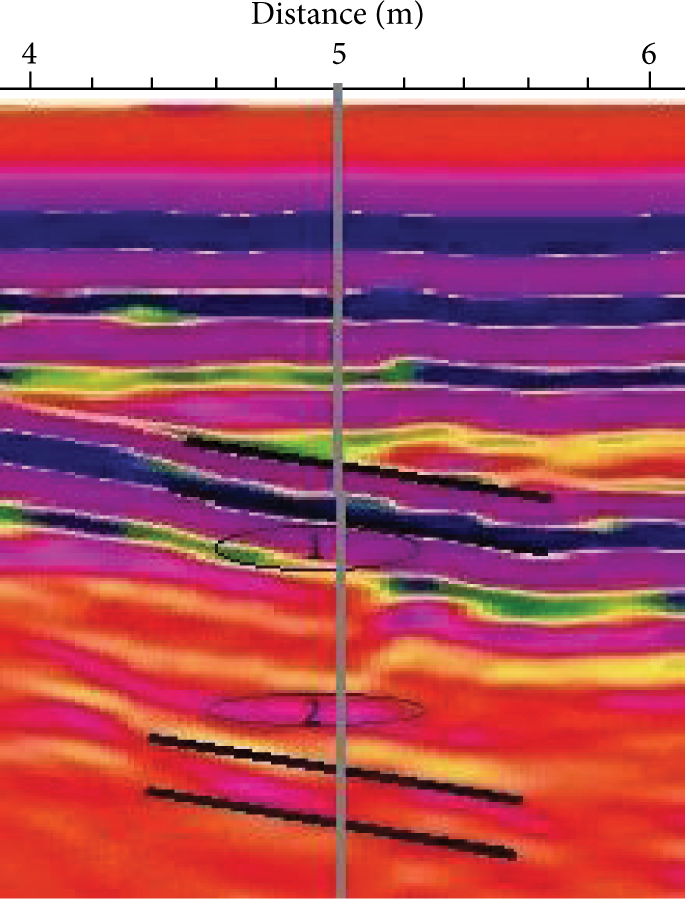
Figure 14 illustrates the rainbow vision of the raw GPR data for the profile P3 over the large pipe. Rainbow filter enables interpreter to distinguish different layers because it highlights changes in signals’ magnitude. Six thick bars are used to show the layer representing the top surface of the pipe. As demonstrated the intensity of the collected signals reduces with the depth. However, compared to the bottom line of the pipe the top layer is exclusively more visible. Three layers of sand, concrete, and air are evidently recognisable. Listed in Table 3 are the step-by-step results of matching the pipe thickness calculated by GPR in six different spots highlighted in Figure 14. According to this, the average calculated thickness in different spots is 160 mm, the internal diameter is 1660 mm, and so the outside diameter would be 1980 mm. Based on the national concrete pipe size standard, the target pipe should be a “60” concrete pipe, which has an internal diameter of 1524 mm and a thickness of 171 mm, giving the outside a diameter of 1866 mm. Consequently, the estimation of pipe size based on GPR data analysis using the proposed process has an accuracy of 89%. The ovals in Figure 14 show the bottom line of the pipe which is barely visible. This is mainly because
Calculation of different layers in different points for profile P3.

Rainbow vision of the raw GPR and studied spots for profile P3.
Specific patterns in GPR for profile P3.
The final practical product of the process is the estimated position of the buried pipe drawn in Figure 16. Linear regression was used to sketch the straight pipeline from the measured pipe depth.

(a) Concrete pipe depth from the ground surface for profile P3, (b) the target concrete pipe model.
4. Conclusion
Over the past 50 years, GPR has evolved as an effective nondestructive technology to locate underground utilities. However, due to the lack of effective data processing algorithm its use was limited to approximately locating objects rather than producing accurate outputs. This paper presents an innovative approach to enrich the processing procedure by integrating supplementary information acquired from construction guidelines as well as measuring soil properties. In this regard, the research team managed to carry out several GPR surveys in Sydney, Australia. We specifically focused on difficulties in detecting large voids such as drainage pipes. Field-testing of the multidimensional approach proposed in this study proved its effectiveness in interpretation of GPR surveys over large utility pipes. In general, the integrated approach resulted in enhanced readability of the processed GPR images. The main advantage of the data fusion was to concentrate on predefined zones to look for an object instead of analysing whole data set. Consequently, the shrunk search area significantly reduced the computational effort but at the same time led to more accurate outcome.
The signal velocity can be easily calculated based on the water content, density, and mineralogy of the medium. For common urban utility localisations, velocity adoption function, available in some GPR analysis software, can be used with acceptable accuracy to measure velocity. This makes the soil characteristics analysis more efficient in terms of time, effort, and expense. Then, linking construction, geophysics, and GPR principles makes a powerful data analysis tool for the interpretation of patterns in the radargrams. The new data analysis method was successfully tested to calculate and predict the depth and size of large utility pipes in the sandy soil. Many factors affecting the resolution of the results were carefully studied in this work. The important factors were (a) variable thickness of soil layers above the object, (b) material and size of pipe, and (c) water content of the medium. This work provides the basis for developing a real time, stand-off surveying, and data-matching mechanism enabling dynamic subterranean mapping in the near future.
Footnotes
Conflict of Interests
The authors declare that there is no conflict of interests regarding the publication of this paper.