
Abstract
This paper proposes a wireless multisensory toxic gas detection system. The system allows remote wireless detection of four types of toxic gases, specifically Cl2, CO, NO2, and SO2, using gas detection technologies and wireless communication technologies such as ZigBee and Wi-Fi. Further, we analyze the data collected from sensors to determine a correspondence between the sensors and the gases and establish recognition models for different gases. Through multiple data calibration levels and industrial experiments, we have verified the feasibility of the system, along with its gas detection accuracy and long-term stability.
1. Introduction
With the rapid development of industrial production in China, unique physical and chemical characteristics of gases have been widely used in the process of chemical production, such as food preservation, frozen food, inflatable packaging, special fuel production, hyperbaric oxygen therapy, and human organ refrigeration [1, 2]. It can be observed that gases occupy a very important position in both human life and the nation's economy [3]. However, the wide usage of gases will inevitably lead to toxic gas leakage problems [4–6]. The personnel cannot directly enter the site to complete measurement tasks in an actual industrial field having a toxic gas environment, and to ensure safety of the enterprise production and personnel, use of a wireless detection device, if available, will be of great significance [7, 8]. Therefore, development of a wireless detection system that can detect various types of toxic gases is of prime importance [9–11].
Earlier toxic gas detection systems usually use a wired network to transmit information, resulting in a complex network rollout, limited monitoring area, poor portability, and higher human resource investment [12]. Detection systems with fixed placement cannot accurately detect the exact location of the toxic gas leakage. Moreover, improving this accuracy requires multiple terminal equipment, which drives the overall system cost to a much higher level [13]. This paper proposes a multisensory wireless toxic gas detection system based on the actual situation of industrial field. It allows remote wireless detection of four types of toxic gases, specifically Cl2, CO, NO2, and SO2, using gas detection technologies and wireless communication technologies such as ZigBee and Wi-Fi. The personnel can remotely monitor the situation and avoid going into the dangerous industrial field [14–16]. Finally, the system passes several data calibration levels and tests in simulated industrial environment, wherein it is proved that it has high system acquisition accuracy, reliable data transmission, and stable operation control center. Being able to complete detection tasks in harsh and hazardous environments, the system makes up for the shortcomings of previous detection methods and enables remote wireless intelligent detection of toxic gases [17, 18].
2. System Overall Design and Method of Gases Recognition
2.1. System Overall Design
The detection system consists of testing equipment, information relay stations, and the control center. The main function of the system is to collect information on four types of toxic gases (Cl2, CO, NO2, and SO2), environmental temperature, and humidity in industrial sites through multisensor modules, integrate all information through microprocessor STM32F107VCT6, and transmit the information to the control center using ZigBee transmission module, while controlling the movement of detection equipment. The movement of detection equipment is controlled according to specific instructions to achieve road obstacle avoidance and gas source search. These instructions are generated by the control center using an additional input of a real-time picture of the industrial site that it obtains through a video transmitted by a multidirectionally rotatable Wi-Fi camera. The information relay station is divided into ZigBee data relay stations and Wi-Fi video relay stations. The main function of data relay station is to transition the information collected from detection equipment to the control center and the instructions from control center to the detection system. The main function of video relay station is transmitting the video captured by the camera to the control center and transmitting the information on rotation of the camera from control center to the detection equipment. Information on the toxic gases and the field of real-time screen can be seen intuitively and clearly through the control center, and the detection equipment can be controlled according to the actual movement and rotation of the camera. The overall block diagram of the system and actual pictures are shown in Figures 1 and 2.
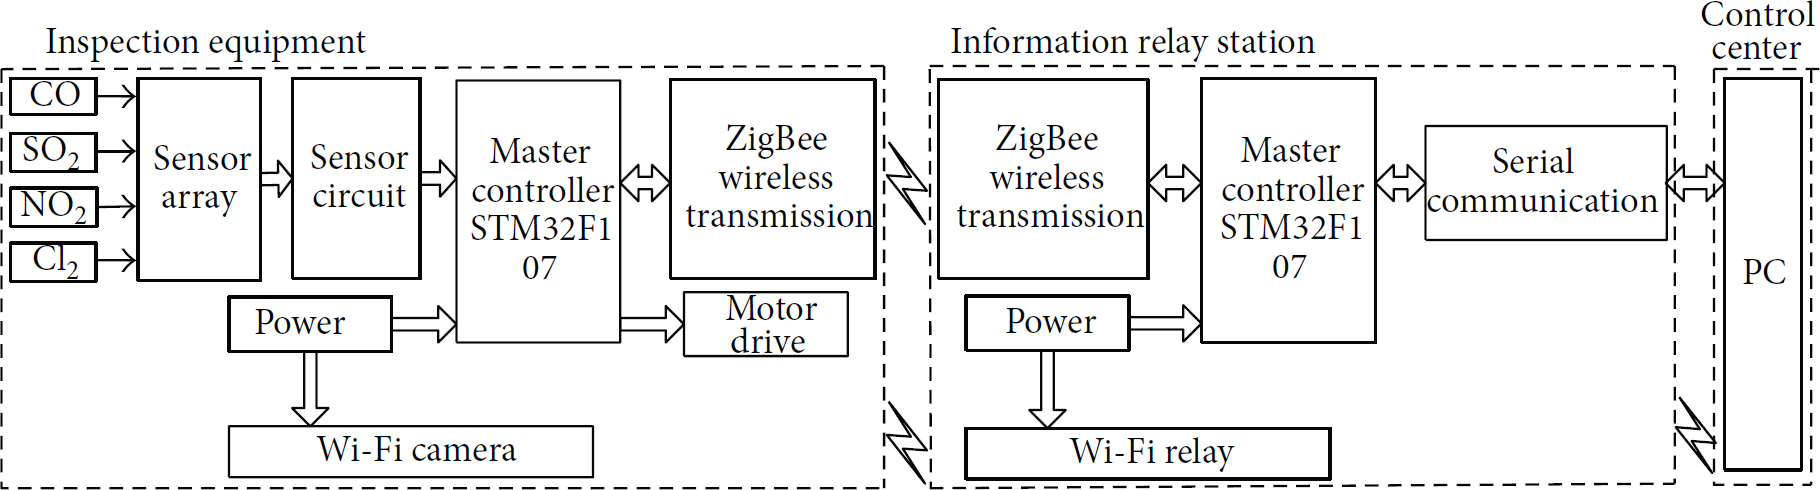
The overall block diagram of the system.

The physical map of the system.
2.2. Method of Gas Recognition
When the four-way gas sensor of the detection equipment is exposed to toxic gases in an industrial site, it first determines if the gas is an oxidizing gas or a reducing gas; this is termed as qualitative identification. If the gas is recognized as an oxidizing gas, sensitivity analysis of the collected data from the two front-oxidizing gas sensors aids in determining if the test gas is Cl2 or NO. If the sensitivity analysis finds that Cl2 sensor is more sensitive, then we enter preset Cl2 quantitative identification model to get the accurate gas concentration (Figure 3).

Toxic gases recognition process.
3. System Hardware and Software Design
3.1. System Hardware Circuit Design
3.1.1. Sensor Module Design
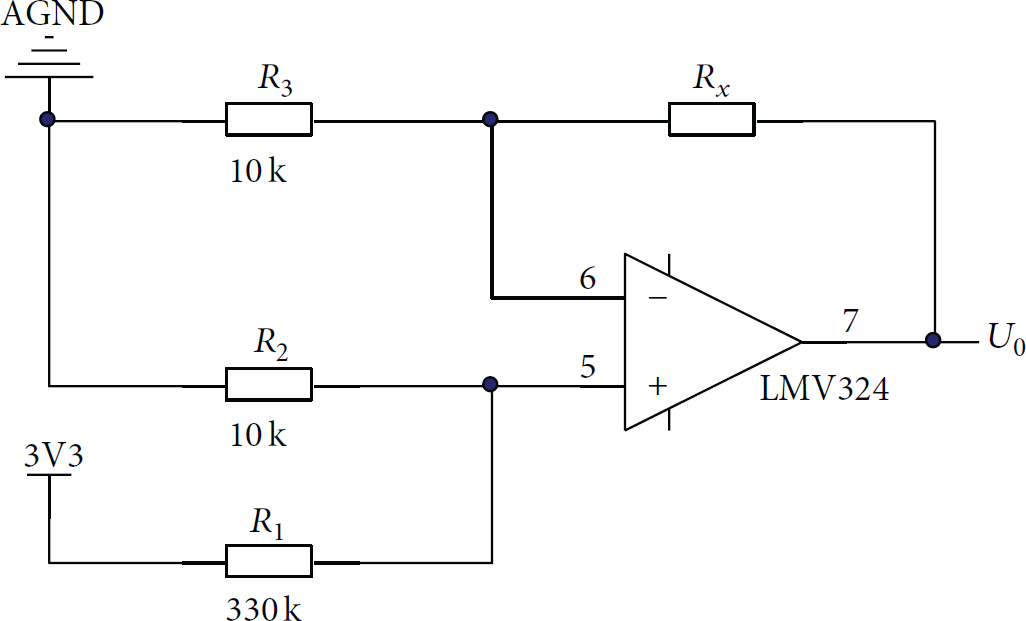
For toxic gas sensor circuit design, because the four toxic gas sensors are resistive and resistance range is 10 K to 300 K Ω, they can have the same transmission circuit, as shown in Figure 4.

Toxic gas information acquisition circuit diagram.
The voltage acquisition range of the microcontroller selected in this paper is 0 to 3.3 V, with integration of the resistance range of the gas sensor, to enable

The physical map of sensor switching module and transmitter circuits.
The paper selects AM2301 sensor for acquisition of temperature and humidity information in context of the circuit design for temperature and humidity sensor. The primary reason for this is the digital nature of the sensor output and the fact that the data communication with single chip microcomputer is through a single bus mode.
3.1.2. Communication Module Circuit Design
In order to avoid interference of data and video information during transmission, this paper uses ZigBee to transmit data and uses Wi-Fi to transmit video information [19, 20].
(1) ZigBee Data Transmission Circuit Design. This paper selects SZ05-ADV series of Shun Zhou Technology as an important tool for data transmission. The module has three data interfaces: RS232, RS485, and TTL. TTL data interface is used in this circuit to allow the sending end and the receiving end of SZ05 to be directly connected with the single chip microcomputer, shown in Figure 6. In the diagram,
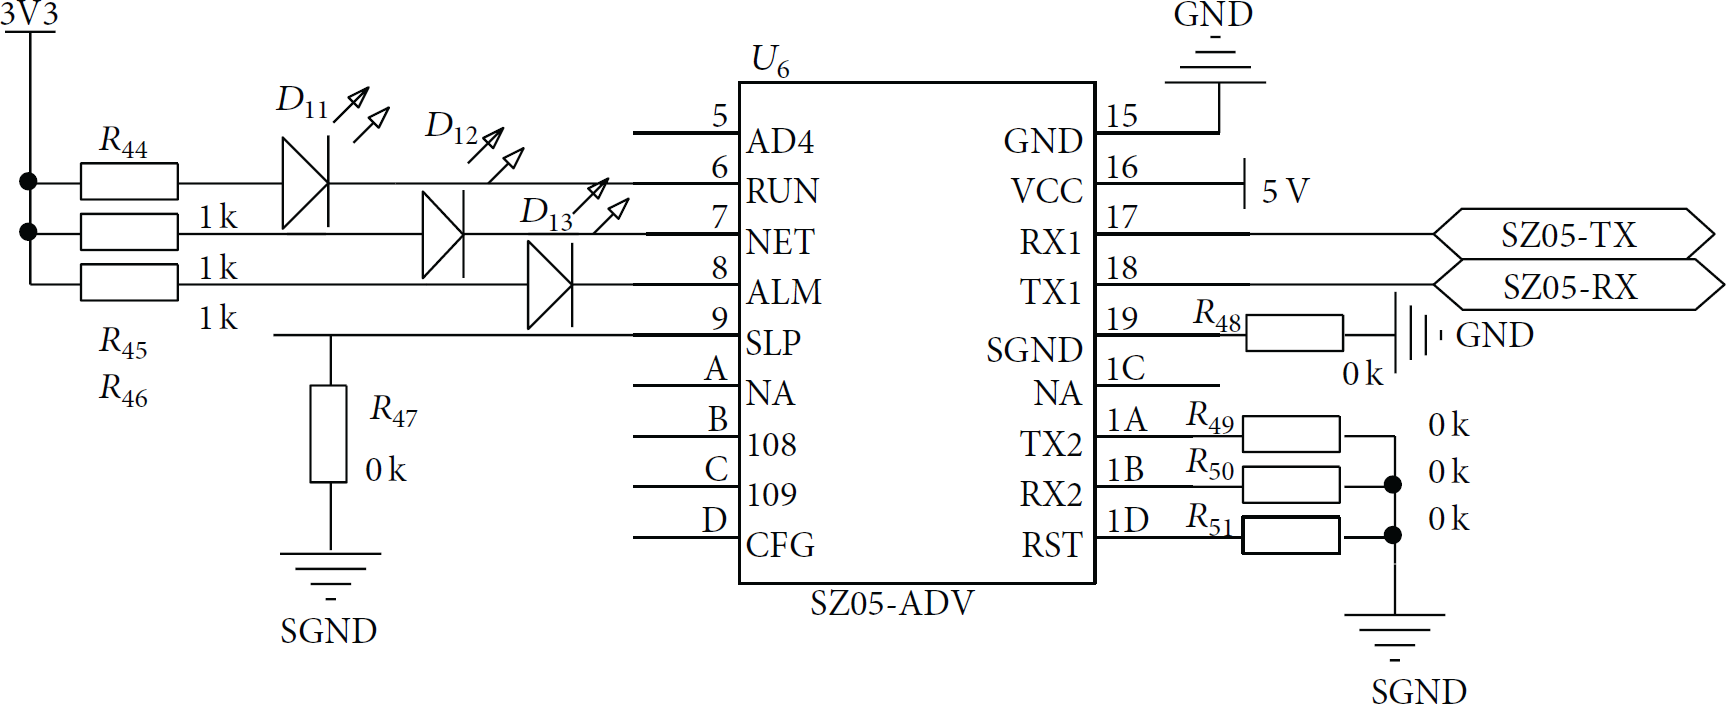
ZigBee communication module circuit diagram.
(2) Wi-Fi Video Transmission Circuit Design. This paper selects Kai Cong Sip1018 as a Wi-Fi video transmission module and selects three lithium batteries in series as the initial voltage power supply for the Kai Cong Wi-Fi camera. Because the series voltage is too large, this paper designs a DC/DC voltage conversion circuit, as shown in Figure 7.

Wi-Fi camera power circuit diagram.
(3) Serial Data Transmission Circuit Design. Wired data communication primarily includes two communication modes, serial communication and parallel communication. An advantage of parallel communication is speed, but it uses multiple pins of the microcontroller. Although the transmission speed of serial communication is slow, it can reduce the use of chip pins. In this paper, data transmission between the relay station and the control center is carried out by using serial communication. This transmission mode can support up to 20 kbps transmission speed and provide high reliability in short-haul communication to meet the requirements of system design. In addition, it is simple to operate and shortens the development time of the entire system. Serial data transmission circuit is shown in Figure 8.

Serial data transmission circuit diagram.
3.1.3. Motor Drive Circuit Design
L298 can be selected as the core chip of the motor drive circuit in this paper. It controls the input ports including ENA, ENB, IN1, IN2, IN3, and IN4. ENA and ENB are responsible for enabling different motors, whereas IN1 and IN2 control the steering wheel motor and reversing. The output ports OUT1 and OUT2 of motor drive circuit are attached to the positive and negative of the steering wheel, while the ports OUT3 and OUT4 are connected to the positive and negative of power motor. L298 chip control table is shown in Table 1; x in the table represents a variable state.
L298 control.
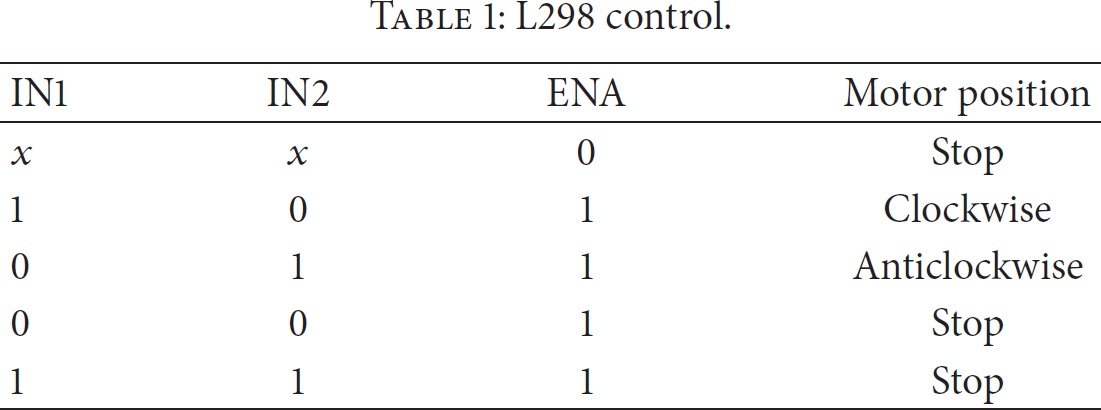
Detecting equipment motor control circuit is shown in Figure 9. There are two power standards of L298, respectively, 3.3 V and 5 V; 3.3 V is logic level of the motor, and 5 V is the power level of the motor. Ports ENA and ENB of L298 chip directly connect to the 3.3 V power supply of the single chip microcomputer to ensure the steering motor and the power motor are both enabled at all times. The four I/O ports of the single chip microcomputer are connected to
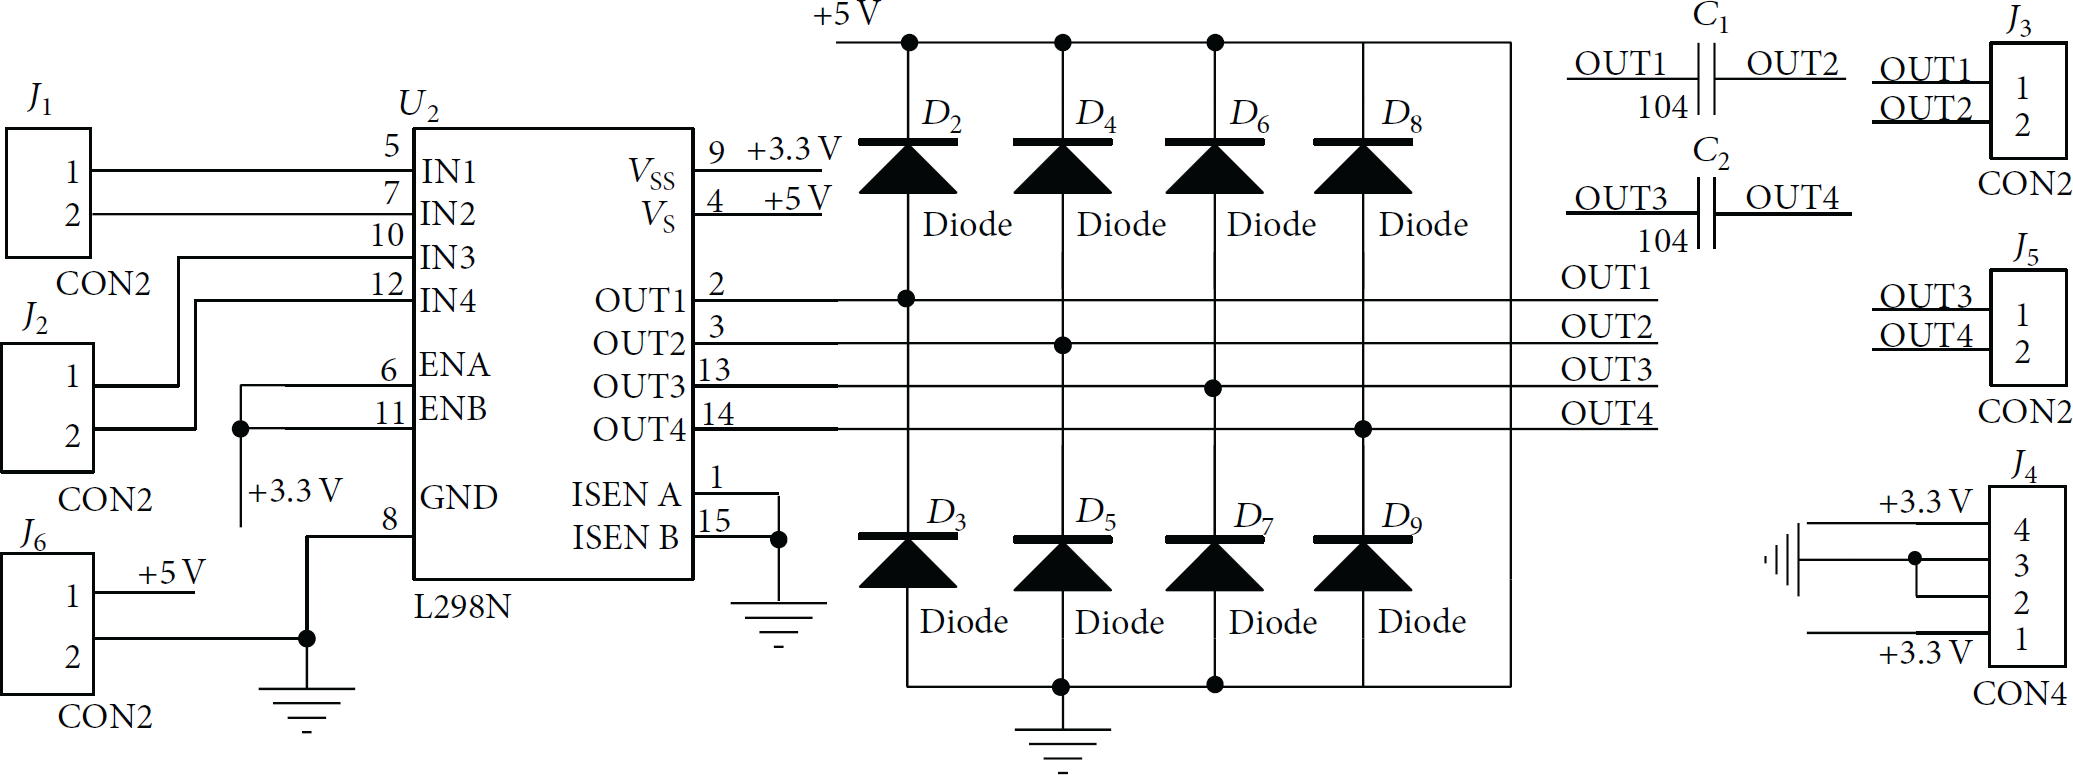
Motor control circuit diagram.
3.2. System Software Design
The software design of this system mainly includes the designing software for detecting equipment, information relay station, and the host computer control center. An important component of this paper is quantitative recognition of four types of toxic gases. A flow chart of this recognition process is shown in Figure 10.

The flow diagram of toxic gas identification.
3.2.1. Detecting Equipment Software Design
The main function of the detecting equipment software is to integrate the information collected from the front-end of toxic gas sensor and the temperature and humidity sensor and transmit it to the control center through the ZigBee wireless transmission module. It also needs to avoid obstacles and search for toxic gas sources during its operation. The overall flow chart of the detecting equipment is shown in Figure 11.
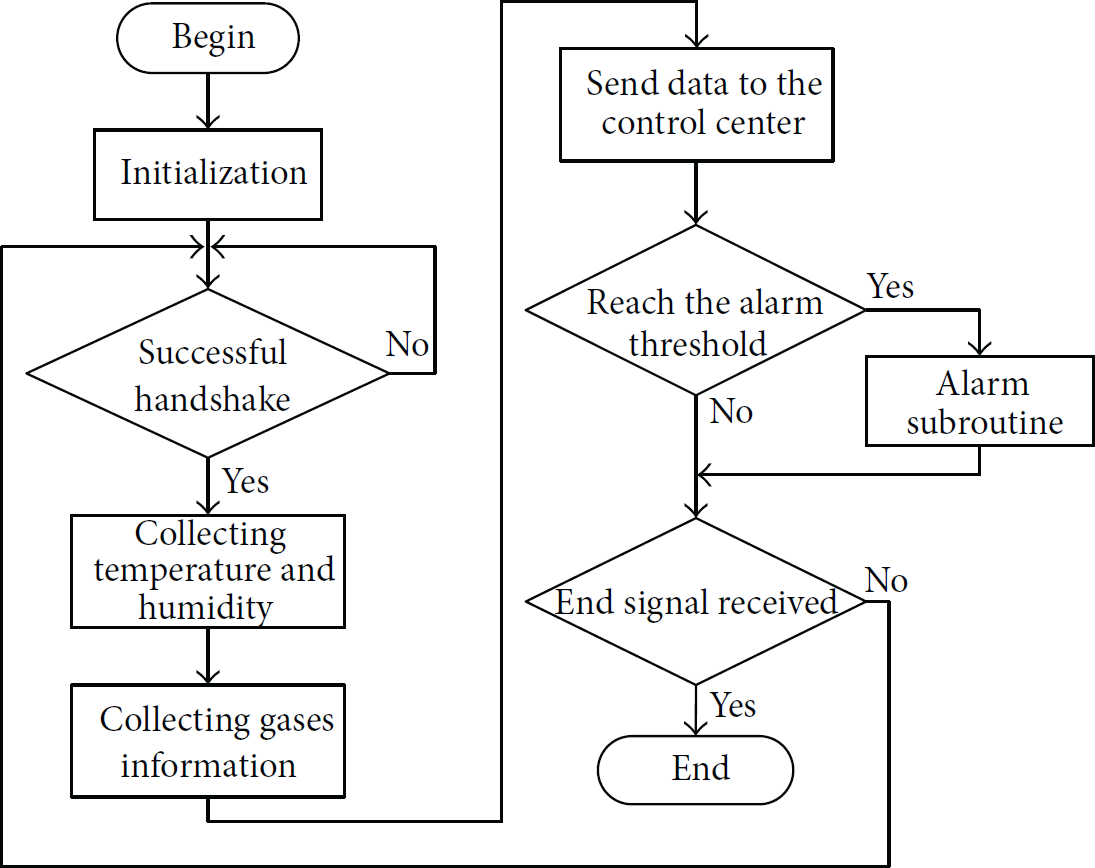
The flow diagram of inspection equipment.
Detecting equipment software can be segmented into several parts, including a subroutine for processing and handling data on four types of toxic gases, a subroutine for collection and processing of temperature and humidity data, and a subroutine for obstacle avoidance.
(1) Subroutine for Processing and Handling Data on Four Types of Toxic Gases. This section collects a large amount of data and then collects information on four types of toxic gases (Cl2, CO, NO2, and SO2) by using the bubble sort method. The program flow chart is shown in Figure 12. This part mainly uses the A/D acquisition module of the microprocessor and adopts digital filtering to improve the stability of the data acquisition effectively.
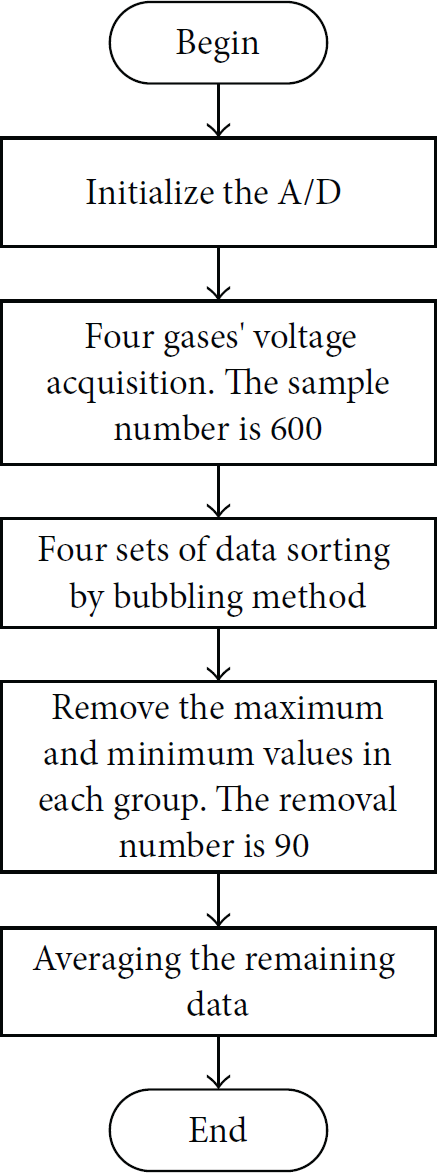
The flow diagram of toxic gas data acquisition.
(2) Temperature and Humidity Data Acquisition and Processing Subroutine. Temperature and humidity sensor data acquisition module adopts a communication mode based on a single bus system. The I/O port is used to send the instructions to the sensors and collect the sensor readings. The program flow chart is shown in Figure 13.

The flow diagram of temperature and humidity data acquisition.
(3) Obstacle Avoidance Subroutine. The equipment uses video information from the Wi-Fi camera as feedback to avoid obstacle and search for gas sources. Therefore, detection equipment must communicate with the control center. The software flow chart is shown in Figure 14.

The flow diagram of car driving.
3.2.2. Information Relay Station Software Design
ZigBee relay station software design: ZigBee relay mainly performs the function of sending the information collected by the detecting equipment to the control center and the instructions from the control center to the detecting equipment. The design procedure of the ZigBee relay station is shown in Figure 15.
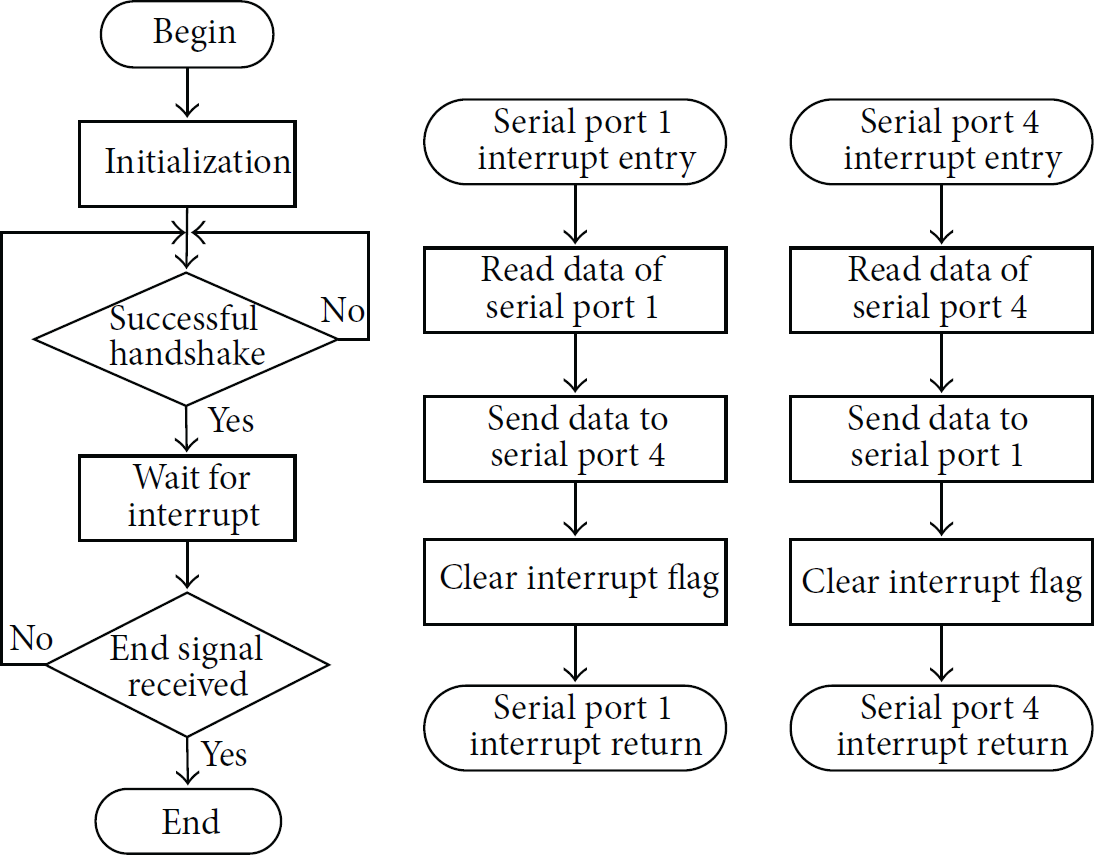
The flow diagram of ZigBee relay station.
3.2.3. The Control Center Software Design
Our work designs the host computer software of the control center according to the requirements of the toxic gas wireless detection system software design in order to facilitate control of wireless detection system by the personnel in the control center. The flow chart is shown in Figure 16.

The flow diagram of PC software.
The operator can obtain real-time video interfaces and draw the real-time data curve with the data acquisition function automatically. Finally, we analyze the gas concentration according to the prepared calculation formula to get the information of the toxic gas.
4. Data Analysis and Processing of Toxic Gas
In the toxic gas sensors used by the wireless detection system, the sensor resistance increases on exposure to oxidizing gases and decreases on exposure to reducing gases. Based on this feature, we confirm detection target of every sensor through data analysis and processing procedure and then handle the data by the method of quadratic fit to confirm the quantitative identification function of gases.
4.1. Data Analysis and Processing of the Oxidizing Toxic Gas Cl2
By piping in 40 ppm, 20 ppm, 10 ppm, 5 ppm, and 2.5 ppm Cl2, it can be observed that the value of resistance of Number 1 and Number 3 sensor has increased on exposure to oxidizing toxic gas, and the gradient of the value of resistance progressively decreases with the decrease in the concentration of the gas. The gas sensitive property of Cl2 is shown in Figure 17.
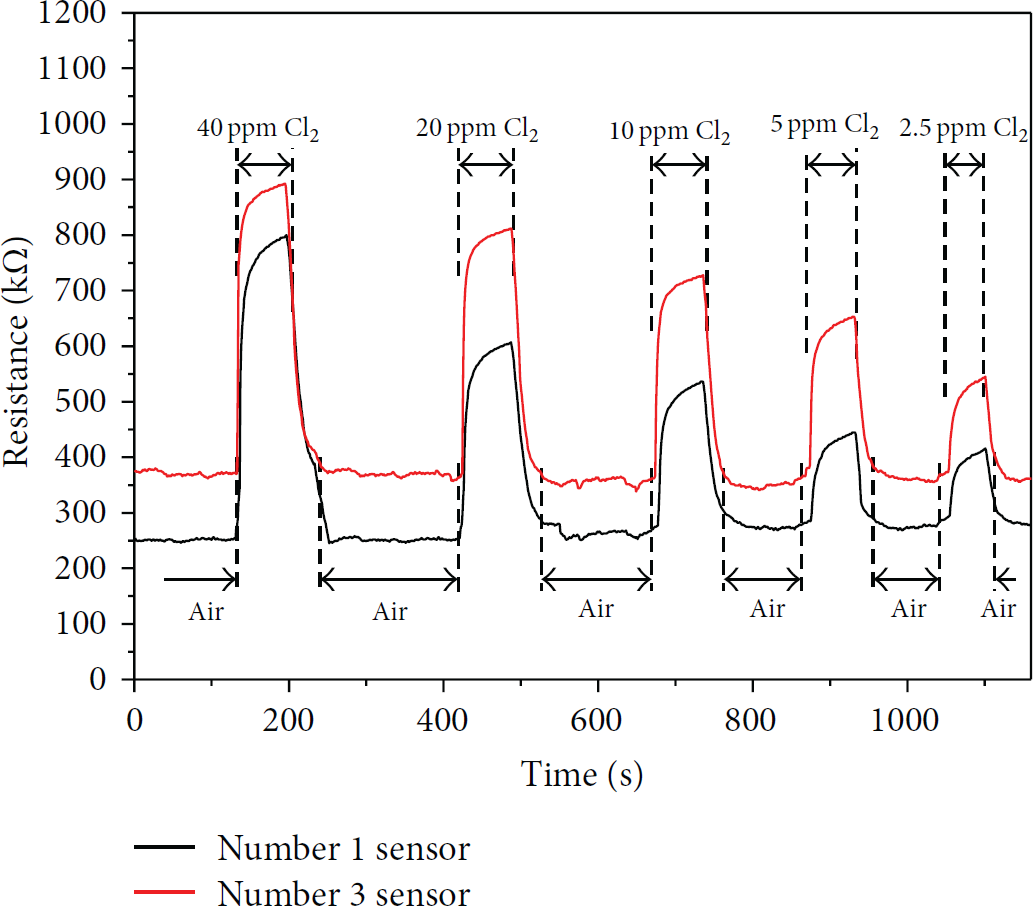
The response curve of Cl2 gas sensing.
The sensitivity analyses of different sensors to Cl2 are shown in Table 2; the gradient of the value of resistance is the ratio of the differential value when the sensor is exposed to toxic gas and in the air to the value of resistance of that sensor in air.
Different sensor sensitivity analysis on Cl2.

It can be seen in Table 2 that the gradient of value of resistance decreases with reduction in the concentration of gas. The gradient of Number 1 sensor is bigger than Number 3 sensor in any concentration of gas; thus, Number 1 sensor can be chosen as the recognizing front-end of Cl2. Based on the sensitivity analysis to the concentration of Cl2 of Number 1 sensor, we use MATLAB to fit the curve of the concentration of Cl2 that changes with the resistance gradient, as shown in Figure 18. The result confirms the quantitative identification function of the concentration of Cl2 of Number 1 sensor, shown as follows:


Cl2 concentration curve fitting with the rate of change of resistance.
The gas sensitive property of Cl2 of Number 1 sensor is shown in Figure 18; the response time of sensor is 90% of the time required for the sensor to be exposed to Cl2 and generate a stable change value under a certain gas concentration. The recovery time is 10% of the time required for the sensor to start to break away from Cl2 to reach the change value that it has in normal air. Figure 19 shows that the response time of Number 1 sensor to Cl2 is 20 s, and the recovery time is 35 s.

Cl2 gas sensing characteristics of the Number 1 sensor.
4.2. Data Analysis and Processing of the Oxidizing Toxic Gas NO2
By piping in 25 ppm, 20 ppm, 15 ppm, 10 ppm, and 5 ppm NO2, respectively, we find that the value of resistance of Number 1 and Number 3 sensor increases on exposure to oxidizing toxic gas, and the gradient of the value of resistance progressively decreases with the decrease in the concentration of gas. The gas sensitive property of NO2 is shown in Figure 20. The sensitivity analysis of different sensors to NO2 is shown in Table 3.
Different sensor sensitivity analysis on NO2.


The response curve of NO2 gas sensing.
It can be seen in Table 3 that the gradient of the value of resistance decreases with the reduction in the concentration of gas. The gradient of Number 3 sensor is bigger than Number 1 sensor in any concentration of gas; thus, Number 3 sensor is the recognizing front-end of NO2.
Based on the sensitivity analysis to the concentration of NO2 of Number 3 sensor, we use MATLAB to fit the curve of the concentration of NO2 that changes with the resistance gradient, shown in Figure 21. The result confirms the quantitative identification function of the concentration of NO2 of Number 3 sensor, shown as follows:

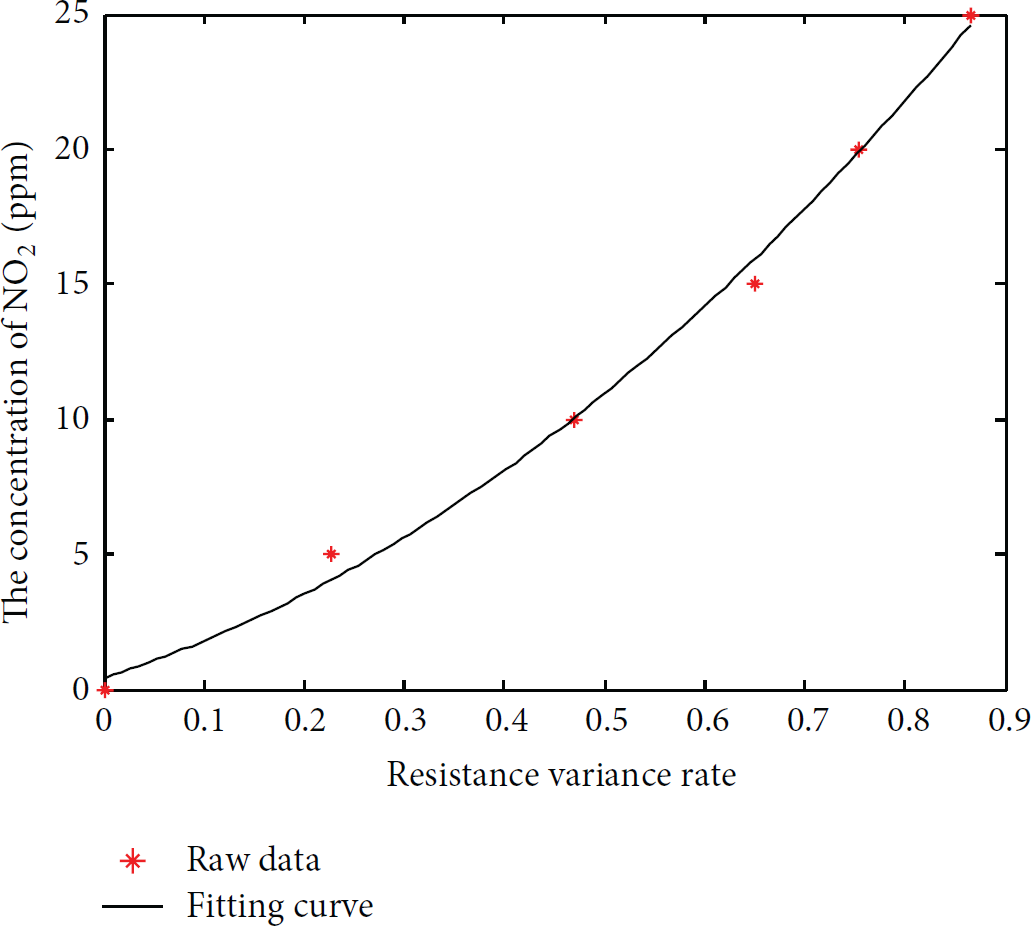
NO2 concentration curve fitting with the rate of change of resistance.
The gas sensitive property of NO2 of Number 3 sensor is shown in Figure 21; Figure 22 shows that the response time of Number 3 sensor to NO2 is 15 s, and the recovery time is 20 s.
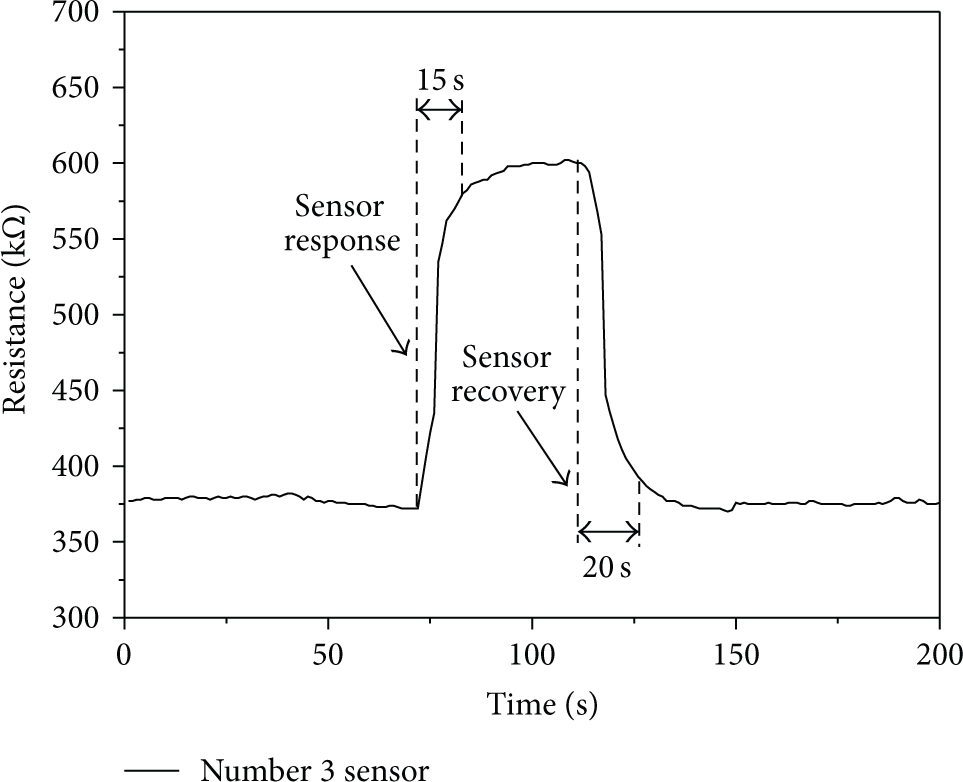
NO2 gas sensing characteristics of the Number 3 sensor.
4.3. Data Analysis and Processing of the Reducing Toxic Gas CO
By piping in 100 ppm, 50 ppm, 25 ppm, 10 ppm, and 5 ppm CO, respectively, we find that the value of resistance of Number 2 and Number 4 sensor has decreased on exposure to reducing toxic gas, and the gradient of the value of resistance progressively decreases with the decrease in the concentration of gas. The gas sensitive property of CO is shown in Figure 23.

The response curve of CO gas sensing.
The sensitivity analysis of different sensors to CO is shown in Table 4.
Different sensor sensitivity analysis on CO.

It can be seen in Table 4 that the gradient of value of resistance decreases with the reduction of the concentration of gas. The gradient of Number 2 sensor is bigger than Number 4 sensor in any concentration of gas; thus, Number 2 sensor can be chosen as the recognizing front-end of CO.
Based on the sensitivity analysis to the concentration of CO of Number 2 sensor, we use MATLAB to fit the curve of the concentration of CO that changes with the resistance gradient, as shown in Figure 24. The results confirm the quantitative identification function of the concentration of CO of Number 2 sensor, shown as follows:


CO concentration curve fitting with the rate of change of resistance.
The gas sensitive property of CO of Number 2 sensor is shown in Figure 24. Figure 25 shows that the response time of Number 2 sensor to CO is 16 s, and the recovery time is 25 s.

CO gas sensing characteristics of the Number 2 sensor.
4.4. Data Analysis and Processing of the Reducing Toxic Gas SO2
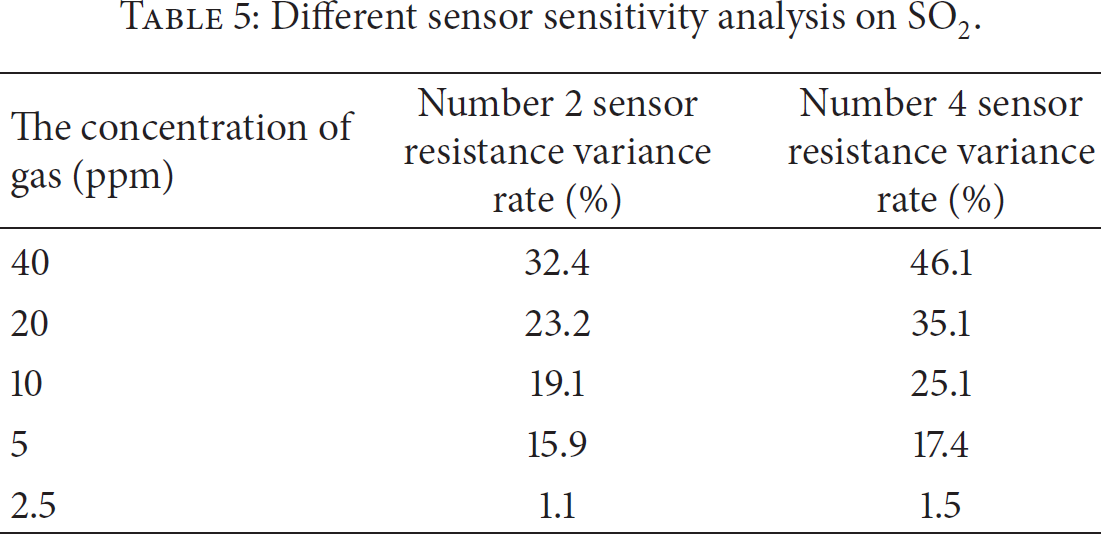
By piping in 40 ppm, 20 ppm, 10 ppm, 5 ppm, and 2.5 ppm SO2, we find that the value of resistance of Number 2 and Number 4 sensor decreases when exposed to reducing toxic gas, and the gradient of the value of resistance progressively decreases with the concentration of gas. The gas sensitive property of SO2 is shown in Figure 26. The sensitivity analysis of different sensors to SO2 is shown in Table 5.
Different sensor sensitivity analysis on SO2.

The response curve of SO2 gas sensing.
It can be seen in Table 5 that the gradient of value of resistance decreases with the reduction in the concentration of gas. The gradient of Number 4 sensor is bigger than Number 2 sensor in any concentration of gas; thus, Number 4 sensor can be chosen as the recognizing front-end of SO2. Based on the sensitivity analysis to the concentration of SO2 of Number 4 sensor, we use MATLAB to fit the curve of the concentration of SO2 that changes with the resistance gradient, as shown in Figure 27. The results confirm the quantitative identification function of the concentration of SO2 of Number 4 sensor, shown as follows:


SO2 concentration curve fitting with the rate of change of resistance.
The gas sensitive property of SO2 of Number 4 sensor is shown in Figure 27. Figure 28 shows that the response time of Number 4 sensor to SO2 is 10 s, and the recovery time is 12 s.

SO2 gas sensing characteristics of the Number 4 sensor.
The paper sets Number 1 and Number 3 sensors to measure the two oxidizing toxic gases Cl2 and NO2 and sets Number 2 and Number 4 sensors as the sensors to measure two reducing toxic gases CO and SO2.
4.5. System Testing
Figure 29 shows the inspection equipment and information relay station. Figure 30 shows our testing environment.

The physical map of system.
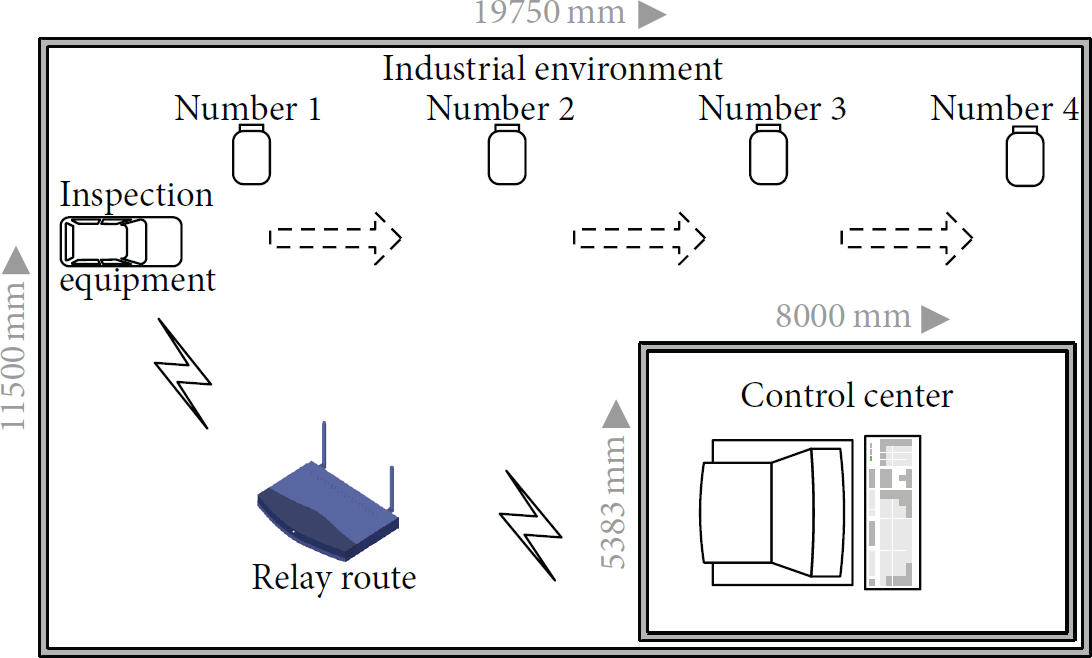
The environment map of online test.
As shown in the figures, the inspection equipment is placed in an industrial environment. There are four labeled bottles used as simulated gas sources, and only one contains real toxic gas.
Inspection equipment can detect the leakage of toxic gas sources through the sensor when bringing it through the four gases sources, and then it will send the collected information of the toxic gas to the control center through the information relay station, so that the control center could detect the specific circumstance of the leaked toxic gas. Figure 31 shows the actual testing situation.
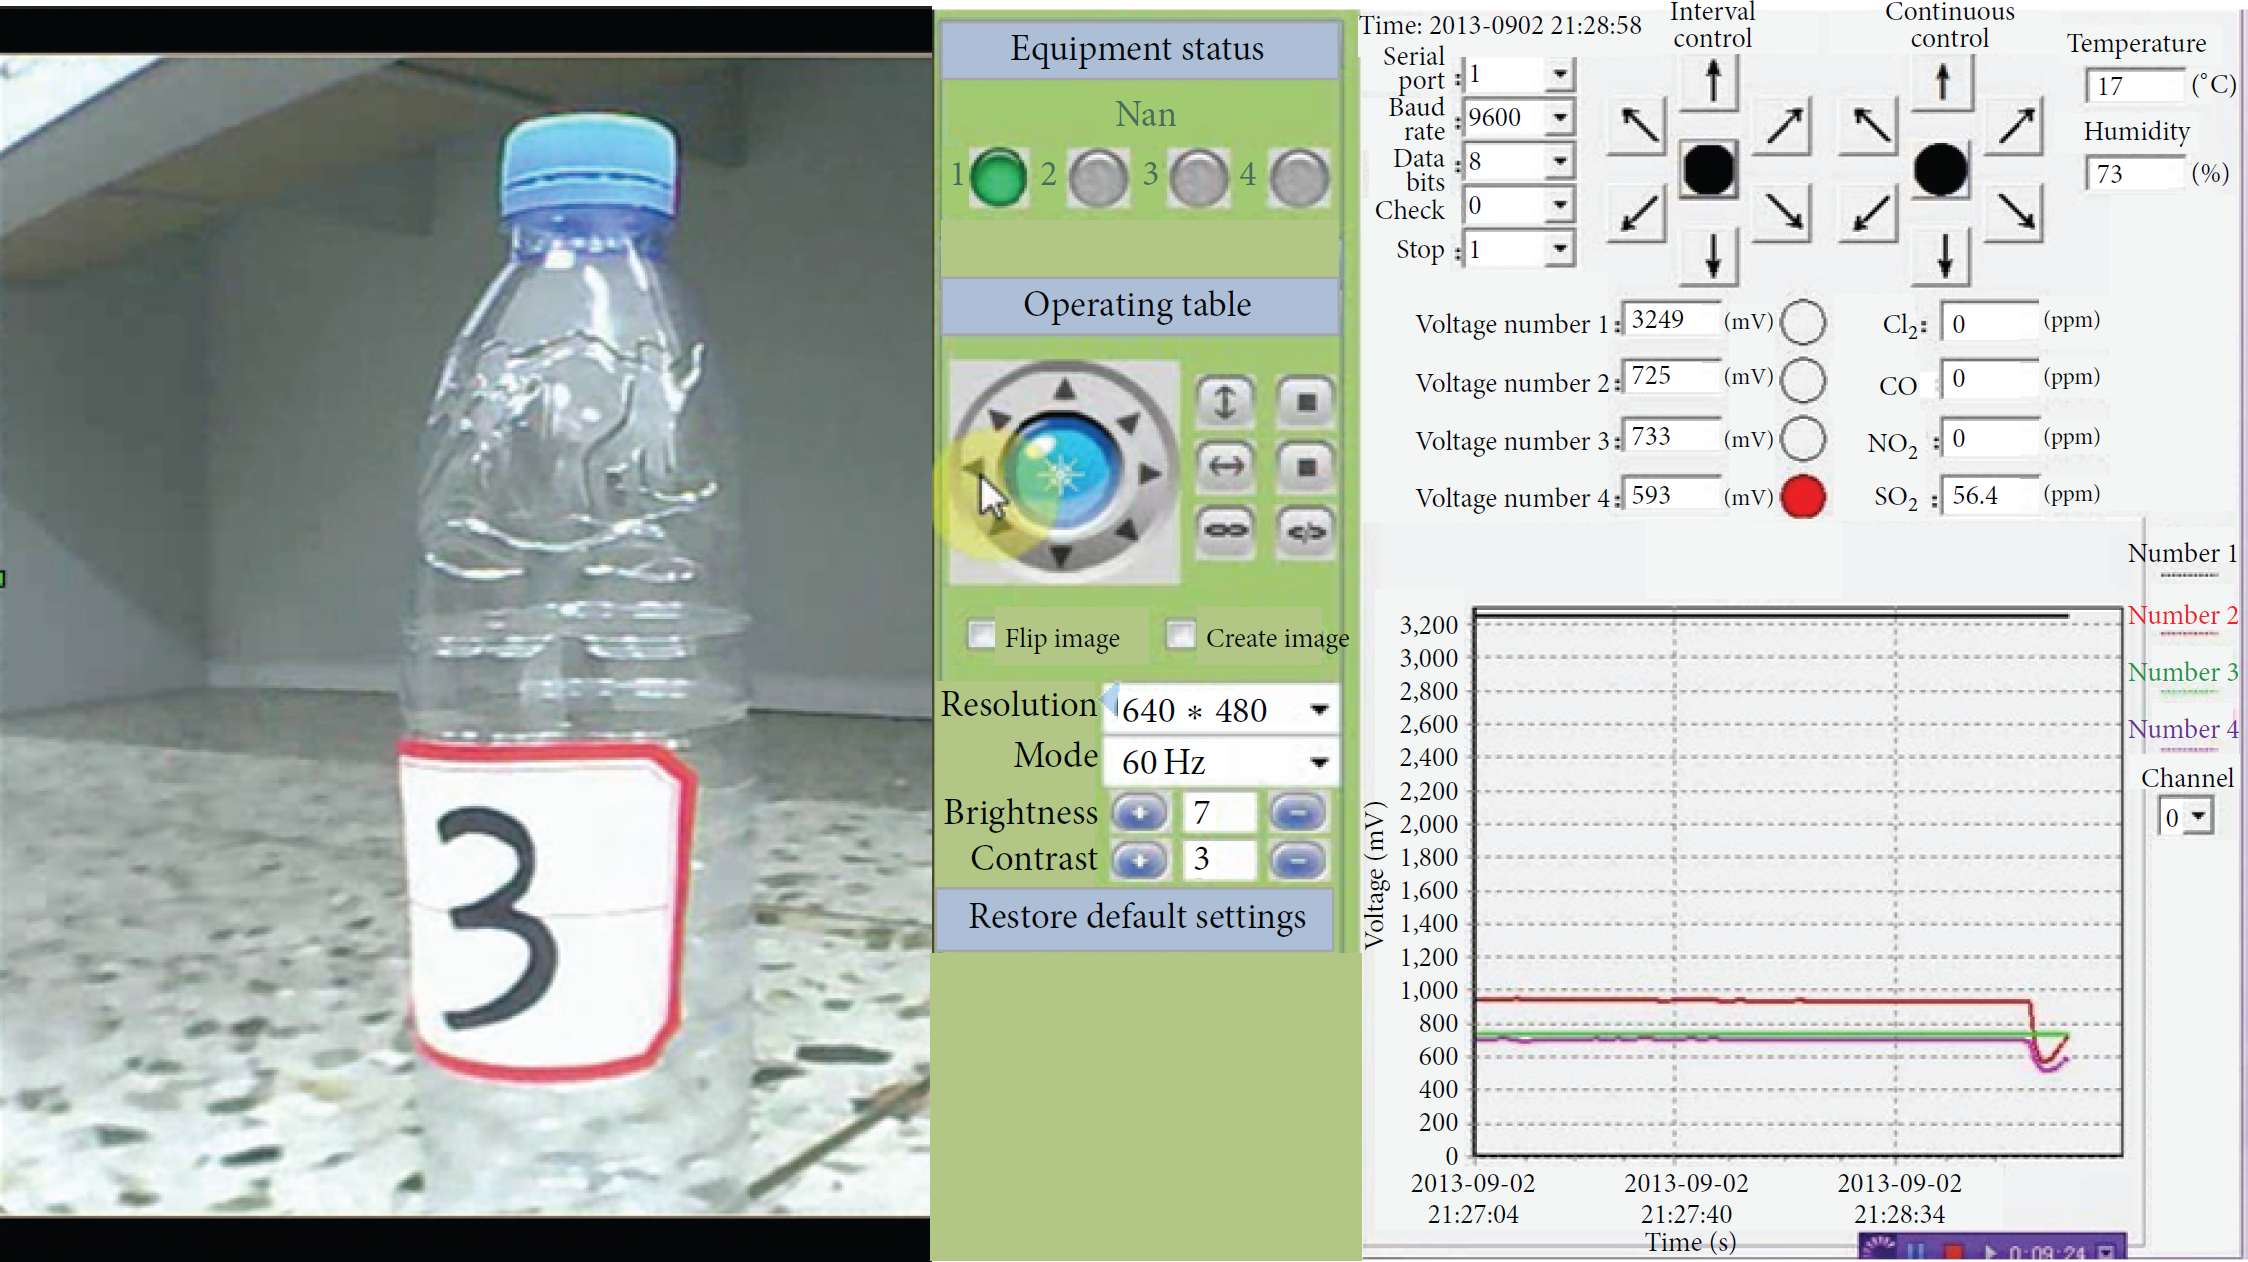
PC control and display interface.
The detecting equipment will generate an alarm when exposed to a toxic gas source. Through data processing and analysis, control center interface displays in real-time that the toxic gas is SO2, with a concentration of 36.4 ppm.
5. Conclusion
We proposed a toxic gas wireless detection system with multisensor recognition having integrated toxic gas detection technology, communication technology, and data analysis. Our work achieved remote wireless real-time monitoring of information on various types of gases in an industrial field. The system not only meets the requirements of industrial production, but also improves the deficiency of the previous ways in monitoring. The system has a broad development and application prospect in terms of application scope and technical research.
Footnotes
Conflict of Interests
The authors declare that there is no conflict of interests regarding the publication of this paper.
Acknowledgments
The authors wish to thank the Key Project of Heilongjiang Province Natural Science Foundation (no. ZD201217) and Harbin Application Technology and the Development Project (no. 2013DB1BG013) for their support.