
Abstract
This paper proposes a lighting control system based on RTP to save lighting energy cost by utilizing daylight while maintaining target luminance suited to the purpose. DR is a mechanism which transmits load by changing power use pattern depending on the user and receiving power charges signal at real time so that power demand would not exceed supply. However, DR is not actually implemented in an effective way due to a burden on the participants in the program to respond voluntarily towards pricing signals. In this paper, power charge process is categorized into three stages according to power load and proposes an LED control system based on WSN which automatically responds according to power demand. Daylight is controlled with a venetian blind, but it is controlled at the highest angle of uniformity ratio of illumination per time zone to maintain the uniformity of natural lights. This study establishes two test beds having the same environment. Further, illumination cost and power consumption of testing group that provides service with variable target illumination according to RTP as well as control group that serves with fixed target illumination regardless of power consumption were measured and energy saving by both conditions was compared.
1. Introduction
Around 40% of total energy consumption all over the world is used from buildings [1, 2] while 24% of Korea's energy consumption is used from the building section [3, 4]. Accordingly, the necessity of optimization of energy efficiency in buildings is being increased. There have been many methods [1, 4, 5] proposed to save lighting energy which occupies around 5–15% of electric energy consumption inside buildings [1, 4, 5]. With the advent of LED lighting which is having high energy efficiency and which is convenient in dimming, lighting energy is saved up to 20–40% by dimming the lighting according to daylight quantity [6–9].
In the architectural lighting sector, daylight not only secures excellent visible environment but also has many biological and psychological benefits. Also, indoor lighting and environmental evaluation are highly important evaluation factors in the energy and indoor environment sectors. Building Research Establishment Environmental Assessment Method (BREEAM) of UK which is an environmentally friendly structure certification system, the first of its kind in the world [10], has specified that more than 2% of daylight factor among 80% of total area (a minimum of more than 0.8%) should satisfy daylight factor or should satisfy uniformity factor higher than a minimum of 0.4. This is a method to evaluate quantitative as well as qualitative aspects of daylight at the same time. If excessive daylight is radiated into a room, it generates room cooling load inside the room which consequently increases energy consumption. After that, a light environment can be impaired due to glare by direct sunlight. Therefore, it is necessary to satisfy energy saving and visual pleasance at the same time by controlling blinds that control daylight radiation. The government of each country increases the weight of new and renewable energy such as sunlight, water power, and wind power on power generation as an alternative solution to power saving [11]. Also, these institutions propose a smart grid which optimizes energy efficiency by exchanging real time information between power supplier and consumer with full-duplex by fusing information and communication technology (ICT) into an existing central power network [12, 13]. To implement a smart grid, some new technologies in communication, distributed systems, advanced metering, automation, safety, and security should be integrated so that the smooth transmission of information between power supplier and consumer can be executed [14, 15].
Real time electricity charge information that can give total power consumption status not only lets a power supplier reserve power and save input cost necessary for surplus facility capacity but also makes a power consumer shift power demand during high electricity charges towards the time during which power production cost is relatively low so that energy cost could be minimized [15–17]. Information that is provided to consumers such as real time power consumption, power use pattern, and real time pricing information is generated through advanced metering infrastructure- (AMI-) based device smart meter. Transmitted real time pricing information changes power use pattern by the demand response of a consumer so that usage quantity and peak demand of total energy used are reduced. Accordingly, efficient power network operation by consumer is possible [15]. Recently the number of consumers who have participated in demand response (DR) has gradually increased with easier access to smart devices [17]. However, due to a burden to the users to voluntarily respond to the power price signals and change usage pattern, this system did not generate good results. Therefore, it is emphasized that automated demand response (ADR) that can automatically respond to power supply status, peak load rate, power production, and supply price so that power consumption is regulated is necessary. Research about fully automated control strategies which respond automatically towards DR with preprogram on the energy management control system is drawing the limelight as an alternative solution to the demand aspect of power [16, 18, 19].
This paper proposes an LED dimming control system based on the RTP of smart grid to minimize energy cost by utilizing daylight which enters an office space without human intervention. The proposed system receives power use status from a full-duplex power network of smart grid at real time and reduces energy cost in a time zone during which power price is high after reducing the dimming level of lighting, while it improves the work efficiency of users in a time zone during which power pricing is low upon increasing the dimming level of lighting. Also, automatic venetian blind is installed to control daylight which enters a room and by adjusting the slat angle of the blind at the best uniformity of illuminance. The system uses IEEE 802.15.4 based on ZigBee wireless communication technology which has the characteristics of low-cost and low-energy consumption to send and receive remote data like RTP data and illuminance data of space, control of slat angle of blind, LED control, and so forth [20–23]. The optimum uniformity of illuminance in each time zone was analyzed from real time illuminance data collected per slat angle of blind, while the energy cost reduction according to blind and lighting control algorithm were compared with those in the system controlled with adjusted illuminance.
The rest of the paper is composed as follows. In Section 2, the power price system of the smart grid and daylight ratio and uniformity of illuminance that are the factor to control the slat angle of blind are described, and the results evaluated from the test bed are proposed. In Section 3, the power price calculation results by dimming control system proposed in this study and by RTP are investigated and the evaluation results with the system with fixed illuminance are compared. In the last chapter (Section 4), a conclusion of the study is briefed.
2. Related Work
2.1. Real Time Pricing (RTP)
Since electricity is not storable economically, wholesale prices vary from day to day and usually fluctuate by an order of magnitude between low-demand night-time hours to high-demand afternoons [24]. Figure 1 is the system marginal price (SMP) graph which is the power wholesale standard price in December, 2012. According to the graph, monthly average power consumption was KRW 165.46/kWh with a maximum value of KRW 276.42/kWh at 09:00 AM on December 26, 2012, and minimum value of KRW 119.99/kW at 03:00 AM on December 3, 2012. Power pricing system charges electricity consumption based on this SMP. However, pricing system currently in Korea collectively charges electricity price which is decided in advance according to season and time zone not by reflecting the ever-changing wholesale price of power market at real time. This system is a statistical approach wherein price change is generated within a specific duration, and time is forecasted as having high demand based on the data collected in the past which, therefore, cannot reflect real time power demand and supply status.
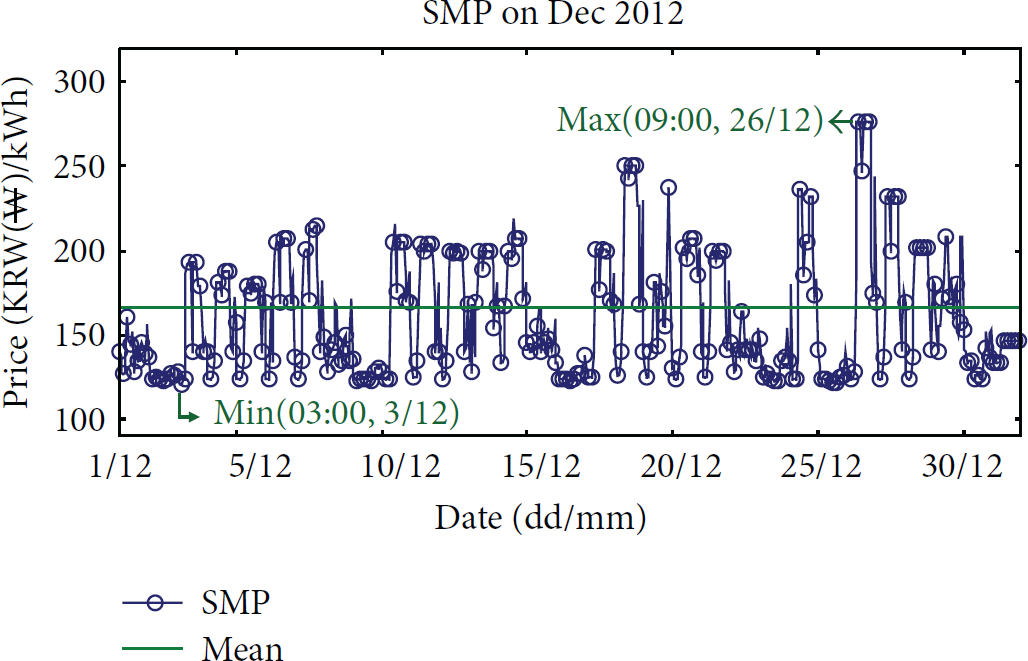
SMP changed per time zone in December 2012.
RTP which is a pricing system of smart grid announces the changed price of electricity (POE) one day prior or one hour (sometimes more often) in advance and shifts the demand of time zone during which power load is high to off-peak hours to induce reduced peak-to-average ratio (PAR) [15, 24].
Figure 2 is the RTP graph at a five-minute interval calculated in Korea from December 3, 2012 (Monday), to December 11, 2012. The graph shows small changes per time zone during holidays like Saturday and Sunday, while the deviation of POE during most of the working days was great according to power use per time zone. Also, on December 3, 2012, and December 10, 2012, a considerable price difference occurred though they were in the same time zones of the same day (Monday). This difference was caused by environmental factors that affected the changes in electrical energy demand [25]. In fact, the temperature on December 3, 2012 (Monday), was on an average of 1.7°C, a minimum of −1.6°C, and a maximum of 5°C. Meanwhile, the temperature on December 10, 2012, was −8.3°C on average, −11.8°C on minimum, and −4.6°C on maximum, showing high difference in temperature. Accordingly maximum POE during the day was recorded during 08:30–11:55, 13:40–14:00, and 23:15–23:30 on December 10, 2012.

Changes in RTP per time zone.
RTP is a demand response mechanism which end users (consumers) respond due to price changes of power according to time, influencing their energy consumption pattern [26]. A smart grid trial unit in Korea was established in Jeju Island for 60 months starting from December 1, 2008, to November 30, 2013, while pilot research of RTP was executed to drive intelligent power network for 200 units of consumers (residential, educational, industrial, and general) [27]. The trial results showed that some of the consumers received information such as power consumption and price through smart meter or in-home display (IHD). Thereafter, they decreased energy consumption or dispersed power peak time zone voluntarily. However, some consumers, though they received correct power price signals, could not perform effective power consumption by price signal due to the burden of monitoring power price which kept on changing. Hereby, this paper proposes a fully automatic demand control system which performs demand control automatically according to the price signal stages of RTP without consumers participating themselves.
2.2. Daylighting Evaluation in Building
With an environmentally friendly certification system of building, interest about energy certification and indoor environment certification of structure has also increased. The light environment segment in the indoor environment is the most important component in the environmentally friendly certification system; thus, it is handled importantly in the BREEAM of UK, LEED of USA, and CASBEE of Japan [10, 28–31]. The BREEAM is an environmentally friendly building certification system established for the first time in 1990. BREEAM demands that daylight factor among Health and Well-Being items in Visual Comfort has to be measured at 700 (mm) from the ground in the office. It specifies that daylight factor has to be on an average more than 2% (minimum 0.8%) of 80% of area among the total area. Further, it specifies uniformity ratio which represents the uniformity of natural lighting in an office building as the ratio between the minimum (from daylight) illuminance on the working plane within a room and the average illuminance (from daylight) on the same working plane minimum of more than 0.4 [10]. In this study, venetian blind that can adjust its slat angle automatically was installed on the window to satisfy the uniformity required by the daylighting evaluation standard of BREEAM. Illuminance was measured at a one-minute interval and average uniformity of illuminance was calculated per one hour. At this time, six types of slat angle were measured and daylighting was adjusted with a slat angle that provided the maximum uniformity of illuminance per time zone.
3. RTP-Based Lighting Control System
The system adopted in this study was composed as three stages as shown in Figure 3. Firstly, during data acquisition stage, the system collected illuminance data and real time power price at specified intervals from illuminance sensors installed at each location and from smart meter through ZigBee-based wireless network. At this time, illuminance data were collected from each sensor arranged in a space at a one-minute interval. Meanwhile, real time power price was collected by sending it from a network composed of industrial customer, commercial customer, and residential customer at a five-minute interval to smart meter. Secondly, during context interpretation stage, target illuminance of space was calculated per standard from real time power price, current illuminance was calculated using collected illuminance data, and then illuminance which had to be added in the space was determined. Also, slat angle at current time was called from database to control the blind. Lastly, during device control stage, by constructing a packet to control illuminance of lighting and packet to control the slat angle of blind, these packets were sent to the lighting controller and blind controller, respectively. The lighting control packet and blind control packet which were sent to each controller were 13 bytes each as shown in Table 1. In case of lighting control packet, it was controlled by control levels of Warm_Data and Cool_Data. Blind control packet was controlled by blind control angles of Slat_Up, Slat_Down, and Data 0–Data 2. During this time, the control level of lighting was in a range of 0–255 and blind control angle was of six types, that is, open, −60°, −30°, 0°, 30°, and 60°.
Lighting control packet and blind control packet.


System architecture.
3.1. Blind Control
Test beds to measure uniformity of illuminance were set in the space facing south (the 4th floor) at 12,650 (mm) from the ground with a size of 2,810 (mm) in width × 7,350 (mm) in length × 2,700 (mm) in height as shown in Figure 4. This size of window was 1,450 (mm) in width × 1,440 (mm) in width. A venetian blind of automatic control type that can adjust slat angle automatically was installed on the window to control sunlight quantity. Illumination sensors for measuring illuminance of space were arranged, having a total of eight numbers with equal distance at height 850 (mm) which was the height of a working plane. However, it was not recommended by the California Energy Commission (CEC) to install light sensors at a distance of more than 5 m (15 ft) [32]; thus, the illuminance data used to calculate the uniformity of illuminance for daylight were collected from six sensors located till the height of 4,410 (mm). Six types of slat angles of blind were evaluated as open, −60°, −30°, 0°, 30°, and 60° as shown in the figure, and the blind was controlled with a slat angle showing the highest uniformity of illuminance per time zone.

Test bed for experiment.
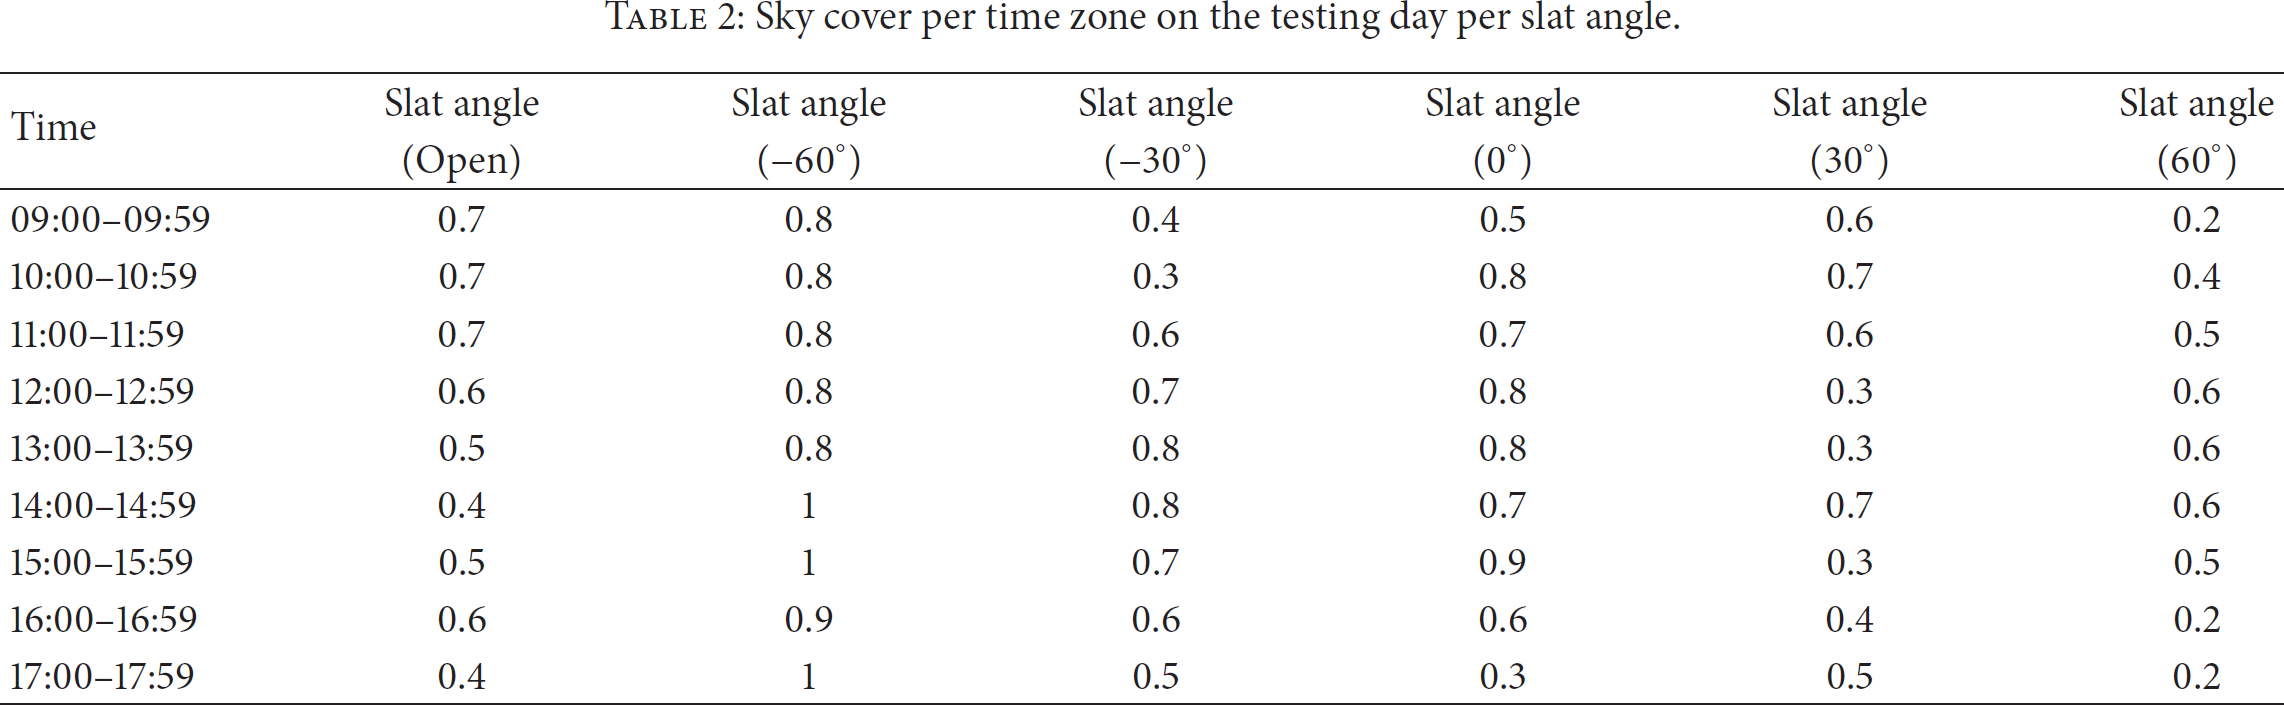
Table 2 shows the sky cover per time zone (09:00–18:00) on the testing day. The sky cover with slat angle open, −30°, 0°, 30°, and 60° was on an average 0.4–0.7, which presented partly cloudy sky. Meanwhile, the slat angle −60° yielded a clear result with an average sky cover of 8.7. The data were collected at a one-minute interval from illumination sensors, while illuminance indoors and outdoors according to the slat angle of blind was calculated as average during five minutes. Figure 5 shows a correlation graph between indoor illuminance and outdoor illuminance according to the slat angles of blind. There was a difference in quantum inflow to a room according to slat angle, while the patterns between outdoor illuminance and indoor illuminance were similar. The correlation between independent variable outdoor illuminance and dependent variable indoor illuminance according to slat angle of blind was calculated as regression equation y according to coefficient of determination
Sky cover per time zone on the testing day per slat angle.
Relationship between indoor illuminance and outdoor illuminance.

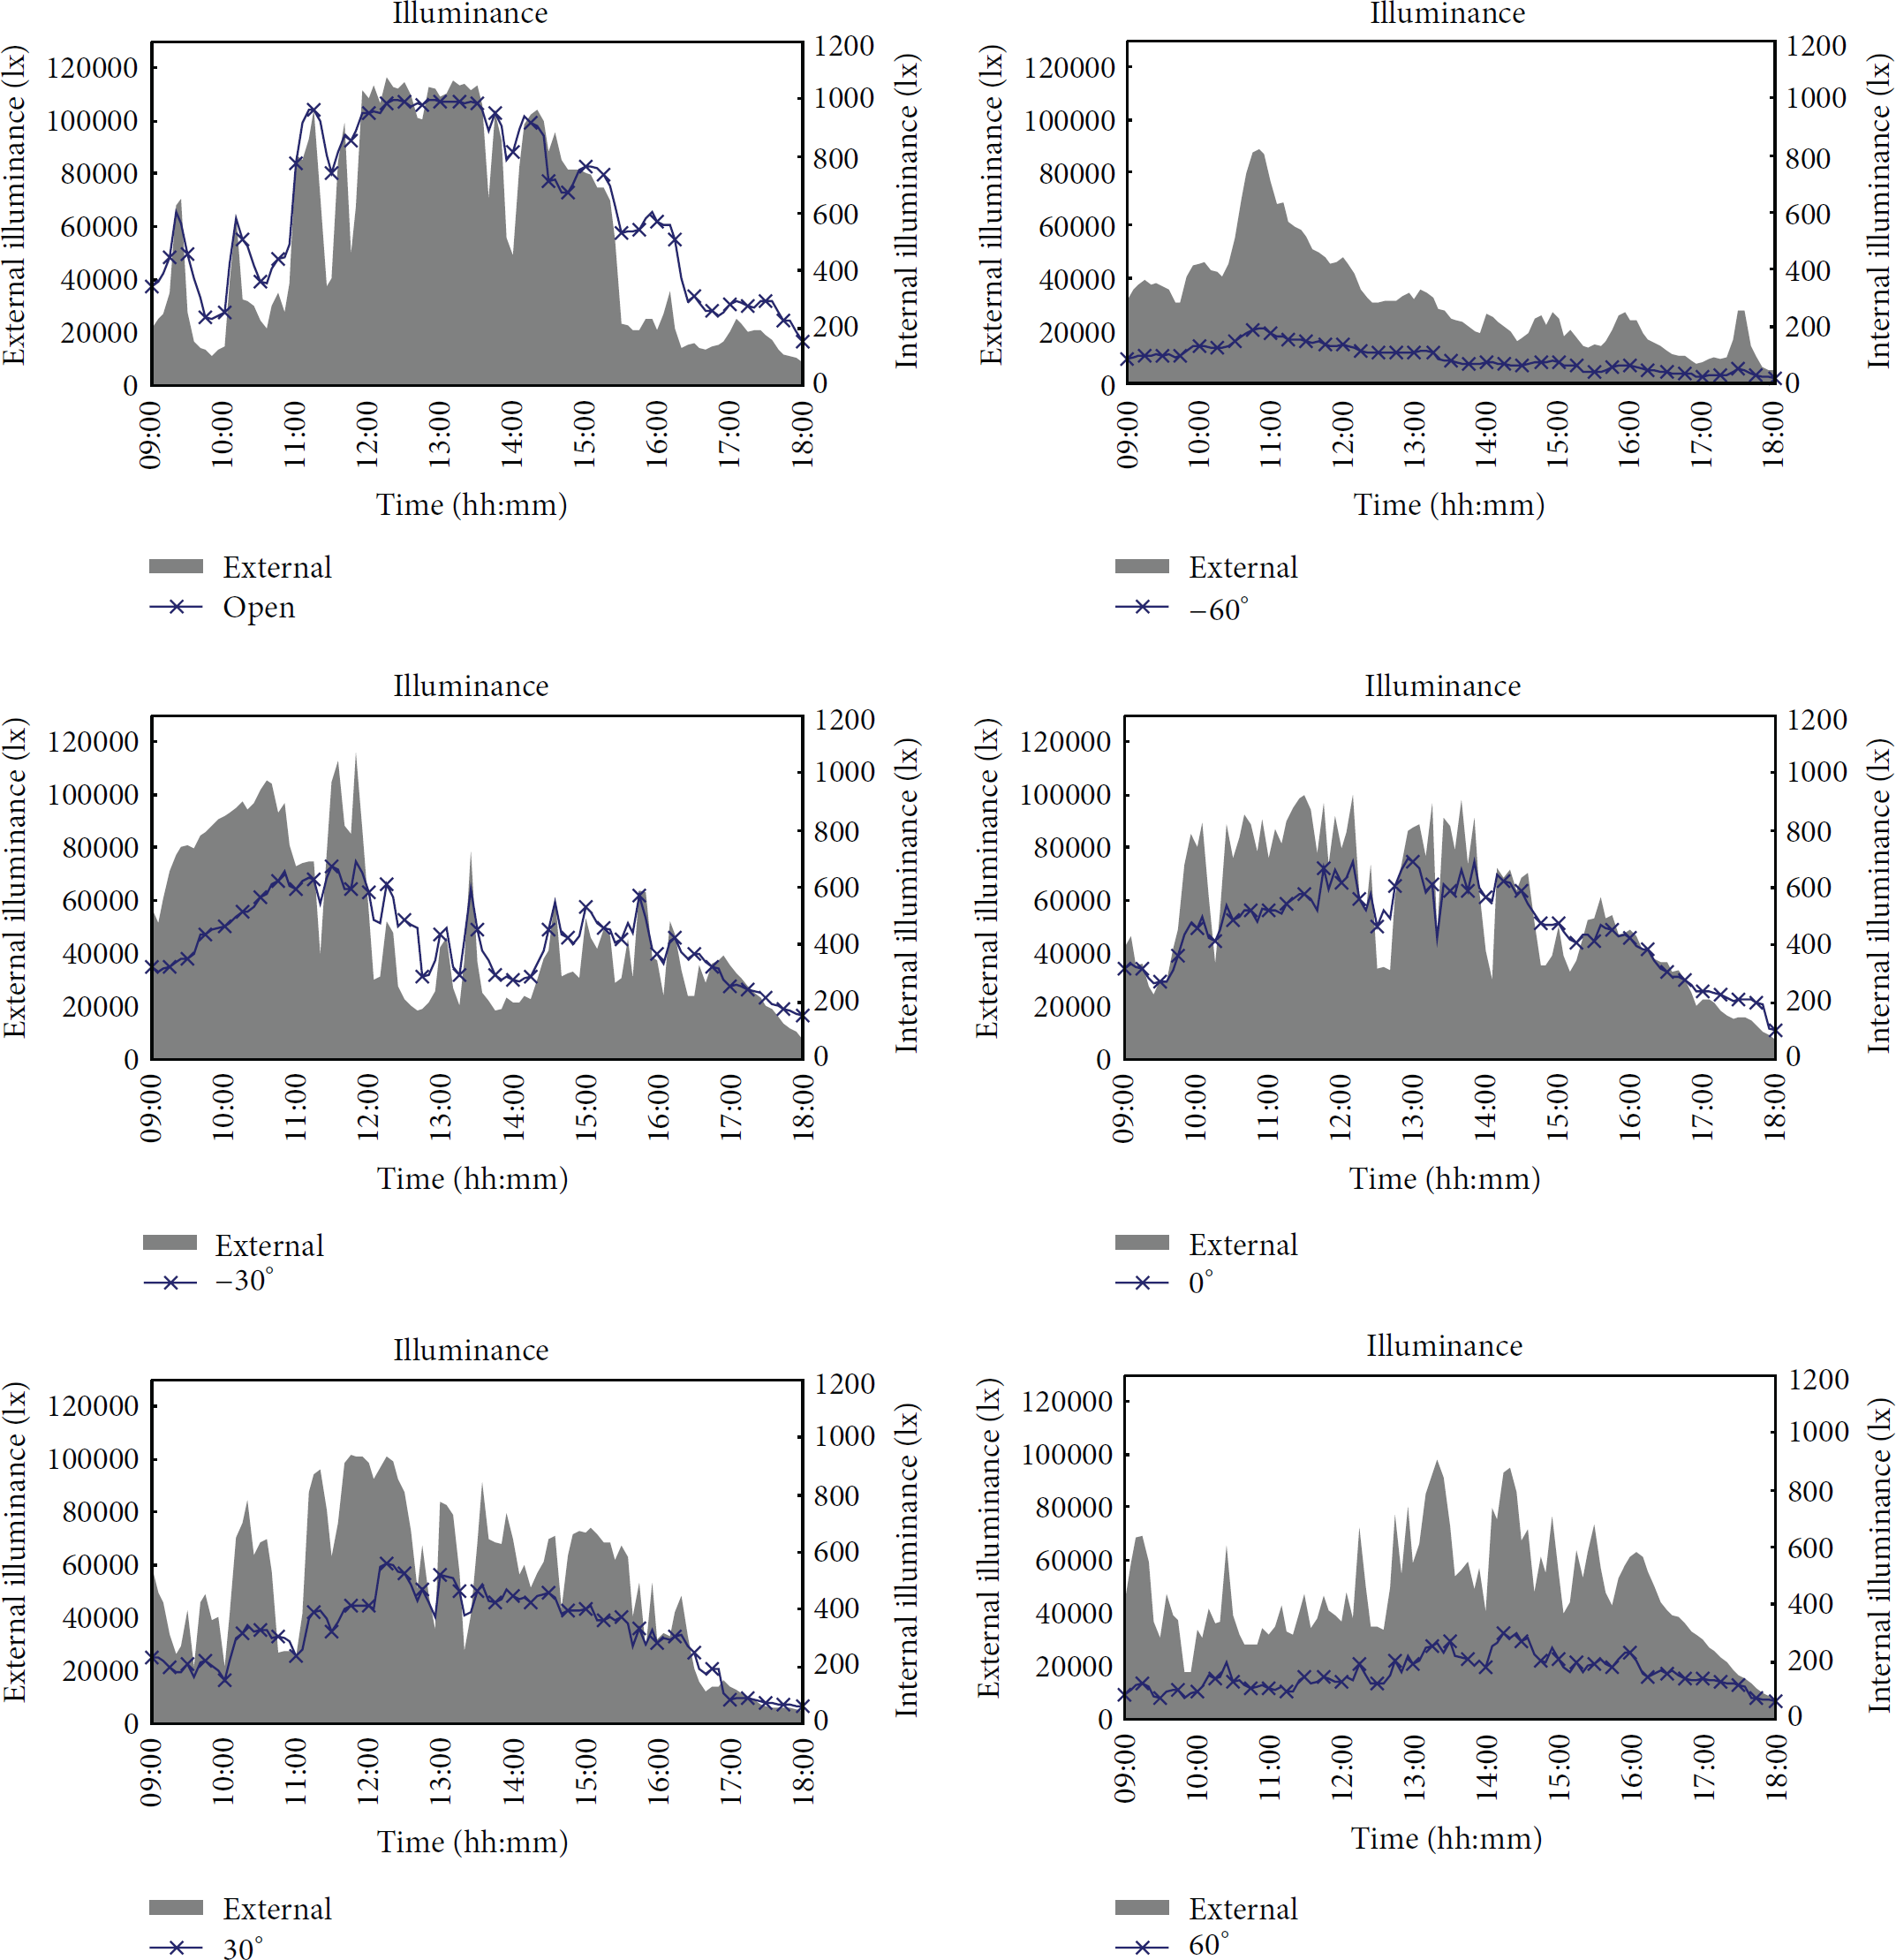
Indoor and outdoor illuminance according to slat angles of blind.
The uniformity of illuminance according to slat angle was calculated from a minimum of 0.31 to a maximum of 0.87 as shown in Table 4. In most of the cases, the highest uniformity of illuminance was observed at a slat angle of 30°. Therefore, the blind was controlled with the slat angle having the highest uniformity of illuminance among measurement values for different time zones to raise uniform characteristics of natural sunlight while reducing the energy consumption for lighting.
Uniformity of illuminance per time zone.

3.2. Experimental Environment and Experimental Conditions
In this study, power consumption and power price were calculated by changing the target illuminance of office according to power price that was changed at real time and by automatically dimming the lighting to target illuminance. Daylight quantity entering from outside was controlled by the control slat angle of blind automatically. The slat angle adjustment was carried out according to calculation results in Table 4. An experiment was carried out with the existing system and proposed system. The control space having the same condition with experimental space was set up and an experiment for each space was carried out simultaneously. An experiment was performed in the space where uniformity of illuminance for the daylight was tested as shown in Figure 4. Meanwhile, the control space for the comparison was set up as the same size with the experimental space near the control space as shown in Figure 6.

Environment for the experiment.
Two flat LEDs having a maximum power consumption of 100 W with the size of 600 mm in width × 600 mm in length were installed in a space at 1/3 height and 2/3 height. One flat LED was composed of 256 numbers of warm white (wW) LED, as well as 256 numbers of cool white (cW) LED. The control stage of wW LED and cW LED was in a range of 0–255. The size of blind to control daylight quantity was 1,450 mm in width × 1,440 mm in length. The types of control signals received by blind controller were set as six types, namely, open, −60°, −30°, 0°, 30°, and 60°. Also two illuminance sensors were installed at the height 850 mm which was the height of the working plane (at the height of 1/3 and 2/3 the same as the location of lighting) to measure current illuminance.
The control ratio of wW and cW was changed from 0, 50 to 255, 255 by increasing five levels at each time for a total of 2,604 rounds to investigate illuminance and power according to control ratio of LED in this study. The lighting control stage of wW and cW was programmed to be automatically changed at a ten-second interval. Data from the illumination sensor and power sensor were received through gateway as shown in Figure 7(a). An experiment was carried out in the lighting box as in Figure 7(b). The light distribution curve of LED and color coordinate CIE 1931 used for the experiments are as shown in Figure 7(c). Measurement was carried out from the height of 1,850 mm after excluding 850 mm from the ceiling to working plane. The measured illumination varied from a minimum of 9.19014 lx to a maximum of 1,089.05 lx while power consumption was measured from a minimum of 4.054 W to a maximum of 83.93 W as shown in Figure 8.
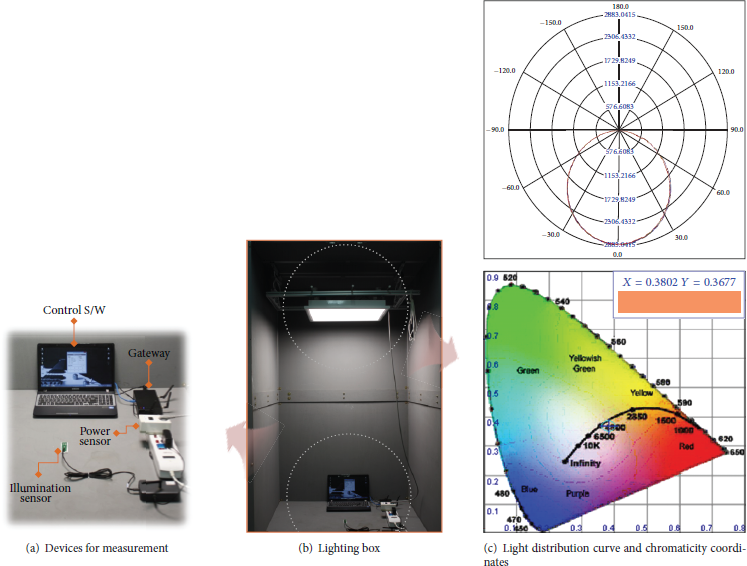
Measurement of illumination and power consumption for LED.

Illumination and power consumption according to LED control stage.
The common Korean standard for the visual environment specifies the desired illumination level in KS A 3011. This was then compared with foreign standards and the desired illumination levels of the case buildings [4]. Table 5 shows the illumination level of office buildings in the country and that recommended by the IESNA, USA. In the KS A 3011, the ranges of illuminances (lx) are specified as minimum, medium, and maximum illuminance according to activity types, while the illuminance standard recommended by IESNA is specified as to choose a single value by considering the condition and characteristics of space, age of user, and speed and accuracy level of work [33].
Illumination level of an office building.

The target illuminance level used in this study was per the recommendation in KS A 3011 which is a standard for illumination in Korea. The power price level is categorized into 1–3 in the same standard as maximum illuminance 600 lx under level 1 during which power price was the lowest, medium illuminance 400 lx under level 2, and minimum illuminance 300 lx under level 3 during which power price was the highest. The real time power price stage is categorized into three from minimum price KRW 120.04 to maximum price KRW 1,000 which are applied as level 1 lower than KRW 412, level 2 KRW 413–705, and level 3 higher than KRW 706.
3.3. Experiment and Evaluation
Experiment was performed in the experiment space, wherein the proposed system was implemented, as well as in the control space to compare the results with those of the experimental space simultaneously. In the control space, the slat angle of blind was set up with the same condition as in the experimental space, and a target illuminance of 500 lx [4] was fixed regardless of power price level. The experiment for the system was conducted from July 24, 2014, to July 28, 2014 (five days). The outdoor illuminations on the working time measured during each day are as in Figure 9. The RTP at five-minute interval used as experimental data is shown in Figure 10. The time to enter Stage 1 among the categorized power stages was for 11 hours and 45 minutes, the time to enter Stage 2 was for 4 hours and 25 minutes, and the time to enter Stage 3 during which power price was the highest was for 7 hours and 50 min. Target illuminance in the experimental space was changed according to price level as in the experimental group of Figure 10. The target illuminance in the control space was fixed regardless of time (the same as in control group). An experiment was conducted from 09:00 to 18:00 only. The consumed power and power price were compared. The same data of RTP as shown in Figure 10 were used to compare with the results during five days of measurements.

External illuminance of experimental space.

Target illuminance in the experimental space and control space per RTP.
Target illuminance of experimental space was set up at a minimum of 300 lx, an average of 400 lx, and a maximum of 600 lx by RTP which kept on changing in the experimental group. Meanwhile, target illumination in the control space was set to 500 lx which was the same fixed illuminance in the control group. Table 6 shows some part of the experimental data conducted on July 24, 2014. The illuminances shown in the Table were the control stage sent to lighting control at a one-minute interval to control LED in both the experimental space and control space and actual measurement data. At this time,
Control stages and illuminances by RTP in the experimental space and control space.

Figure 11 shows power (w/h) and power price (KRW) graph consumed by lighting
Power consumption and power price of daily lighting in the experimental group and control group.


Power consumption and power price in the experimental group and control group.
The power price consumed by lighting on July 27 with maximum daylight quantity was the least as shown in Figure 9. In case of July 26, there was minimum daylight quantity due to less daylight illuminance, and the power rates were resulted the most. The total power price of two lightings was
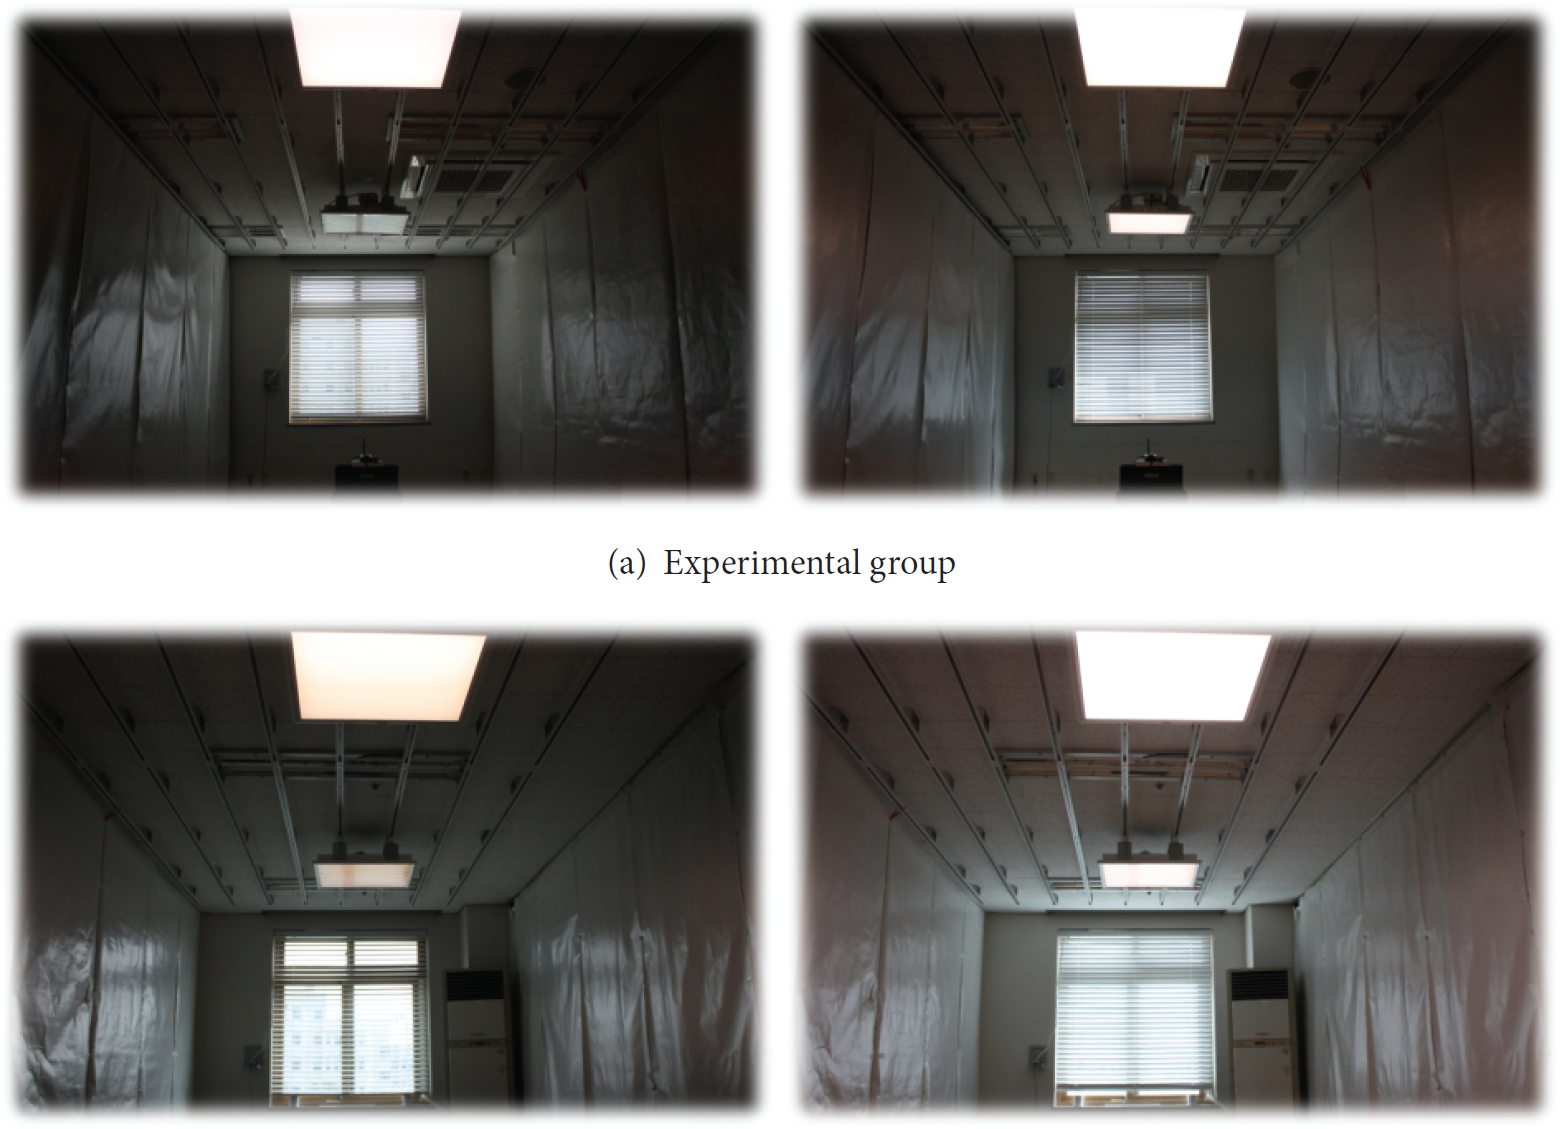
Testing bed in the experimental group and control group.
4. Conclusion
Real time pricing (RTP) of smart grid is a power pricing system which applies different pricings according to power consumption considering the responses by consumers. The power pricing stage of this RTP was classified into levels 1 to 3, and RTP-based lighting control system which automatically responds to energy consumption was proposed by controlling target illuminance of lighting according to load. Target illuminance was set as minimum, medium, and maximum according to power consumption specified in KS A 3011 which is the illuminance standard in Korea. The system was designed to serve maximum illuminance to improve work efficiency by serving the maximum illuminance during level 1 wherein the energy consumption is the lowest. During level 2, medium illuminance and minimum illuminance during which energy consumption was the highest were served to reduce the load and to minimize energy cost. Also, daylight which was entering a room was utilized as lighting energy to minimize energy consumption and this daylight was designed considering the uniformity factor of natural light. Uniformity of light was measured by controlling the slat angle of venetian blind installed on the window of a test bed set up for the experiment and by getting a signal from sensors for real time illuminance data. Slat angles of blind were controlled as six types, that is, open, −60°, −30°, 0°, 30°, and 60°. The slat angle which provided the highest uniformity of light per time zone was adopted for blind control. The system received power data used in the current illuminance and lighting based on the low-power and low-cost wireless communication technology ZigBee network and power price per kW at real time at a five-minute interval from the smart grid. The target illuminance which matched power pricing level was set from the received power price. The illumination level of lightings suiting target illuminance was set from current illuminance in the system and then the control packet was sent to a lighting controller, while the control packet was sent to a blind controller by blind slat angle per time zone saved in the database. Test beds were set to evaluate lighting energy consumption and energy cost of system. Actual measurements were performed during 09:00–18:00 for five days. The measurement data showed that energy consumption by the proposed system was saved by around 35% compared with that of the control system wherein target illumination was fixed. The power consumption by the proposed system was capable of saving energy consumption on an average of 23.78% compared with the control group.
Footnotes
Conflict of Interests
The authors declare that there is no conflict of interests regarding the publication of this paper.
Acknowledgments
This research was supported by Basic Science Research Program through the National Research Foundation of Korea (NRF) funded by the Ministry of Education (2009-0093825). This research was supported by Basic Science Research Program through the National Research Foundation of Korea (NRF) funded by the Ministry of Education, Science and Technology (2012R1A1A4A01013068).