
Abstract
This paper presents an acquisition system for measuring and characterization of thermoelectric generators (TEGs) for energy harvesting purposes on wireless sensors networks (WSNs). This system can monitor and characterize up to three TEGs simultaneously and is comprised of two main electronic circuits: the first one is composed of 12 input channels being three for reading voltage, three for reading current by making use of instrumentation amplifiers (ACS712), and six thermocouples for signal reading (<400°C). The second electronic circuit consists of a proportional-integral-derivative (PID) controller with two pulse width modulation (PWM) input channels for controlling the heat (thermoresistance) and cooling (controlled cooler) sources, respectively, following a predefined temperature gradient. The TEG measured data for the voltage, current, and temperature can be acquired in real-time with an application written on Delphi language and displayed both through a numeric and graphical display. In order to validate the precision and accuracy two commercial TEG modules (inbC1-127.08HTS) compatible with temperatures up to 200°C without signal degradation were used in series. The functional prototype of the implemented system had a cost under ≈430 USD, making it suitable where a good knowledge of the electrical characteristics of TEGs is of major interest, especially on cogeneration systems.
1. Introduction
In the present days, the search for new energy sources is mandatory in order to respond to continuous demand for electric energy [1, 2]. Among all the energy sources currently available, renewable energy [3, 4] and residual energy scavenging from industrial processes [5, 6] are presented as viable options. This is not strange, when looking at the increasing interest of ubiquitous electronic devices in the everyday life of human-being. Moreover, the complexity and requirements of these devices are not bounded by strict limits, which means that the use of batteries cannot be enough to ensure an uninterruptible working cycle. Therefore, the operational integration of such devices with some kind of energy recovering systems can reveal an interesting approach. This is the main reason behind the growth in the use of external (and renewable) energy sources for powering the devices with a process known as energy harvesting [7–24]. Regarding the latter, the use of materials presenting thermoelectric properties due to the Seebeck effect makes possible the conversion of thermal energy into electric energy [25] with an efficiency of 5–7% [26]. The efficiency follows a close relation to the Figure-of-Merit,

Recent researches presented efficiencies higher than 20% by using new techniques in the development of thermoelectric materials [31, 32]. In the face of these developments, the use of TEGs as power sources by harvesting thermal energy from the cogeneration losses on fabrication plants, transforming it into electrical energy [33, 34], is expected. In this context, a monitoring and acquisition system for TEG characterization is presented, comprised by thermal system with heating and cooling capabilities and a data acquisition and monitoring system for temperature, voltage, current, and power. The resulting data is then acquired and presented in real time by software developed in Delphi language, making possible the visualization and study of the thermoelectric material properties by plotting its efficiency curves. Finally this system is validated against two inbC1-127.08HTS from Thermoelectric Power Generation connected in series.
2. System Architecture
The acquisition and control system is implemented with a microcontroller capable of acquiring the data signals from the thermoelectric modules: temperature, voltage, current, and power. The following stage offers a PID controller compatible with two PWM control signals for setting the heat and cooling sources, by thermoresistance and controlled cooler, respectively, in order to follow the thermal gradient predefined test parameters. The development of a Delphi running software, capable of data acquisition and monitoring, plots graphics for each of the variables being measured. Figure 1 presents the diagram for the data acquisition system.

Data acquisition and control system architecture.
The use of this integrated system also offers the advantage of reducing the necessity of using equipment with different task capabilities for reading and presenting the data that is usually involved in these procedures, thus simplifying the process. The acquisition software saves the data onto hard drive disc from where it can be printed or exported to other software for analysis purposes making possible the comparison with previous tests.
The use of a universal serial bus (USB) to serial communication hardware makes possible the use of any personal laptop computer as an acquisition tool, with the previous communication driver install being only necessary.
2.1. Hardware
The acquisition hardware offers six channels for temperature reading (<400°C), three for current (<20 A) and three for voltage (<24 Vdc) making a total of twelve input channels. Moreover the voltage channels offer the option for differential readings for each individual thermoelectric module by using separate voltage references.
The acquisition hardware diagram, shown in Figure 2, is divided into two main modules: the first one is responsible for temperature reading while the second for reading the electric signals and controlling the heat and cooling sources. These sources are then controlled by two PWM signals generated by a PID controller previously calibrated guaranteeing control precision for the temperature.

Acquisition hardware.
The modular acquisition system with noncentralized architecture enables the independent selection of each individual channel. The configuration is done via software by enabling or disabling each channel according to the test parameters.
2.2. Software
Data from the acquisition hardware is handled by a computer running a custom software developed in Borland Delphi 7.0 graphical development environment. In the software menus it is possible to enable or disable each individual channel, select the temperature gradient required for the test, and generate data reports. The dynamic graphical data presentation can also be stored in archives for future analysis.
Figure 3 shows the acquisition data software main screen: from top to bottom in the first graph the temperatures in °C for the heat source (red top line), the low temperature source (blue lower line), and the temperature differential (black middle line) are plotted. In the second, third, and fourth graphs the data for voltage, current, and power is plotted.
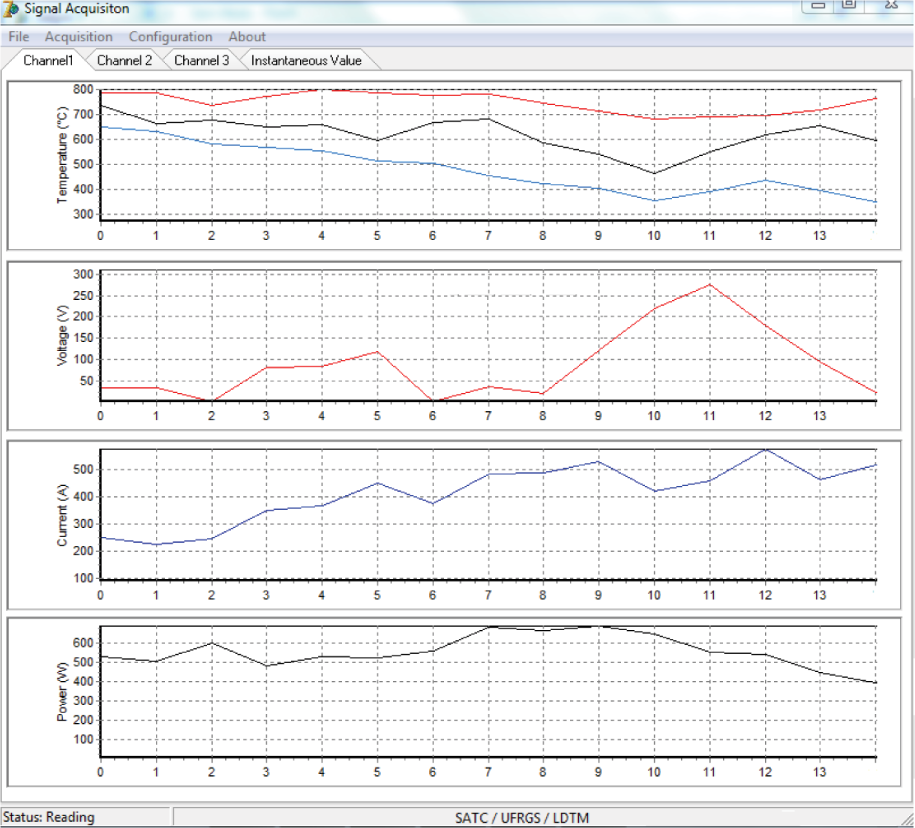
Software main screen showing plotted data.
The communication between the devices is managed by the computer which starts by requesting data from the acquisition hardware. If the computer requests the temperature reading, the first module sends the request. If the request is for the voltage or current, the first module bypasses the request to the second module which returns the information accordingly. At last, the computer sets the temperature by sending the control signals for the thermal (heat and cold) sources. Figure 4 shows the communication flowchart.

Flowchart for the communication protocol.
3. Experimental
By maintaining a constant temperature differential on opposite sides of a thermoelectric material current flow is generated and a voltage differential builds up. In order to study the characteristics and performance of a thermoelectric device, a device capable of maintaining a controlled and precise temperature differential by actuating a heat and cool sources, resulting in a TEG response curve behavior, is required.
3.1. Measurement Setup
The TEG test setup assembled is shown in Figure 5. The heat resistor is positioned under the TEG for rising the temperature of one side while on the top is placed a heat sink assisted by a cooler for lowering the temperature. This ensures a constant temperature differential on opposite sides of the TEG.
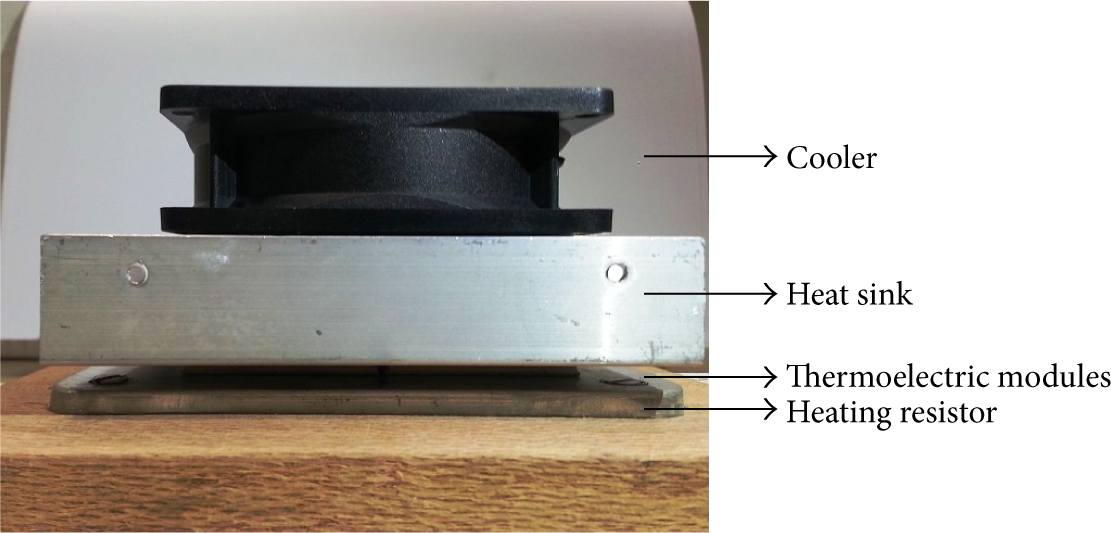
Experimental setup.
Two sheets of aluminium are used: one placed between the heating resistor and the TEG, while the other between the TEG and the heat sink. This provides an even temperature on both TEG surfaces and an attachment point for thermocouples. The data was acquired by the previously described system aided by a computer running the custom software. Figure 6 shows the schematic for the complete system.
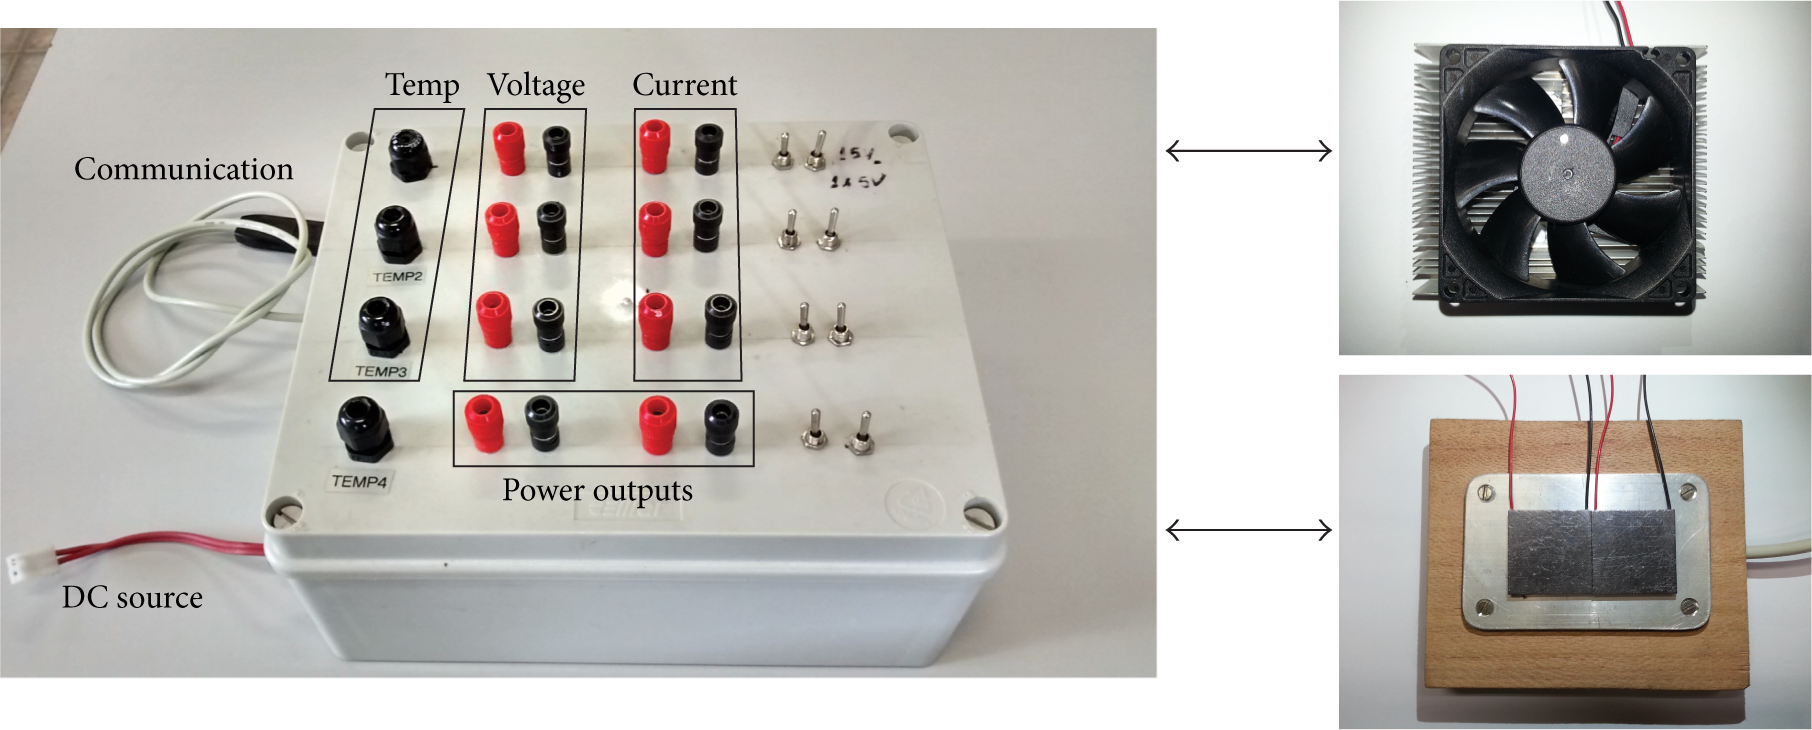
Setup used to connect the acquisition system into the TEGs.
In order to plot the TEG characteristic curves, a temperature gradient (
Real-time measurement takes place for the temperature differential, voltage, and current by activating the respective reading channels. This synchronized reading for the variables can be visualized, also in real time, on the computer. By using the extra reading channels it is possible to acquire the temperature, voltage, and current at distinct places among the modules.
This procedure was conducted for all temperature gradients, from 5°C to 80°C, for two separate procedures: in the first sixteen tests, were performed without any load, with the temperature gradient and output voltage only being measured. In the second another sixteen tests, took place but with a resistive load attached to the TEG output. The measured variables were the temperature gradient, voltage, and current.
The performed tests revealed a precision of ±1%, ±1.5%, and ±1.4% for the temperature, voltage, and current, respectively, with a maximum error of 1%. These values were obtained after comparing both the setup performance and a calibrated hardware performance. Adjustments via software were made after using data analysis tools based on ordinary least squares (OLS) and linear equations.
For every test procedure the sampled data generated several different files with temperature values for the heated side, cooled side, temperature gradient, voltage, current, and electric power. These files were exported to a spreadsheet for data treatment in order to obtain a graphical output the current software cannot plot.
3.2. Measurement Results
This chapter validates the use of the two inbC1-127.08HTS connected in series by analysing the test results. The open voltage,

The open circuit voltage,
Based on data presented on Figure 7, the generated voltage constantly varies with the temperature gradient. For temperature gradients
Comparing the data samples with the tendency line it is clear that for every sample the relation

The internal resistance of TEG,
In Figure 9, the triangles represent the mean value (

The medium and standard deviation values of the internal resistance of TEG,
By using a fixed resistive load value (Figure 10) for different temperature gradients (
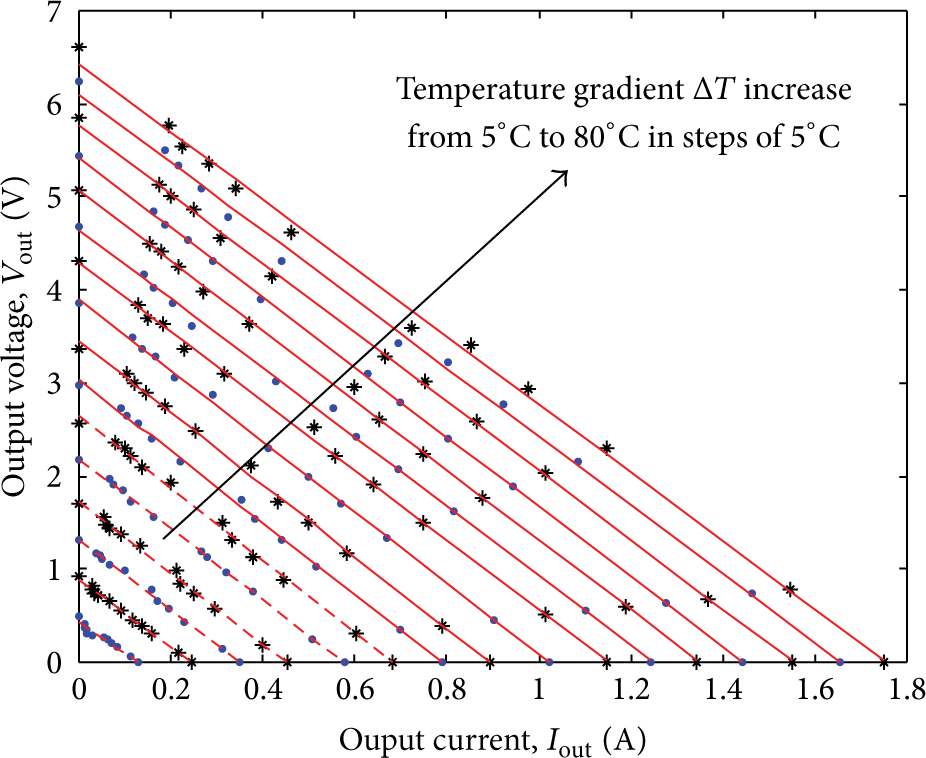
The output voltage,
Data analysis revealed that the increase of the temperature gradient,

Additionally, the measured powers

After analysis of the output power curve

The output power,

The output power,
4. Conclusions
The assembled monitoring and acquisition system presented a low maximum reading error of ±1.5% for all sampled variables. This was achieved after calibration using precision instruments as reference and by using an accurate temperature monitor and PID controller with a maximum error of ±2°C. Moreover, the file export capability enables the use of more complex data treatment algorithms.
The characterization for the module association was validated by revealing data coherence with data presented in [35]. The series configuration for the two inbC1-127.08HTS modules from Thermoelectric Power Generation is capable of supplying
The use of the assembled monitoring and acquisition system presents itself as a viable option for TEG monitoring and characterization for presenting a low reading error, easy assembly, and low cost. For all of these considerations, this setup is also qualified for academic learning purposes where TEG characterization is desirable.
Footnotes
Conflict of Interests
The authors declare that there is no conflict of interests regarding the publication of this paper.
Acknowledgments
This work was fully supported by the Algoritmi Strategic Project UI 319-2011-2012, under the Portuguese Foundation for Science and Technology Grant Pest C/EEI/UI0319/2011.