
Abstract
Traditional structural monitoring systems have disadvantages such as the shorter life span of sensors relative to that of the structure being monitored. The present study uses carbon fiber reinforced cementitious composite (CFRC) as a structural monitoring sensor to extend the life of a sensor to match that of the structure. There are some known advantages of CFRC, such as high tensile strength and high ductility that increase the seismic capacity and security of such structures. However, CFRC has functionality similar to piezoresistive materials, which can be used as self-sensing materials for strain measurement and damage detection. This property is based on the reversible effect of strain on the volume of electrical resistivity and the irreversible effect of material damage on its resistivity. Considering the economic benefits, the fiber content is only 0.2 vol.%, which is less than half of the amount used in other studies. The experimental results show that the conductivity of current materials is significantly improved by CFRC and that it can be used for strain measurement and damage detection. Moreover, the experimental results of CFRC-coated beams and the RC portal frame can be kept in a database for applications in structural health monitoring.
1. Introduction
This paper examines carbon fiber reinforced cementitious composite (CFRC), in which carbon fibers are added into cement paste with functionality similar to piezoresistive materials. It can be used as a self-sensing material for strain measurement and damage detection. It is based on the reversible effect of strain on the volume electrical resistivity and the irreversible effect of damage on the resistivity. The strain sensing behavior is such that the resistivity decreases reversibly upon compression, owing to the slight push-in of crack-bridging fibers and the consequent decrease in the contact electrical resistivity of the fiber-cement interface. Similarly, the resistivity increases reversibly upon tension, owing to the slight pull-out of crack-bridging fibers and the consequent decrease in the contact resistivity [1–3]. The self-sensing ability of CFRC cement-based composites has been well demonstrated under compression and under flexure. With the use of electrical resistance changes and appearance of structural cracks in CFRCs, it is possible to integrate sensors that possess a material smartness quotient for self-sensing, stability, and repetitiveness.
2. Related Works
Chen and Chung [4] proposed adding carbon fiber into concrete, forming carbon fiber reinforced concrete, which can significantly improve the conductivity of the material, and found that the measured electrical resistance should be related to the measured strain. Sun et al. [5] proposed a conductive CFRC model. There are four conductive paths in the model: (1) water slurry inside the ion-conductive media; (2) electronically conductive fibers in the slurry and conductive holes; (3) electronically conductive paths between the fibers and the continuous conductive holes; and (4) electronically conductive fibers through the conductive network past the conductive hole. It is known from experiments that when the fiber content is low, current travels mainly via paths (1) and (2). As the fiber content slightly increases, transmission occurs mainly via paths (2) and (3). When the fiber content increases further, path (4) becomes the main pathway.
Wen and Chung [6, 7] showed that electrical resistance may vary with changes in compressive or tensile strain and that there is a relationship between the two. Thus, a way to measure a fractional change in electrical resistance could be related to a method to measure strain. Chen et al. [8] examined CFRC specimens under a monotonically compressive load test and a repeated load test and found that, under different stress intensities and repeated loadings, the fractional change in electrical resistance is related to the measured strain. After examining the tensile and compressive behaviors of CFRC, Wen and Chung [1] proposed behaviors and failure modes for CFRCs under flexural loads and described the oblique direction and the thickness direction through the beam, resistance to strain, and damage to perception capabilities and studied the effects on the perception capabilities of embedded reinforcement in CFRC. The results showed that embedded reinforcement will improve the electrical resistance, because part of the current will flow through the bars. The results showed that the fractional change in electrical resistance of the tensile side increased by 40% and that the fractional change in electrical resistance of compressive side increased by 70%. Therefore, these changes will affect the estimation of strain.
Chiarello and Zinno [9] created cement-based composite materials containing carbon fibers. Using the correlation between the fractional change in electrical resistance and the damage indexes of the material, they found that the material had the ability to be self-sensing. They further discussed the impact of fiber content, fiber length, and other factors on this material. The results showed that when the carbon fiber content was less than 0.2 vol.%, similar to conduction paths (2) and (3) described in the literature [5], the conductivity rapidly increased as the fiber content increases. When the carbon fiber content was higher than 0.2 vol.%, similar to electronic conduction paths (3) and (4) according to the literature [5], increasing the carbon fiber content further did not more easily disperse it in the concrete. The improvement in resistivity of the conductive network formation will be reduced even with additional carbon fibers. The conductivity does not have a significant contribution, and thus all such materials have a conductivity threshold value of around 0.2 vol.%. However, increasing the length of the fibers will increase the conductivity, while reducing the fiber length increases the threshold value. Thus, increasing the length of the fibers can be used to achieve the desired conductivity. Chiarello and Zinno [9] also investigated the effects of using two-wire and four-wire electrode measurement methods. The measurement of electrical resistance included (1) contact resistance between the electrode and the test body and (2) the electrical resistance of the body to be tested. As confirmed by experiment, a two-wire electrode contact area has a greater influence on the electrical resistance than a four-wire electrode. Therefore, this paper uses a four-wire method to reduce measurement error as much as possible.
Chacko et al. [10] investigated the impact of age and moisture content on the electrical properties of CFRC and reported results showing that, within 28 days, resistivity increased rapidly with age. After 28 days, the growth of resistivity with time stabilized. The resistivity of CFRC of the same age increased with lower water content. Therefore, the effect of the moisture content on the test member must be considered for measuring the results of actual applications.
Considering the economic benefits, the fiber content is only 0.2 vol.%, which is less than half of the amount used in other studies, in order to clarify the capability of low carbon fiber content CFRC for strain measurement and damage detection. Furthermore, for practical application, the CFRC-coated beams and the RC portal frame experiments are demonstrated in this paper. In other words, the significances of this study are (1) to confirm the capability of low fiber content CFRC for strain measurement and damage detection and (2) to demonstrate the practical applications of CFRC for strain measurement in structure components (beams or columns).
3. Basic Mechanical Test Plan
This study had three main aims: (1) to explore the relationship between the fractional change in electrical resistance and strain for different types of specimens; (2) to understand the relationship between the fractional change in electrical resistance and measured strain; and (3) to investigate the capacity of CFRC for strain measurement and damage detection under tensile, compressive, and flexural loadings [11]. However, the factors that affect the conductivity properties of CFRCs include carbon fiber length and content [9], the test specimen's age and moisture content [10], and the resistance measurement method [9]. In order to reduce variations due to experiments, this research used a fixed diameter of 7 μm, length of 15 mm, and content of 0.2 vol.% for the carbon fibers. The specimens were tested for 28 days. The test specimens were placed in a room for 14 days and air-dried to reduce the impact of moisture on the measurement results for electrical resistance. Tests were performed at room temperature (25°C) in order to reduce the effects of temperature changes on the measurement results for electrical resistance.
3.1. Preparation of Materials
The design CFRC strength was set at 49.05 MPa, in order to measure the strain of high-strength concrete flexural members. The cement was blended Portland cement. Specimens were prepared from a mixture with the following composition: water-to-cement ratio (w/c) = 0.4; sand-to-cement ratio (s/c) = 0.75; 15% silica fume by weight of cement; 0.4% methylcellulose by weight of cement; and carbon fiber making up 0.2% of the total volume. The fiber diameter was 7 μm. The nominal fiber length was 15 mm. A standard mixing procedure was used. A rotary mixer with a flat beater was used for mixing. After pouring the mixture into oiled molds, an external electric vibrator was used to facilitate compaction and to decrease the amount of air bubbles.
3.2. Preparation of Specimens
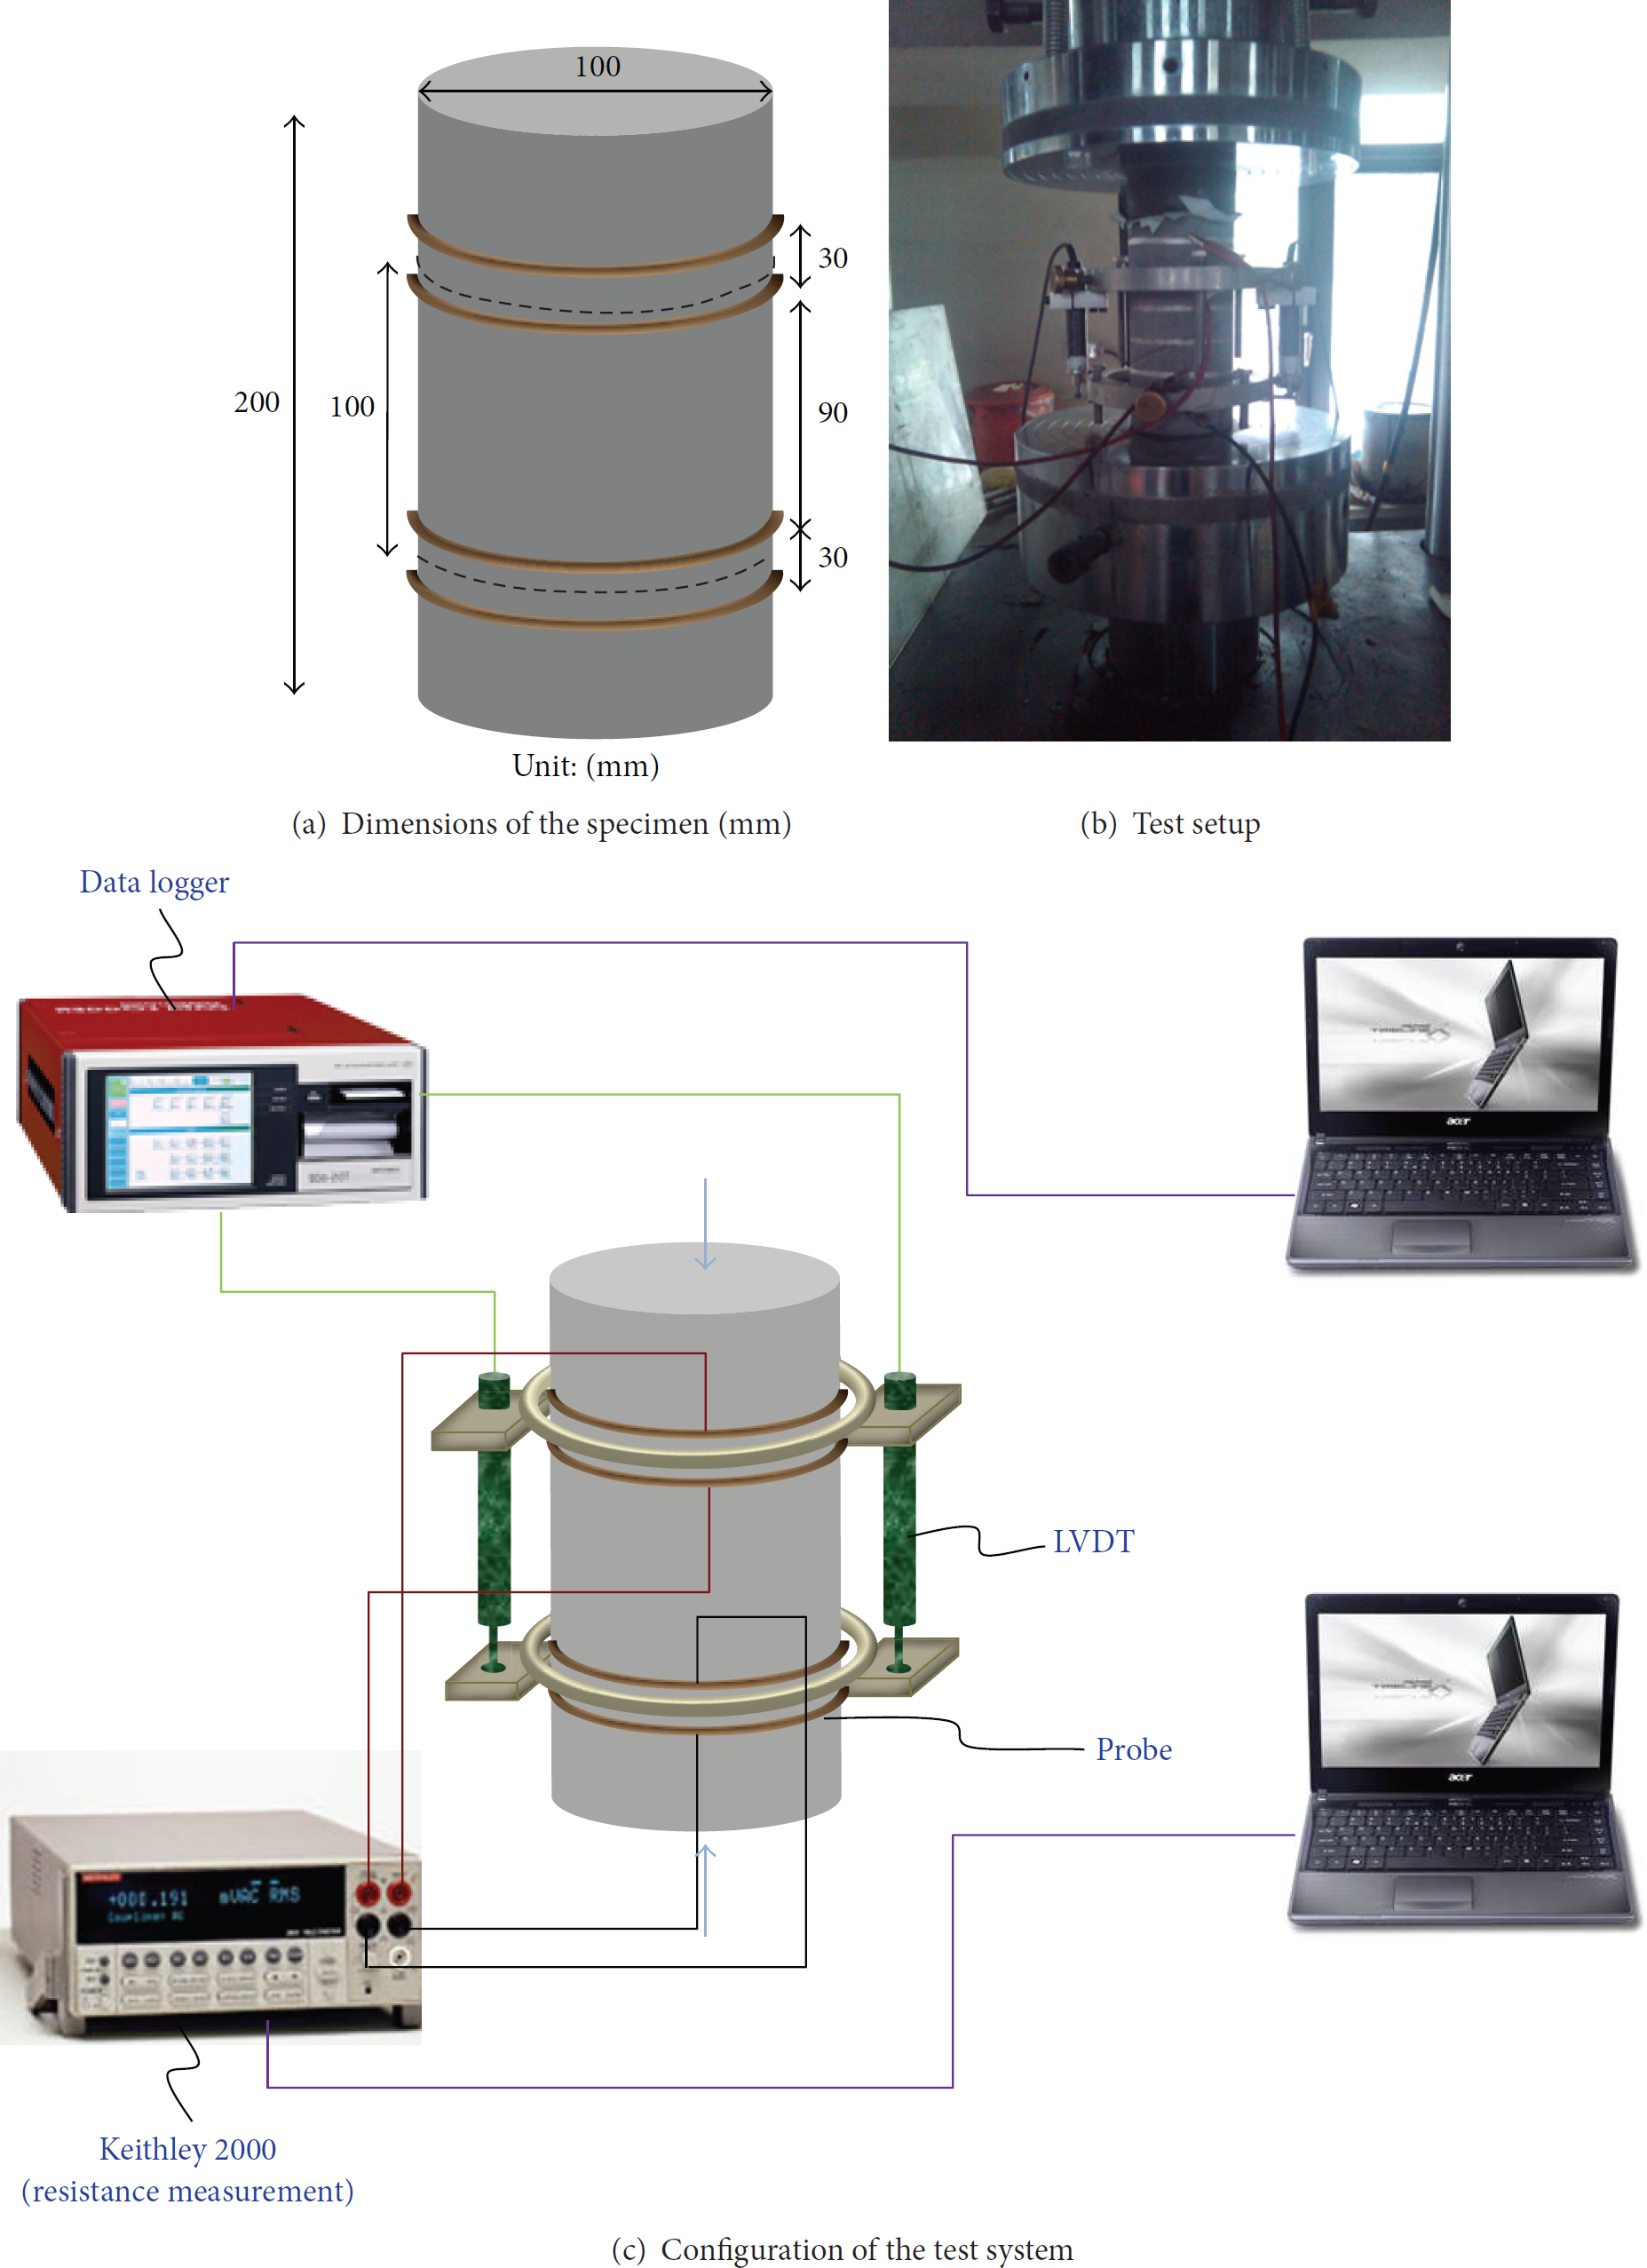
From the aforementioned concrete mixture, 5 CFRC dog-bone-shaped specimens, 4 CFRC cylinders, and 8 different styles of CFRC beams at 28 days of age were fabricated for testing. Dog-bone-shaped specimens with dimensions of 455 mm × 50 mm × 20 mm were prepared for uniaxial tension testing. Cylinders with dimensions of φ100 mm × 200 mm were prepared for uniaxial compression testing. Beam specimens with dimensions of 550 mm × 150 mm × 150 mm were prepared for three-point bending testing. The test setup is shown in Figures 1–3.

The uniaxial tension test.
The uniaxial compression test.

The three-point bending test.
3.2.1. Uniaxial Tension Test
In the uniaxial tension test, monotonic tensile loading was applied on the specimen (Figure 1). The tensile strain of the CFRC specimen was measured using an LVDT with a gauge length of 105 mm and using strain gauges with a gauge length of 30 mm. The electrical resistance measurements were made using the four-probe method, with silver paint in conjunction with copper wires for electrical contacts, and the electrode distance was 75 mm (Figure 1(a)). A Keithley 2000 digital multimeter was used to measure the electrical resistance of the specimens (Figure 1(c)).
3.2.2. Uniaxial Compression Test
In the uniaxial compression test, monotonic compressive loading was applied on the specimen (Figure 2). The compressive strain of the CFRC specimen was measured using an LVDT with a gauge length of 100 mm. The electrical resistance measurements were made using the four-probe method, with silver paint in conjunction with copper wires for electrical contacts, and the electrode distance was 90 mm (Figure 2(a)). The Keithley 2000 digital multimeter was used to measure the electrical resistance of the specimens (Figure 2(c)).
3.2.3. Three-Point Bending Test
In the three-point bending test, cyclical loading was applied on the CFRC beam specimen (Figure 3). The dynamic strain of the CFRC beam was measured using strain gauges with a gauge length of 30 mm, the central deformation was measured using an LVDT, and the electrical resistance was measured using the Keithley 2000 digital multimeter with a gauge length of 120 mm (Figures 3(a) and 3(c)).
4. Results and Discussion for the Basic Mechanical Tests
4.1. Uniaxial Tension Test
For the uniaxial tension test, the test results for the specimens at 28 days of age are shown in Figures 4–6. Figure 4(a) shows the relationships between the fractional change in electrical resistance (defined as

The fractional change in electrical resistance versus the strain measured by the LVDT.
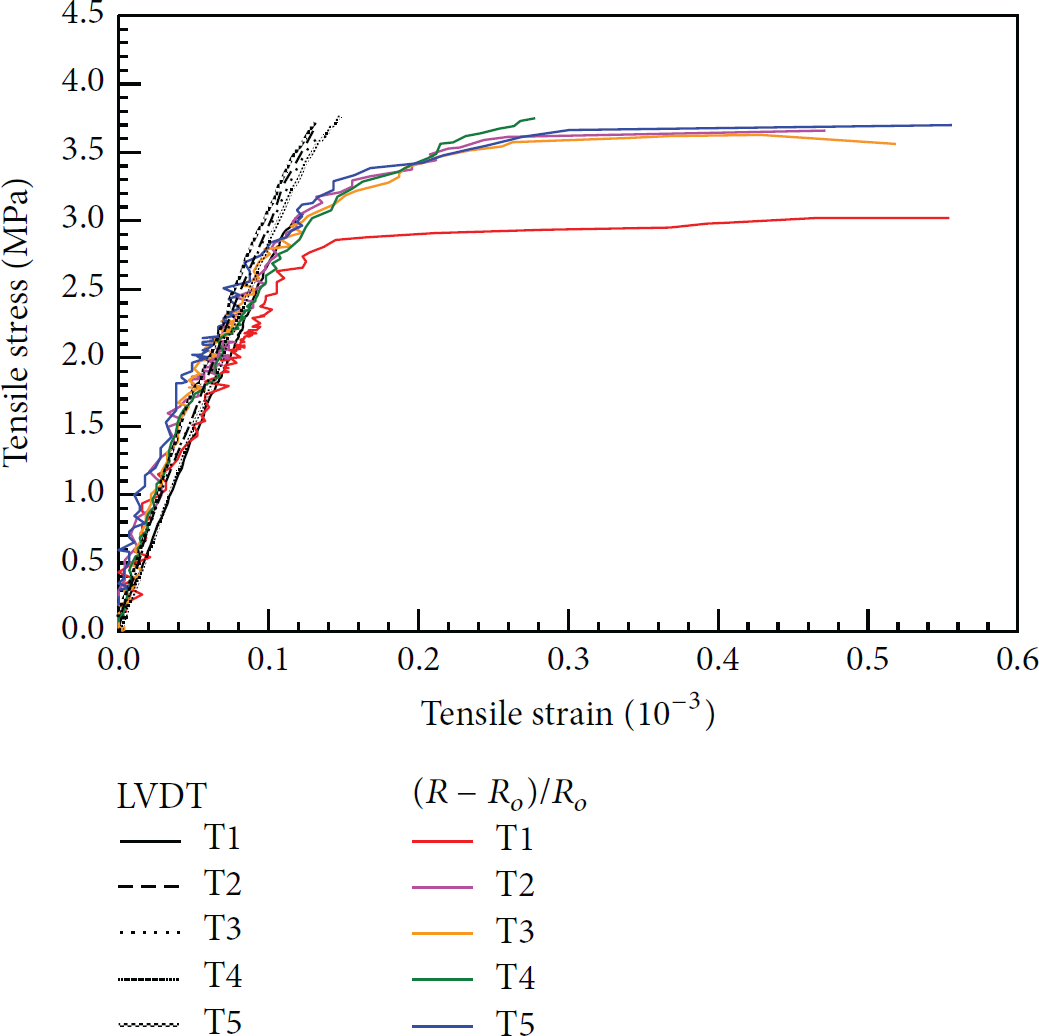
Variation of tensile stress with tensile strain measured by the LVDT and the CFRC.

Variation of tensile stress and fractional change in electrical resistance with tensile strain.
In order to relate the fractional change in electrical resistance to tensile strain, the gauge factor (GF) is defined as the fractional change in electrical resistance per unit strain. Before the proportional limit, there exists a strong linear relationship (
Figure 5 shows that the stress-strain curves are very similar before the proportional limits but have changes in slopes due to increases in electrical resistances when the tensile strains exceed the proportional limits. Based on the different behaviors of the fractional change in electrical resistance, three regions were identified: (1) region I: a linear region, allowing strain sensing via the fractional change in electrical resistance with a linear relationship and reversibility; (2) region II: a plastic region, allowing strain sensing via the fractional change in electrical resistance, retaining a proportional relationship and partial reversibility, owing to crack occurrence and damage accumulation in the specimen, although under a tensile strain these are not obvious; and (3) region III: a damaged region, where strain sensing via fractional changes in electrical resistance is impossible, owing to damage occurrence and material failure in the specimen. The fractional change in electrical resistance occurs very rapidly. Therefore, it can be used for damage detection.
Figure 6 shows the variation of tensile stress and the fractional change in electrical resistance with tensile strain. The fractional change in electrical resistance has a linear relationship with tensile strain in region I. The fractional change in electrical resistance rapidly decreases in region III (dark area in right hand side of Figure 6), because the electrical resistance increases quickly as a result of damage accumulation. The slope of the fractional change with tensile strain is a good indicator for damage detection under tensile loading.
The test results are summarized in Table 1. Before the proportional limit (where tensile strain is 1 × 10⁻⁴), there exists a strong linear relationship between the fractional change in electrical resistance and tensile strain, with
Results of the uniaxial tension test.

4.2. Uniaxial Compression Test
For the uniaxial compression test, the test results for the specimens at 28 days of age are shown in Figures 7–10. Figures 7(a) and 7(b) show the relationships between fractional change in electrical resistance of the CFRC and the strain measured by the LVDT at the middle portion of the specimens. Figure 7(b) shows the existence of a bilinear relationship between fractional change in electrical resistance of the CFRC and the strain measured by the LVDT in logarithmic scale before the proportional limit. Upon exceeding the proportional limit, the fractional change in electrical resistance decreases, owing to the increase of electrical resistance in the CFRC specimen caused by changes in microstructure, increases in microcrack density, and occurrences of damage.

The fractional change in electrical resistance versus the strain measured by the LVDT.

The fractional change in electrical resistance versus the strain measured by the LVDT in the linear regions.

Variation of compressive stress with compressive strain measured by the LVDT and the CFRC.

Variation of compressive stress and fractional change in electrical resistance with compressive strain.
There exists a bilinear relationship between fractional change in electrical resistance and compressive strain in logarithmic scale before the proportional limit. Figure 8(a) shows the relationship of the fractional change in electrical resistance to compressive strains smaller than 2 × 10⁻⁴, and the gauge factors of the C1 to C4 specimens, where C means the compression test and 1–3 mean the specimen number, are approximately 200 to 250. Figure 8(b) shows the relationship of the fractional change in electrical resistance to compressive strain between 5 × 10⁻⁴ and the proportional limit, and the gauge factors of the C1 to C4 specimens are approximately 20 to 30. The similarity between fractional change in electrical resistance and compressive strain in the uniaxial compression tests indicates that the CFRC can be used as a self-sensing material for strain measurement within the proportional limit.
Figure 9 shows the variation of compressive stress and fractional change in electrical resistance with compressive strain. The fractional change in electrical resistance has a linear relationship with compressive strain in region I and region II. GF1 and GF2 were used for compressive strain measurement. Figure 10 shows that fractional change in electrical resistance rapidly decreases in region III (dark area in right hand side of Figure 10) because the electrical resistance increases quickly as a result of damage accumulation. The slope of fractional change with compressive strain is a good indicator for damage detection under compressive loading.
The test results are summarized in Table 2. Before the proportional limit (at a compressive strain of 2.57–3.25 × 10⁻⁴), there exists a strong bilinear relationship between fractional change in electrical resistance and compressive strain, and
Results of the uniaxial compression test.

4.3. Three-Point Bending Test
The results of the three-point bending test for specimens at 28 days of age are shown in Table 3. There are several types of specimens in Table 3, including a pure CFRC beam without steel reinforcement (P), a pure CFRC beam with steel reinforcement (PS), a concrete beam coated with a thickness of 12 mm CFRC layer without steel reinforcement (Co), and a concrete beam coated with a thickness of 12 mm CFRC layer with steel reinforcement (CoS).
Results of the three-point bending test.

Figures 11(a) and 11(b) show the loading protocol, fractional change in electrical resistance, and strain measured by strain gauges at the top and bottom of the CoS3 specimen. Figures 12(a) and 12(b) show the relationships between fractional change in electrical resistance of the CFRC and the strain measured by strain gauges at the top and bottom of the CoS3 specimen. According to the data, there exists a linear relationship between fractional change in electrical resistance of the CFRC and strain measured by the strain gauges before the proportional limit. When the proportional limit is exceeded, the fractional change in electrical resistance increases (tension side) or decreases (compression side) as a result of the increase of electrical resistance in the CFRC specimen caused by changes in microstructure, increases in microcrack density, and occurrences of damage.

Test results for the CoS3 specimen.

Test results for the CoS3 specimen, showing fractional change in electrical resistance versus strain measured by the strain gauges.
In Table 3, for the pure CFRC beams, the strains in the tension and compression sides of the P specimens are smaller than those of the PS specimens, but the electrical resistance (
5. RC Portal Frame Push-Over Experiment
The practical application of pier strain measurement in the reinforced concrete (RC) portal frame push-over test was based on the results of the basic mechanical tests on the CFRC. Columns were found to perform in accordance with existing highway bridge seismic design specifications, the material strength was found to be in accordance with the general requirements of RC strength and did not exceed 41.20 MPa, and the reinforcement strength was found to meet the relevant CNS-560 SD280W and SD420W regulations. These results indicate the feasibility of using CFRC for strain measurement of the RC portal frame.
5.1. Experiment Plan
5.1.1. Specimen Design
The experimental plan includes a double-column framed pier, shown in Figure 13, denoted as RCF (Reinforced Concrete Frame). In the experimental field, the P1 column is located on the south side and the P2 column is located on the north side of the RCF. The clear span and clear height of the RCF are both 400 cm and the columns use square cross section and have dimension of 60 cm by 60 cm. The longitudinal reinforcement of the RCF configuration is 16-D25 steel with a reinforcement ratio of approximately 2.3%. The reinforcement in each column is D14 @ 10 cm within the upper and lower plastic hinge zones of the rectangular cross section of 1.5 times the depth range configuration closed stirrups and tie bars, transverse reinforcement, and core concrete volume ratio of approximately 2.4%. However, the nonplastic hinge zone transverse reinforcement spacing was relaxed to 14 cm.
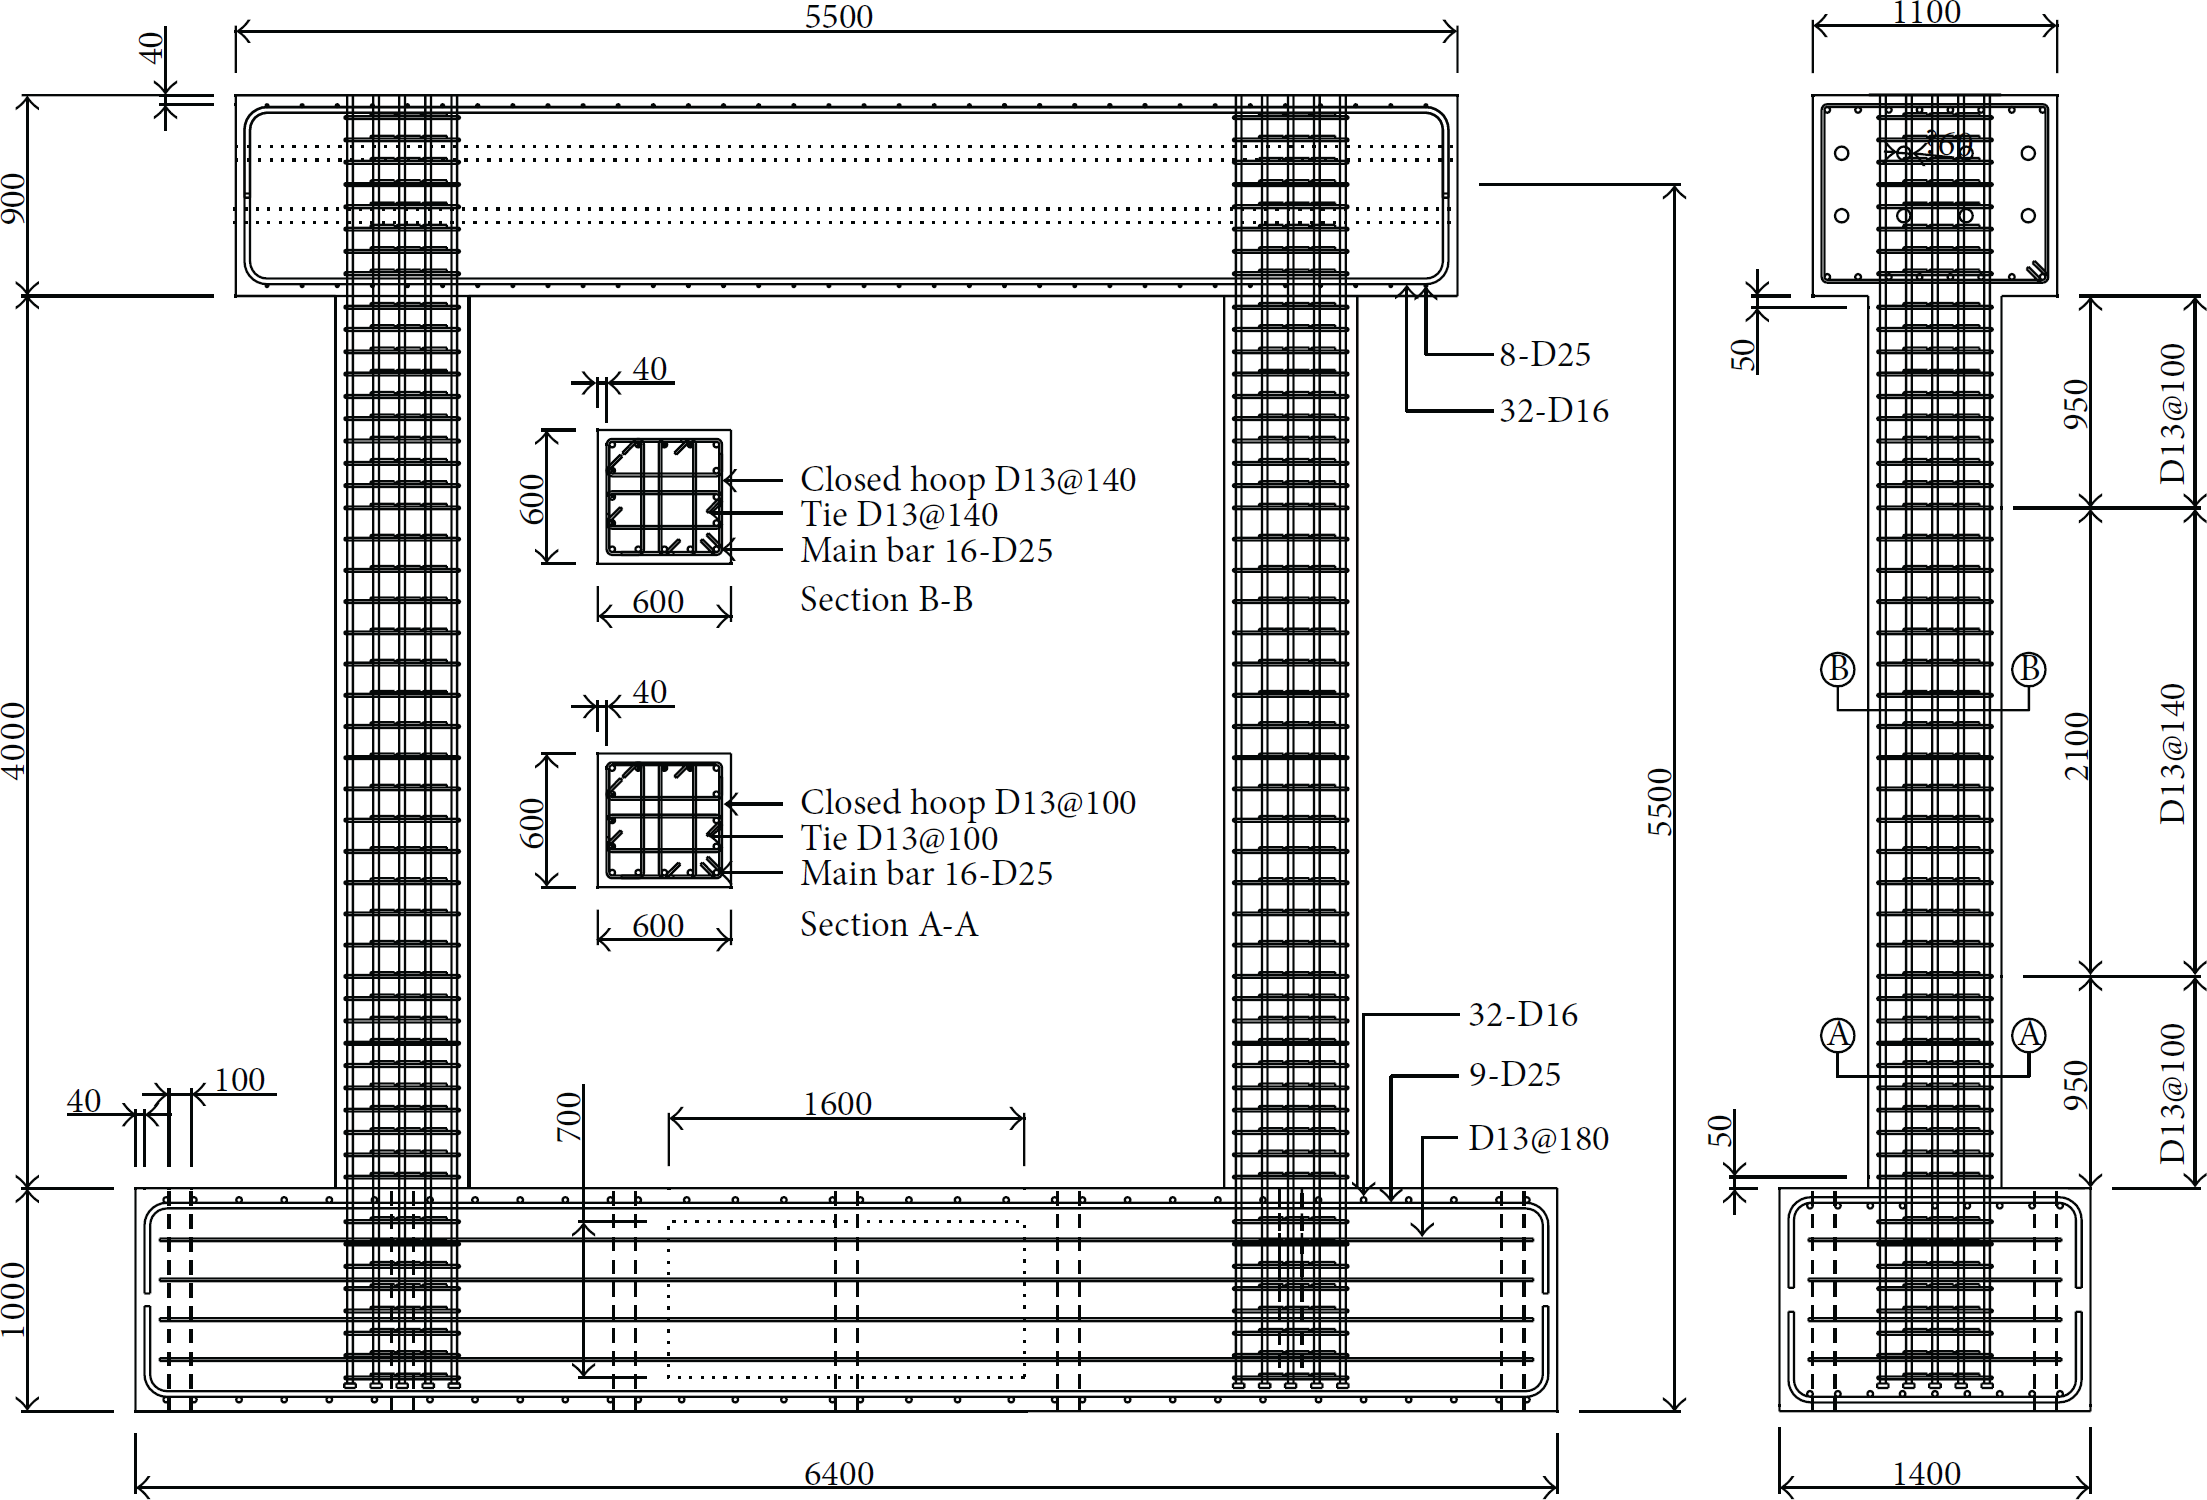
Design drawing of the RCF specimen.
5.1.2. Material Properties
The material properties of the RCF specimen are as follows: the concrete compressive strength is 42.2 MPa, the longitudinal reinforcement yield strength is 521 MPa, the transverse reinforcement yield strength is 335 MPa, and the concrete compressive strength exceeds 41 MPa, so it is a high-strength concrete.
5.1.3. Specimen Configuration and Loading Protocol
Figure 14 shows the configuration of the experimental test setup, including the steel bracing system, vertical force loading system, lateral force loading system, and test specimen. The vertical force loading system consists of two sets of hydraulic pumps, two axial force beams, and four 69 mm diameter high-strength screw combinations, which can provide a relatively stable axial force. Displacement control was applied in repeated push-over experiments. Firstly, a vertical load was applied to the top of the column. The design axial force for the columns of the RCF was
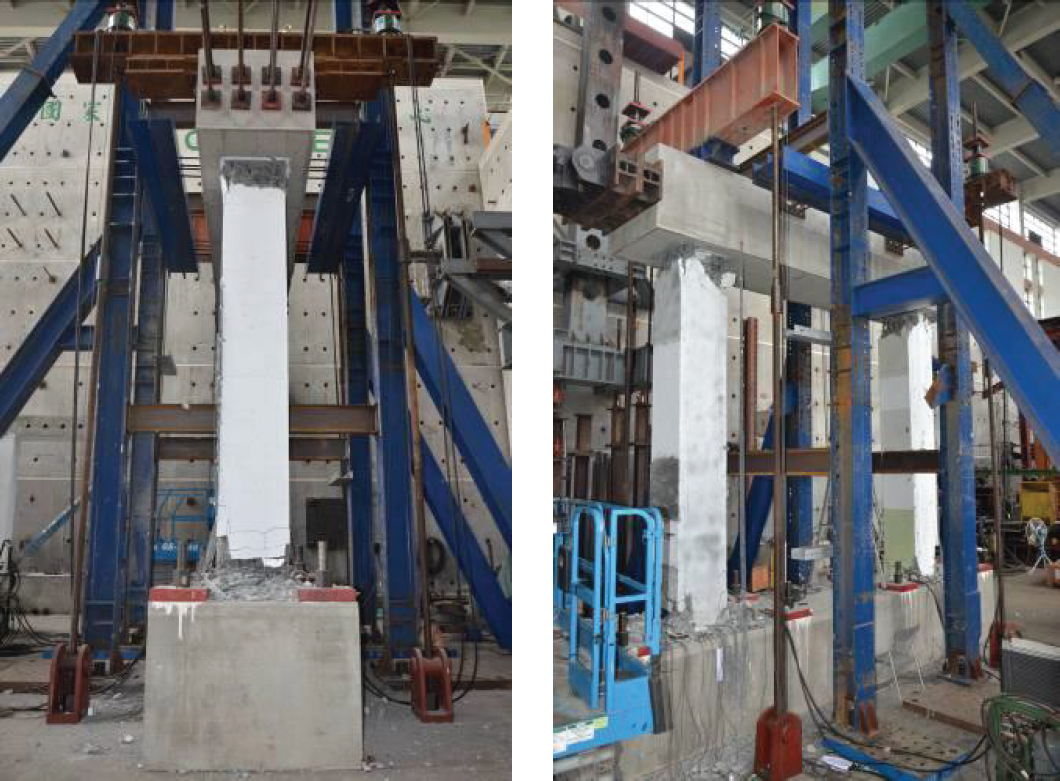
Test setup for the push-over experiment.
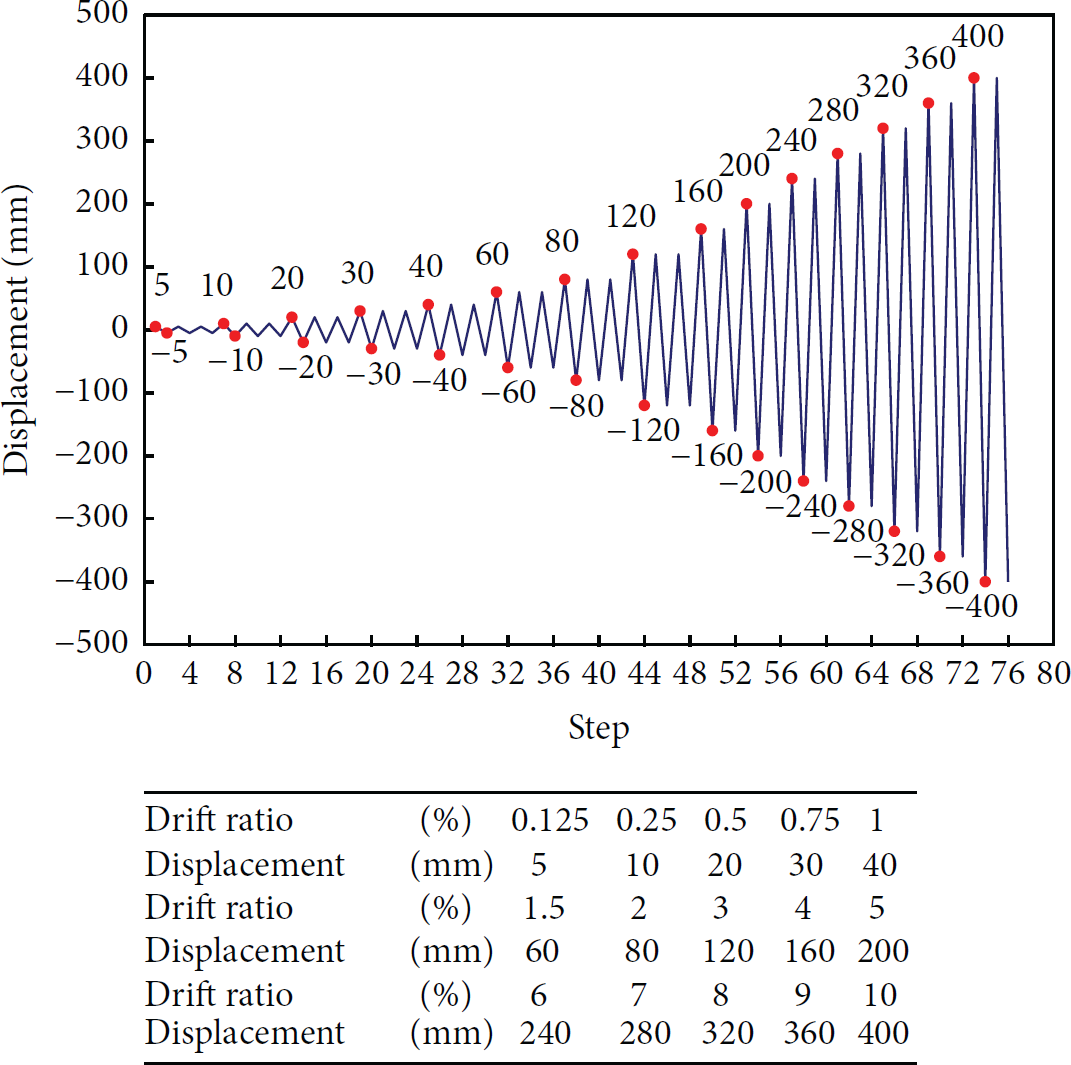
The target displacement and force steps.
5.1.4. Strain Measurement via CFRC
The bottom of the P1 column on the south side was selected as the strain measurement region. The CFRC at this region was 600 mm in both length and width, and the thickness of the CFRC-coated layer was 12 mm. Figure 16 shows the four-wire method used for electrical resistance measurement, where the electrode length was set to 150 mm and the electrode distance was set to 120 mm. The configuration was the same as for the three-point bending test for CoS beams in Section 3.2.3. Three positions were selected for the electrodes, and three strain gauges with a gauge length of 10 mm were set: CH-1, CH-2, and CH-3. After an initial measurement of the electrical resistance of the three regions, the middle portion was selected for the final experiment. The force, displacement, and strain were simultaneously recorded at the three strain gauges, and the change in electrical resistance was then related to the fractional change in electrical resistance versus strain using GF.

Test setup for strain measurement of CFRC.
5.2. Results and Discussion for Strain Measurement via CFRC
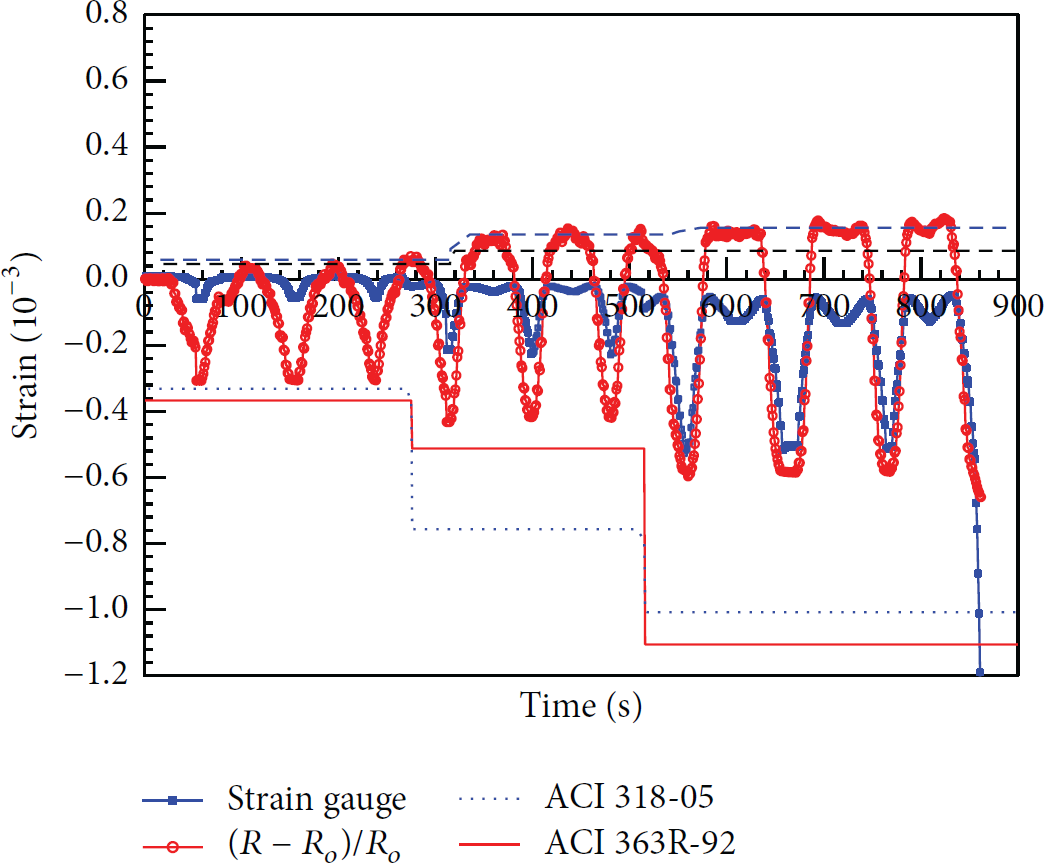
Figure 17 shows the relationship between the strains measured by the strain gauges and the fractional change in electrical resistance with time. The measurement began with lateral displacement of 5 mm (

Variation of strain and fractional change in electrical resistance with time.
Comparison of strain measured by the strain gauge and strain measured by the CFRC.
Figure 18 shows that the strain measured by the strain gauge (CH-3) and the strain measured by CFRC versus time both tend toward the same variation, within the lateral displacement of the three loops of 20 mm. When the bottom of the column was under compression, under the lateral displacements of loops of 5 mm, 10 mm, and 20 mm, the strain gauges and CFRC could measure the strain on the compression side. However, the CFRC proved to be more sensitive than the strain gauges. The maximum amount of compressive strain was approximately 5.9 × 10⁻⁴ under the lateral displacement of three loops of 20 mm. When the bottom of the column came under tension, the strain gauges almost could not measure the strain on the tension side. The reason is that the strain gauges were not located at the position of the occurrence of maximum tensile strain and therefore lost the sensitivity to measure tensile strain. Nevertheless, the CFRC has a higher sensitivity than the strain gauge. The maximum amount of tensile strain was approximately 1.7 × 10⁻⁴ under the lateral displacement of three loops of 20 mm. According to the formula of ACI 318-05 [12] and ACI 363R-92 [13], the concrete at the bottom of the column should be cracking at this moment.
As the lateral displacement of the column continued to increase to 30 mm, cracks occurred between the CFRC-coated layer and the column surface. At this moment, the fractional change in electrical resistance did not vary and the CFRC lost the capacity for strain measurement. As the lateral displacement of the column continued to increase, peeling and collapse occurred between the CFRC-coated layer and the column surface. The issue of bonding between the CFRC-coated layer and the column surface is an issue that must be overcome in future research on the use of CFRCs for strain measurement.
6. Conclusion
The experimental results of the uniaxial tension test, the uniaxial compression test, and the three-point bending test showed that the conductivity of the materials is significantly improved and that CFRC can be used for strain measurement and damage detection with a fiber content of only 0.2 vol.%. This is less than half the amount (0.48 vol.%) used in previous literature.
According to the uniaxial tension tests, the similarity between the fractional change in electrical resistance and the tensile strain indicates that the CFRC can be used as a self-sensing material for strain measurement within the proportional limit. The slope of fractional change with tensile strain is a good indicator for damage detection under tensile loading.
According to the uniaxial compression tests, the similarity between the fractional change in electrical resistance and compressive strain indicates that the CFRC can be used as a self-sensing material for strain measurement within the proportional limit. The slope of fractional change with compressive strain is a good indicator for damage detection under compressive loading.
According to the three-point bending test, the gauge factor of a CFRC-coated concrete beam with steel reinforcement is greater than that of a CFRC-coated concrete beam without steel reinforcement and a pure CFRC beam with or without steel reinforcement. Moreover, the experimental results for the coated beams can form a database for future applications.
The strain gauges and the CFRC could both measure the strain on the compression side of a reinforced concrete portal frame, but the CFRC was more sensitive than the strain gauge. The strain gauges almost could not measure the strain on the tension side, but the CFRC had good accuracy and a higher sensitivity. The self-sensing of tensile strain and compressive strain and damage detection were more effective in the CFRC under different loadings. Therefore, the self-sensing ability of CFRC, as shown by the sensing of strain and damage detection, has been demonstrated.
In summary, the capability of low carbon fiber content CFRC (0.2 vol.% fiber content) for strain measurement and damage detection was confirmed, and the practical application of CFRC for strain measurement of an RC portal frame was demonstrated in this paper.
Footnotes
Conflict of Interests
The authors declare that there is no conflict of interests regarding the publication of this paper.
Acknowledgment
This work was supported by the National Science Council of Taiwan, under Project no. NSC 99-2221-E-002-164-MY2.