
Abstract
Nowadays, vehicular ad hoc network (VANET) has attracted more and more attention due to its various applications to improve the road traffic safety and efficiency. So there were plenty of exploration work and merit on the intervehicle communication, routing, and data forwarding, but it is not easy to design the efficient routing and data forwarding algorithm, because it is hard to understand the dynamic evolution of its network topology due to the fast movement of the vehicles in the network. While the network evolution structure is the key to design the optimal data forwarding strategy, hence, in this paper, we will analyze the dynamic evolution of topology characteristics based on the real data collected by the GPS devices installed on vehicles and then model the network evolution by the dynamic topology characteristics. In the end, we analyze and verify the efficiency of our model by theoretical deductions and simulations, and our model will be helpful to find more efficient routing algorithm and build the more trustable simulator of VANET.
1. Introduction
Nowadays, traffic problem is becoming more and more urgent to be solved in developed and developing countries. As we know, the vehicular ad hoc network (VANET) as one special application of mobile ad hoc network (MANET) can transfer the data among the wireless devices installed on vehicles, so it can be applied to the transportation problem and improve the road traffic safety and efficiency, such as transportation information collection, transportation warning, and on-road information of vehicles [1, 2]. Hence, there are many research works arising in a few years.
Intervehicle communication (IVC), as one of the concrete applications of VANET, has attracted more and more research attention from both the academia and industry due to its help to Intelligent Transportation System (ITS). One of the earliest studies on IVC was started by JSK (Association of Electronic Technology for Automobile Traffic and Driving) of Japan in the early 1980s. Later, well-known research results on platooning have been demonstrated by California PATH [3] and Chauffeur of EU [4]. California PATH as the first research program in North American that focuses on ITS is still going on and getting more and more merits. Recently, the transmission of information about incidents, emergencies, or congestion from preceding vehicle(s) to vehicles following behind also became an important application of IVC. The European Project CarTALk 2000 tries to solve problems related to driving safety and comfortable driving based on IVC [5]. Recently, IETF proposed the communication standard WAVE (Wireless Access in Vehicular Environments, or called IEEE802.11p) based on the IEEE802.11. Also more research communities appear, such as VII [6] and C2C-CC [7].
Although there are many research results on network infrastructure, routing, and MAC protocol, there is lack of the research on the modeling of the dynamic evolution of VANET, which is the goal of this paper. The rest of the paper is organized as follows. Firstly, we will give some related work in Section 2 and give some preliminary related to our model in Section 3. The theoretical deductions on efficiency of our model are arranged in Section 4. Section 5 gives the simulations of our model on network structure, topology characteristics, especially degree distribution, and clustering coefficient. Section 6 concludes the paper and points out some future work.
2. Related Work
We can make the performance analysis of the protocols more accurate if we can model the VANET accurately. In previous works, Ho et al. focus on the connectivity of the nodes [8], and Fiore and Härri gave more results on the topology characteristic of the network such as degree distribution of the nodes, the duration of the node connected, clustering coefficient, and the size of the clusters [9]. Lan and Chou generated the real scenario by the simulator SUMO and proved the influence of the traffic light and driver behavior [10]. But they did not consider how to model the dynamic evolution of VANET, and most of the above work analyzes the network structure microscopically like mobility model or single topology characteristics, lack of the dynamic analysis, or how to model the dynamics evolution of the network. However, it is important to model the dynamic changes and dynamic evolution of the topology structure which can affect the choice of routing algorithm and data forwarding and then affect the communication efficiency of the network.
Now, complex network is becoming one of important tools to analyze the topology structure of all kinds of networks and called “new science of networks” [11]. Gao et al. early applied complex network to get the topology characteristics of the public transportation network and pointed that the network is scale-free [12]. Yang built the public transportation network model by applying the complex network [13]. These works show the efficiency of complex network to analyze and model complex system. In this paper, we will also analyze the VANET macroscopically based on the complex network and then build the model to show the dynamic evolution of VANET, which will become the basis to design the more trustable simulator and more efficient routing algorithm.
3. Preliminary
In VANET, the node moves fast and frequently, so the topology structure is open and dynamic; it is the key and the challenge to build the model for VANET. How to model the adding of the nodes, how to generate the dynamic network, and how to build a realistic model? We will use the methods and the models in the complex network theory.
We will firstly use the real data to analyze the topology characteristics during the different time zone, including the rush hours and nonrush hours, in order to get the influence of the car flows on the changes of the network topology. Secondly, we get the dynamic evolution on each topology characteristic. Lastly, we will build one dynamic network model for VANET based on the topology characteristics and complex network theory.
Actually, we gave some results in the previous work. We simply analyzed the influence of node density and transmission radius to network connectivity [14], and based on this result, we further designed one reliable routing algorithm, considering the node density and the road length and applying the greedy strategy, and the simulations in this paper show the efficiency of the algorithm [15]. It proved that the topology analysis is important to design efficient routing algorithm in the real scenario. So the authors continue the work and build one growth model [16]; this model is scale-free, having high clustering coefficient.
In this paper, we will use the similar method applied in our previous work, but the dynamic model of VANET under the city scenario is very different from the growth model. Growth model actually is one static model and shows network structure at moment, but dynamic model is to show the dynamic change of the network, so it is one challenge. We will also consider the dynamic of the nodes in the network, the dynamic of the topology structure, and the influence of them on network performance.
We assume the network is modeled as one undirected graph G, and the communication transmission radius is R; two nodes can communicate if and only if the distance between them is no greater than R. We will firstly get the dynamic of the node degree distribution, clustering coefficient, and their influence on the dynamic of the network structure by analyzing the real data.
3.1. Dynamic Traffic Flow Characteristics
It is well-known that the traffic flow density and the traffic flow distribution are two important factors affecting the network model of VANET. In traffic flow theory, we can use congestion level to show that, so we will analyze the congestion levels during the different time zones.
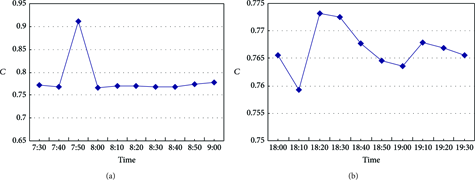
Figure 1(a) shows the congestion level during the rush hours in the morning, and the congestion level reaches the peak at 7:30 and gradually reduces. Figure 1(b) shows the congestion level around the noon, and the congestion level firstly changes from lower to the peak and then down gradually, but the peak value is obviously lower than in the morning. Figure 1(c) shows the congestion level during the rush hours in the afternoon, and the congestion level firstly changes from lower to the peak and then goes down suddenly and then goes up quickly and gradually goes down after a while, but the peak value is also lower than that in the morning.

Congestion levels during different time zones.
3.2. Dynamic Connectivity of VANET under City Scenario
We use graph to model VANET obtained by the real data, and let s be the source node and let r be the destination node. We will analyze the connectivity of VANET under city scenario. Because it is hard to guarantee VANET to be 1-connectivity, we use the ration of the size of the maximum connected component and the size of the network to define connectivity ration. Figure 2 analyzes the connectivity of the network and its dynamic, and it shows the connectivity keeps within 40% and 60% when the communication range is 400 m.

Connectivity ratio of the network.
3.3. Dynamic Evolution of the Topology Characteristics of VANET
3.3.1. Degree Distribution
We proved the degree distribution of the VANET follows power law at some moment in [16], and now we will analyze the evolution of the degree distribution. Figure 3 shows that the degree distributions of the network follow power law with the different time during the rush hours.

Degree distribution during rush hours when
3.3.2. Mean Degree
We use

Evolution of mean degree during rush hours when
3.3.3. Clustering Coefficient
Figure 5 shows the network having high clustering coefficient, and the clustering coefficient is independent of the congestion level when comparing with Figure 1. Figure 6 shows that the clustering coefficient of the network is independent of the communication range as well.
Evolution of clustering coefficient during rush hours ((a) in the morning, (b) in the afternoon) when

Evolution of clustering coefficient during rush hours ((a) in the morning, (b) in the afternoon) with different communication ranges.
4. Model
We will build our model by applying the topology characteristics and the corresponding models in complex network theory. In complex network theory, topology characteristics are the basis to build the network model, but how to generate the corresponding network is the key. The researchers complete that by applying different mathematical methods. We will use similar methods to build our model.
4.1. Initialization
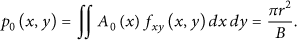
We will firstly get one initial station of the network. In order to improve the reality, we set n sets with size

Secondly, we can get the edges in one set by Euclidean distance between any two nodes. Actually, one set is corresponding to one subgraph in network. Assuming the communication range is r and there is one edge between any two nodes if the distance between them is no greater than r, then, we can get the edges between different subgraphs. Let the area of one subgraph
In the beginning, the total edges among all subgraphs are

4.2. Dynamic Evolution Model of the Network
The network will change with the time, and some nodes (edges) are added, and some nodes (edges) decrease, so we show the dynamic evolution of the network with different cases.
4.2.1. Adding Nodes (Edges)
Case 1 (simulating the process of adding nodes and edges within one subgraph).
Add one node u with probability

Case 2 (adding edges among different subgraphs).
Choose one subgraph
Case 3.
Choose
4.2.2. Deleting Nodes (Edges)
Case 1.
Delete one node with probability
Case 2.
Delete w edges with probability
Apply all the steps above one time during each evolution period, and adjust the value of probability on demand.
4.3. Verification of Our Model
Firstly, we will give the mathematical deduction from the degree distribution and clustering coefficient of the network. Let the amount of the edges be
We can get 5, 6, and 7 from Case 1, Case 2, Case 3 when adding nodes or edges, respectively:
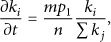
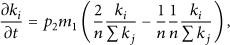

Similarly, we can get 8 and 9 from Case 1 and Case 2 when deleting the nodes:

Combining the equations from 5 to 9, then we can get

Because

Because we add

We know that

Let
We can get

Let


Assuming the time is equal-interval, then we can get

Hence,
Now, we finished the degree distribution derivation and next we will get the theoretical derivation of clustering coefficient.
Because

5. Simulations
5.1. Degree Distribution
At first, we set the parameters

Simulations on degree distribution and mean degree of our model.
5.2. Mean Degree
At first, we set the parameters
5.3. Network Topology
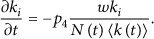
In order to prove that our model can show different network structures, we simulate the network topologies by the following three cases.
Case 5.
Set
Network topologies from high congestion level to lower congestion level of our model generated.
Case 6.
Set
Case 7.
Set
5.4. Clustering Coefficient
At first, we set the parameters
Figure 7(a) shows that the network obtained by our model follows power law with different parameters, and Figure 7(b) shows that the mean degree of network obtained by our model is hardly changed. Figure 8 shows that we can get the different network topologies at the different congestion level by adjusting the parameters, so our model can show the dynamic evolution of the network on demand. Figure 9 shows that the clustering coefficient of our model is higher. So all of the simulations tell us that our model is good to simulate the real world and has the same topology characteristics as our statistics result obtained by the real data in Part 3.

Simulations on clustering coefficient of our model.
In our model, we use the topology characteristics and the corresponding models in the complex network theory and successfully build the dynamic evolution model of VANET. Furthermore, in order to improve the truth, we can adjust the parameters to make the topology structure change freely; we can add nodes, add edges, delete nodes, and delete edges with some probability on demand. And we not only consider the topology characteristics, but also consider the connections within one subgraph, and the connections among the different subgraphs, respectively. Hence, our model is useful to show the real VANET under the city scenario and is helpful to build the truer simulator and to design the more efficient routing algorithm.
6. Conclusion
Complex network theory is one new research field, which can abstract the real world to complex network, explore the character of the complex system or complex network, and find the inner law corresponding to the phenomenon in the real world. So it will be one good tool to research complex system. And there are some works obtained by applying complex network theory into complex system such as Internet, public transportation, collaboration network. That hints that it is possible to apply complex network theory to VANET and model the topology structure and the dynamic evolution of VANET. Indeed, we build the model of VANET by analyzing the topology characteristics of VANET and their dynamic evolution and applying the models in complex network theory, and we also show that our model is efficient from theoretical deduction and simulations. In the future, we will apply the method and complex network to social networking and analysis of big data.
Footnotes
Conflict of Interests
The authors declare that there is no conflict of interests regarding the publication of this paper.
Acknowledgments
This work is supported in part by the China NSF grants (61003224, 60902053, and 61001068).