
Abstract
As one of the largest civil engineering systems in China, the network of high-speed railway expanded fast in the last decade. The safety of railway operation is of great concern for the whole country. Railway track irregularity is a potential threat to safety of operation and comfort of passengers, and remains a challenging issue for researchers and engineers. Currently, track irregularity data are recorded by various sensors in the comprehensive inspection cars in China. To reveal relations between the operation of high-speed trains and the track geometry, the data mining and random modeling of track irregularity are needed. In this paper, different methods to evaluate the track irregularities are presented at first. A case study of a section in Beijing-Guangzhou high-speed railway is studied using the Karhunen-Loève expansion. Track geometries that are a representation of this railway network are generated along with statistical and frequency validations. As an application based on generated random track geometries, accelerations of train body under different traveling velocities are calculated and analyzed using a simulation model.
1. Introduction
As a potential threat to safety of operation and comfort of passengers, surveillance of train-track vibration remains an important work for the railway management. Rail irregularity, with its random nature, is a critical factor that causes the vibration in the train-track interaction system. Modeling and evaluation of track irregularity have been a subject of great interest in the field of mechanical and civil engineering, especially after high-speed railways begin to develop rapidly. China, as the most populous country in the world, also has the largest network of high-speed railway. As of December 2014, over 19,000 km of high-speed railway is in service. Operation maintenance of such a long linear infrastructure in order to reduce the malfunctioning risks and keep a satisfying safety level is challenging railway engineers and managers.
Currently in China, comprehensive inspection trains (CIT) are developed for monitoring the quality of track. Track irregularities along the railway line are recorded by various sensors in a measurement system located under the CIT carriage, as shown in Figures 1 and 2. It includes inertial measurement module and camera-laser module. Inertial measurement module contains vertical accelerometer, lateral accelerometer, roll gyroscope, and yaw gyroscope, providing the inertial reference for measuring. Camera-laser module measures the location and the shape of both tracks. Typical measurement interval for track irregularities is 0.25 m. At each measurement point, seven types of track irregularities (vertical irregularity, alignment irregularity, gauge, cross-level irregularity, warp, vertical acceleration, and lateral acceleration) are recorded, processed, and stored by computers onboard.
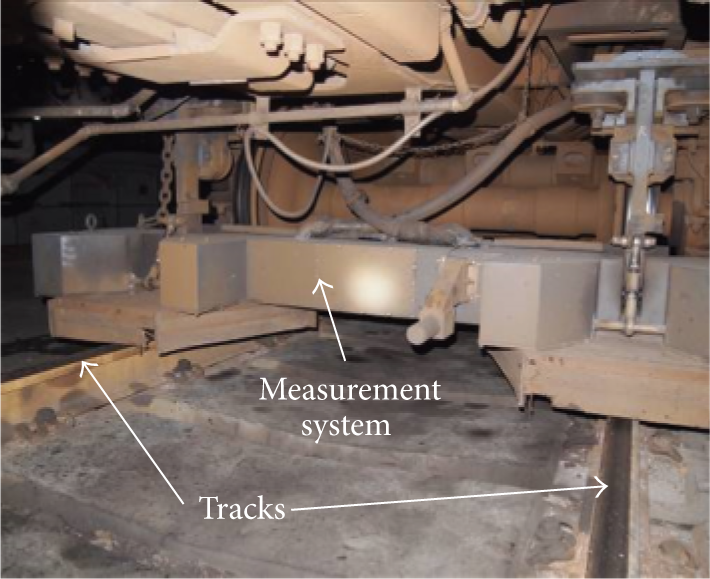
Location of the measurement system.
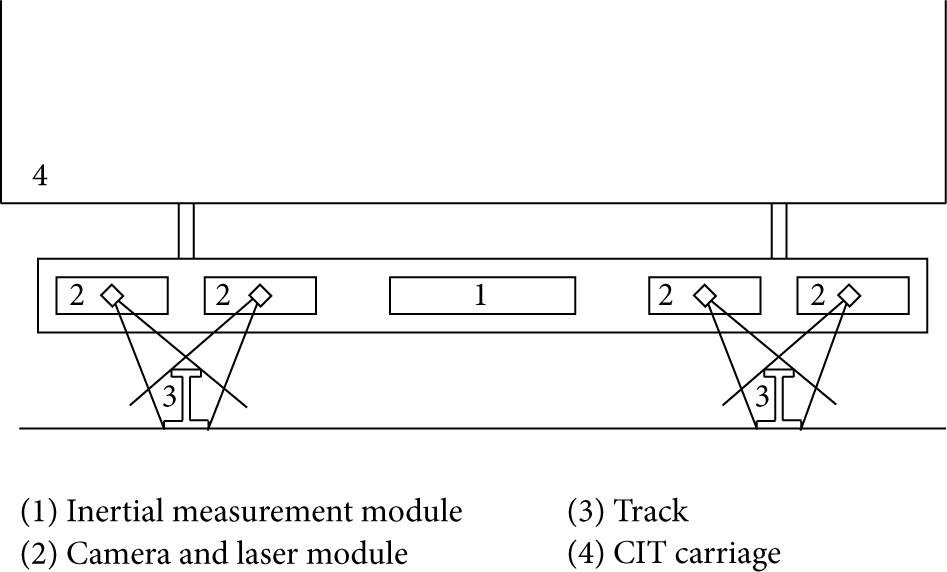
Configuration of the measurement system.
Time domain analysis is performed to assess the overall quality and critical risky point of the track system. Mean value and standard deviation of irregularities are recorded and analyzed and are compared to threshold values of different maintenance standard [1]. Scoring method and track quality index (TQI) method are extensively used in management of railway in China now. The common ground of them is that both methods are based on time-domain characteristics of the track irregularity data, which make them easier to use. However, the analysis and data mining of this mega record are inefficient. Since the current evaluation methods do not consider the frequency domain properties of track irregularities, influences of different frequency components of track irregularity are completely ignored.
Researches were carried out to study the properties of track irregularity on conventional and high-speed railways, with both time and frequency domain analysis. As a widely used method, power spectral density (PSD) of the random track irregularities is calculated as a statistical characterization [2–4]. Random field theory along with the level crossing theory was also used to analyze a section of Indian railway; models of Gaussian vertical and lateral track irregularity data are established. Peak values in a given track section can be predicted by this model too [5–7]. High-speed railway in China has been studied extensively in the last decades. Test data from Beijing-Tianjin Inter-City Railway was analyzed on the frequency domain. Track irregularities with different wavelengths components were presented and compared with the German railway. It indicates that some periodic components can be expected in track irregularity data, for which the current method does not consider [8]. Track irregularity standard deviation time series data and the characteristics and trend changes of track state are studied by applying clustering analysis, and this method can be used to predict the changes of TQI and state of the track [9, 10]. Track irregularities of Beijing-Shanghai high-speed railway are also extensively analyzed. Sections of this high-speed railway with Gaussian nature can be modeled by using the level crossing theory, but this method cannot solve the non-Gaussian random process [11]. Furthermore, the train-track system can be modeled in simulation model using SIMPACK software based on the irregularity data [12] or by pseudoexcitation method [13].
To have a deeper understanding of track irregularity properties, more general description is required. Principal component analysis (PCA) is a useful statistical tool to be applied, for both linear and nonlinear random system. One of the applications of PCA, Karhunen-Loève (KL) expansion, is a representation of a stochastic process as a combination of deterministic orthogonal functions and a set of uncorrelated random variables. It allows the projection coefficients of a random process on the K-L vector basis. This approach is useful when the random process is found neither Gaussian nor stationary, in which case the level crossing theory approach cannot be applied to [14]. These properties make Karhunen-Loève (KL) expansion a good way to describe a random process. It has been discussed and applied in several areas of research [15, 16], including stochastic wind field [17] and seismic vibration [18].
In this paper, several in-use methods of modeling and evaluation of track irregularity are presented at first. Next, the conventional K-L expansion is modified and applied to the study of random process modeling of track irregularity. A case study of a section of Beijing-Guangzhou high-speed railway using the K-L expansion is carried out. The decomposition of the random field as deterministic functions and random vectors is presented. Track geometries that are a representation of this railway network are generated along with statistical and frequency validations. In the next step, a multibody model of the train-track interaction is established, using SIMPACK software. Verification of the dynamic model and K-L expansion result is conducted. The accelerations of train body under different traveling velocity are studied and discussed.
2. Modeling and Evaluation of Track Irregularities
2.1. Scoring Method and TQI
At present, two methods are applied to evaluate the track irregularities of high-speed railways in China, scoring method and track quality index (TQI).
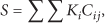
Scoring method, which is a kind of peak value management, focuses on the magnitudes of the track irregularities. The scores of each 1 km-long track section are calculated according to the magnitude level of the seven types of irregularities. Local irregularities that are beyond the standard with four levels (I–IV) are recorded. A certain score is added to each local irregularity, and the total score within a 1 km section is obtained:
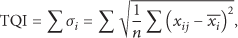
Track quality index (TQI) method focuses on the average characteristics of track irregularities, instead of the peak values. The standard deviations of seven irregularities in each 200 m-long track section are calculated and added together:
2.2. Level Crossing Method
As a simple and efficient method [7, 11], level crossing theory can be carried out to model and evaluate the track irregularity data, but it works only if the data follows the Gaussian nature. The power spectral density (PSD) function of the random process is calculated at first. The average number of zero upcrossings in a given length is then estimated by using the PSD functions. Furthermore, the peak statistics also can be estimated. This method can predict the peaks and level crossings of the track irregularity data, which are the critical indices for railway engineers and management. It gives a different approach to evaluate the unevenness level. But the limit of this method is obvious; it is only useful for Gaussian random process.
2.3. Modeling with Karhunen-Loève Expansion
Karhunen-Loève (K-L) expansion method provides a complete parameterization of the track geometry. Random track geometry could be transformed as a combination of deterministic orthogonal functions and a set of uncorrelated random variables, eigenvectors. Under this transformation, the first eigenvector has the largest possible variance, and each succeeding eigenvector has the highest possible variance under the constraint that it is uncorrelated with the preceding one. And the correspondent eigenvalue represents the random signal energy in its mode. To model the track irregularity data, four types of track irregularities are taken into consideration in this paper: vertical irregularities (left and right) and alignment irregularities (left and right).
In this case, vector

The Karhunen-Loève expansion of random vector
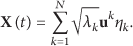
In (3),

in which the covariance matrix
Projection basis

3. Case Study of Beijing-Guangzhou High-Speed Railway
3.1. Test Section and Gaussian Check
A case study of track irregularities in Beijing-Guangzhou high-speed railway is carried out. As the longest high-speed railway line all over the world, the structure of 32 m-span continuous viaduct is widely used, which consists of 81% length of the entire Beijing-Guangzhou high-speed railway [19]. It also features the maximum operation speed in China, 350 km/h. The test data studied in this case study was recorded by a comprehensive inspection train (CIT) in June 2013. The test conditions are shown in Table 1.
CIT test conditions.
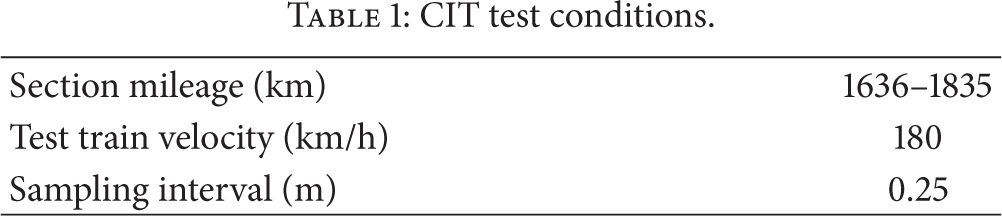
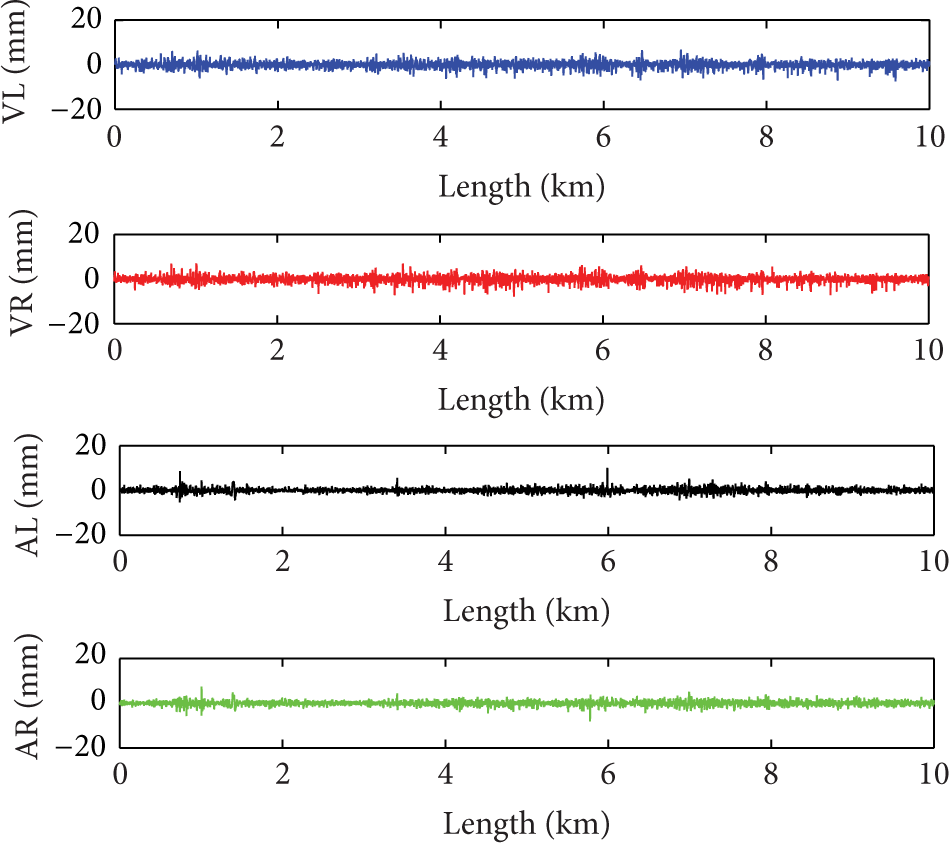
This section is between the city of Changsha and Hengyang, which consist of continuous viaduct mainly. This guarantees that this section has a relative consistent geological and engineering condition. Among the seven types of irregularities, the vertical and alignment irregularities of both tracks are considered typical representations of track geometry [1] and hence attract extensive studies and applications. The data of these four types of irregularities in this case study are shown in Figure 3. Using the current evaluation methods described in Section 2.1, the results of average and the worst track section, along with the location of it, are shown in Table 3.
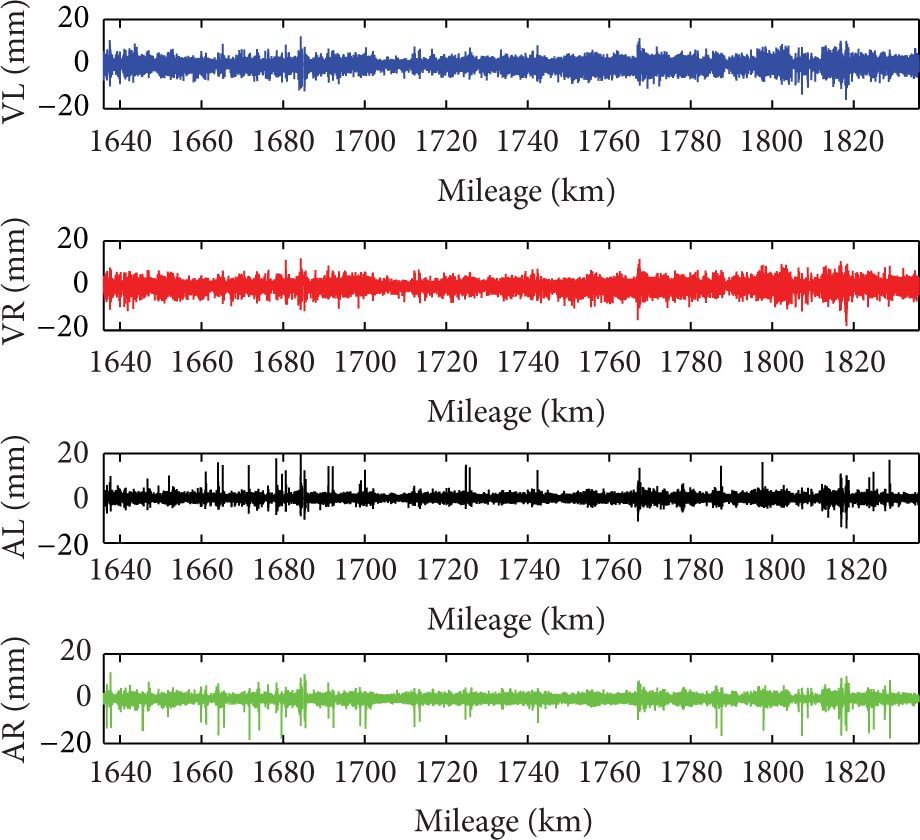
Four types of irregularities data from the test section.
To find out whether the level crossing method which is introduced in Section 2.1 can be applied, a Gaussian check is required. As a verification method, the Kolmogorov-Smirnov (K-S) tests are performed for the four irregularities, respectively. Results show that none of the four irregularities have Gaussian nature, so that the level crossing theory in Section 2.2 cannot be applied in this case.
3.2. K-L Approach and Calculation
According to the discussion in Section 2.3, K-L approach has a much wider range of use and fewer restrictions to the random process concerned. In the circumstance that the non-Gaussian random process is observed, K-L calculation and expansions can be carried out. The K-L approach is under the assumption that the track section studied in this case is constructed by continuous and independent portions of the same length L. The same engineering and statistical properties are expected among those portions. In this case study, L is set as 200 m, which is the same as the section length in TQI method.
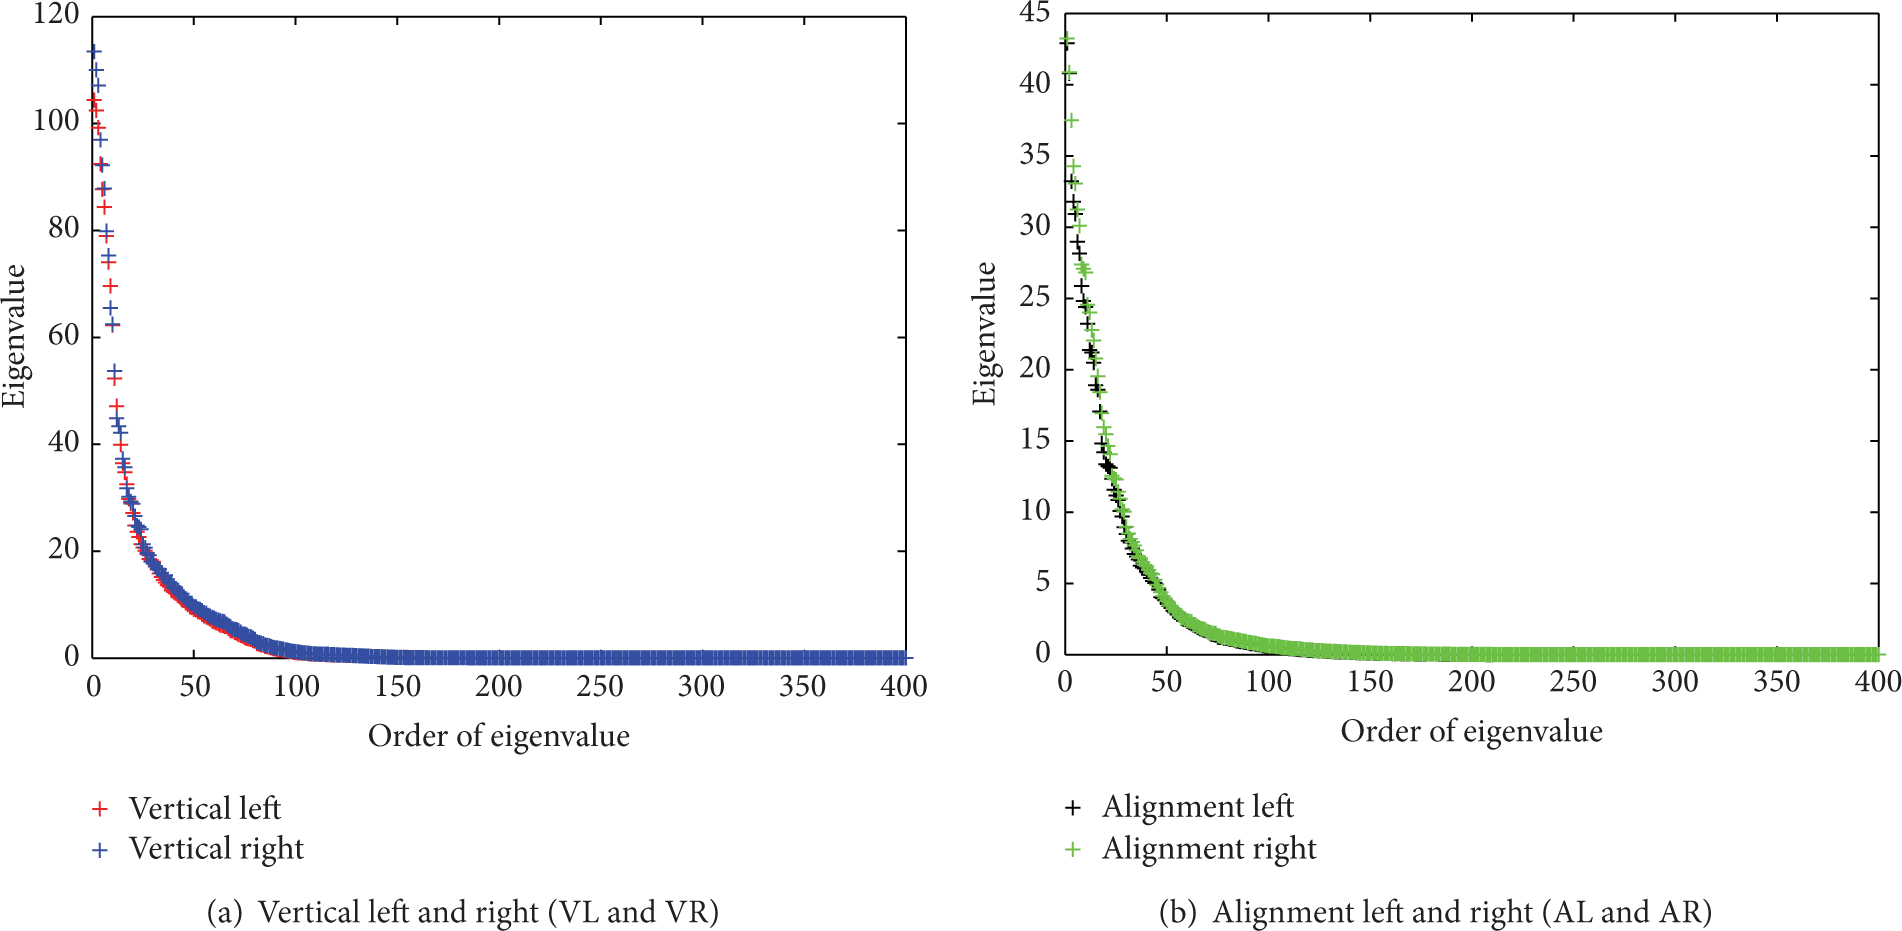
The eigenvalues of the random processes of four irregularities are calculated and shown in Figure 4. In the next step, to determine the value of the truncation parameter 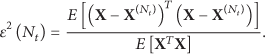
Calculation of eigenvalues.
The relation between value of error
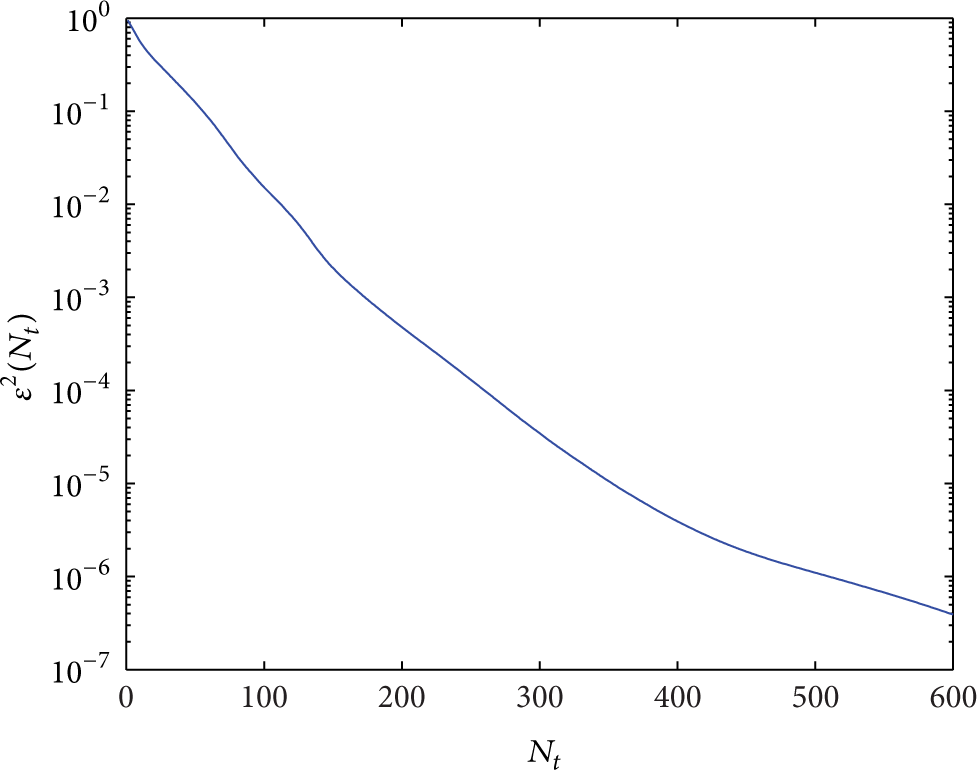
Level of residul error.
Generated track irregularity.
3.3. Statistical and Frequency Validation
To validate the accuracy of the model and the parameter in Section 3.2, 200 km of track with four kinds of irregularities are generated. Samples of the measured and the generated track irregularity are shown in Figures 3 and 6, respectively. Due to the large amount of data points, it is difficult to compare them in the figures directly. Instead, various statistical indicators of them are compared in this section, which include number of upcrossings with different levels, average and worst section under the two current evaluation methods, and their power spectral density (PSD).
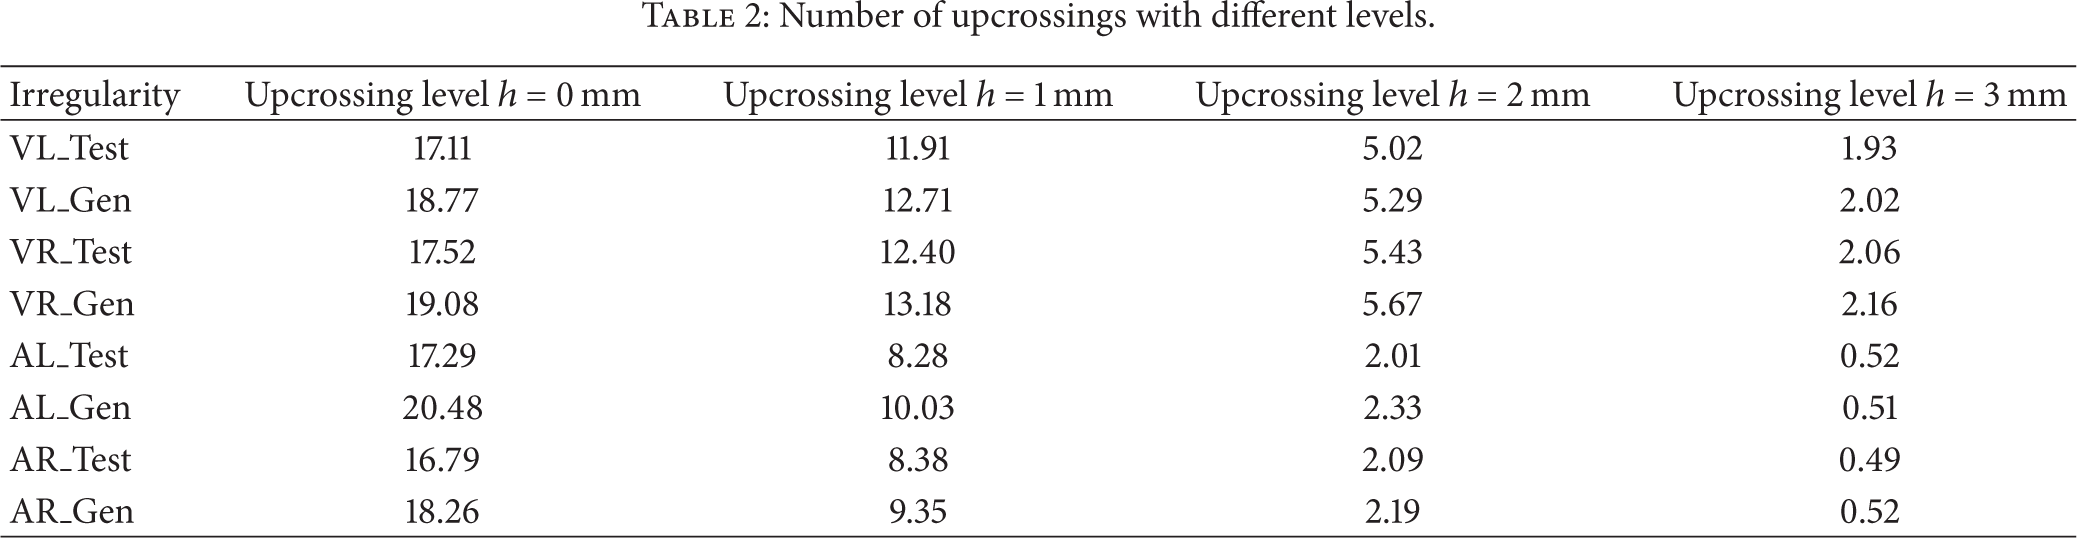
In Table 2, average number of upcrossings of different level h over the length
Number of upcrossings with different levels.
Comparisons of evaluation results for test and generated track tection.
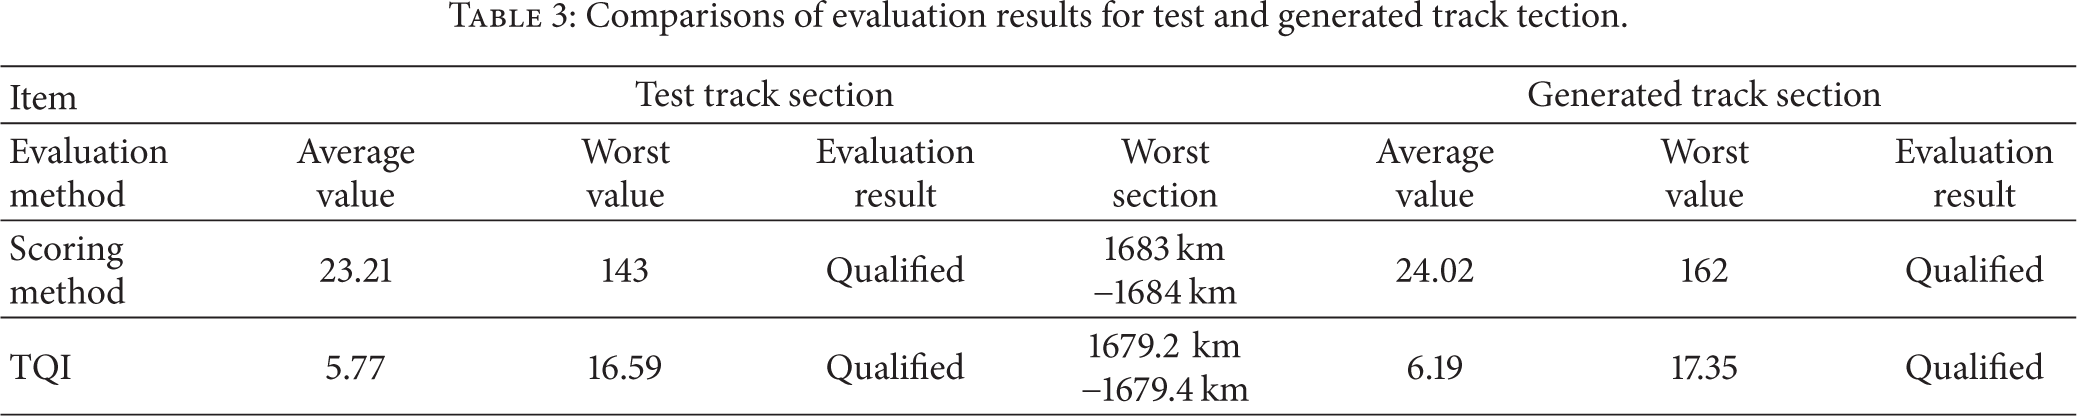
Furthermore, the current evaluation methods are applied to the generated track section; the results are shown in Table 3. Compared to the result of the original test data, the evaluation values are similar. And both results show a qualified track section according to the evaluation standard. But the generated data given by the K-L expansion cannot provide the information of the critical positions on the track, since this method only focuses on the global feature but not on the local one.
As mentioned before, characteristics of track irregularities in frequency domain are extremely important for description of random process and further simulation research. The mean power spectral density (PSD) of test data and generated data,
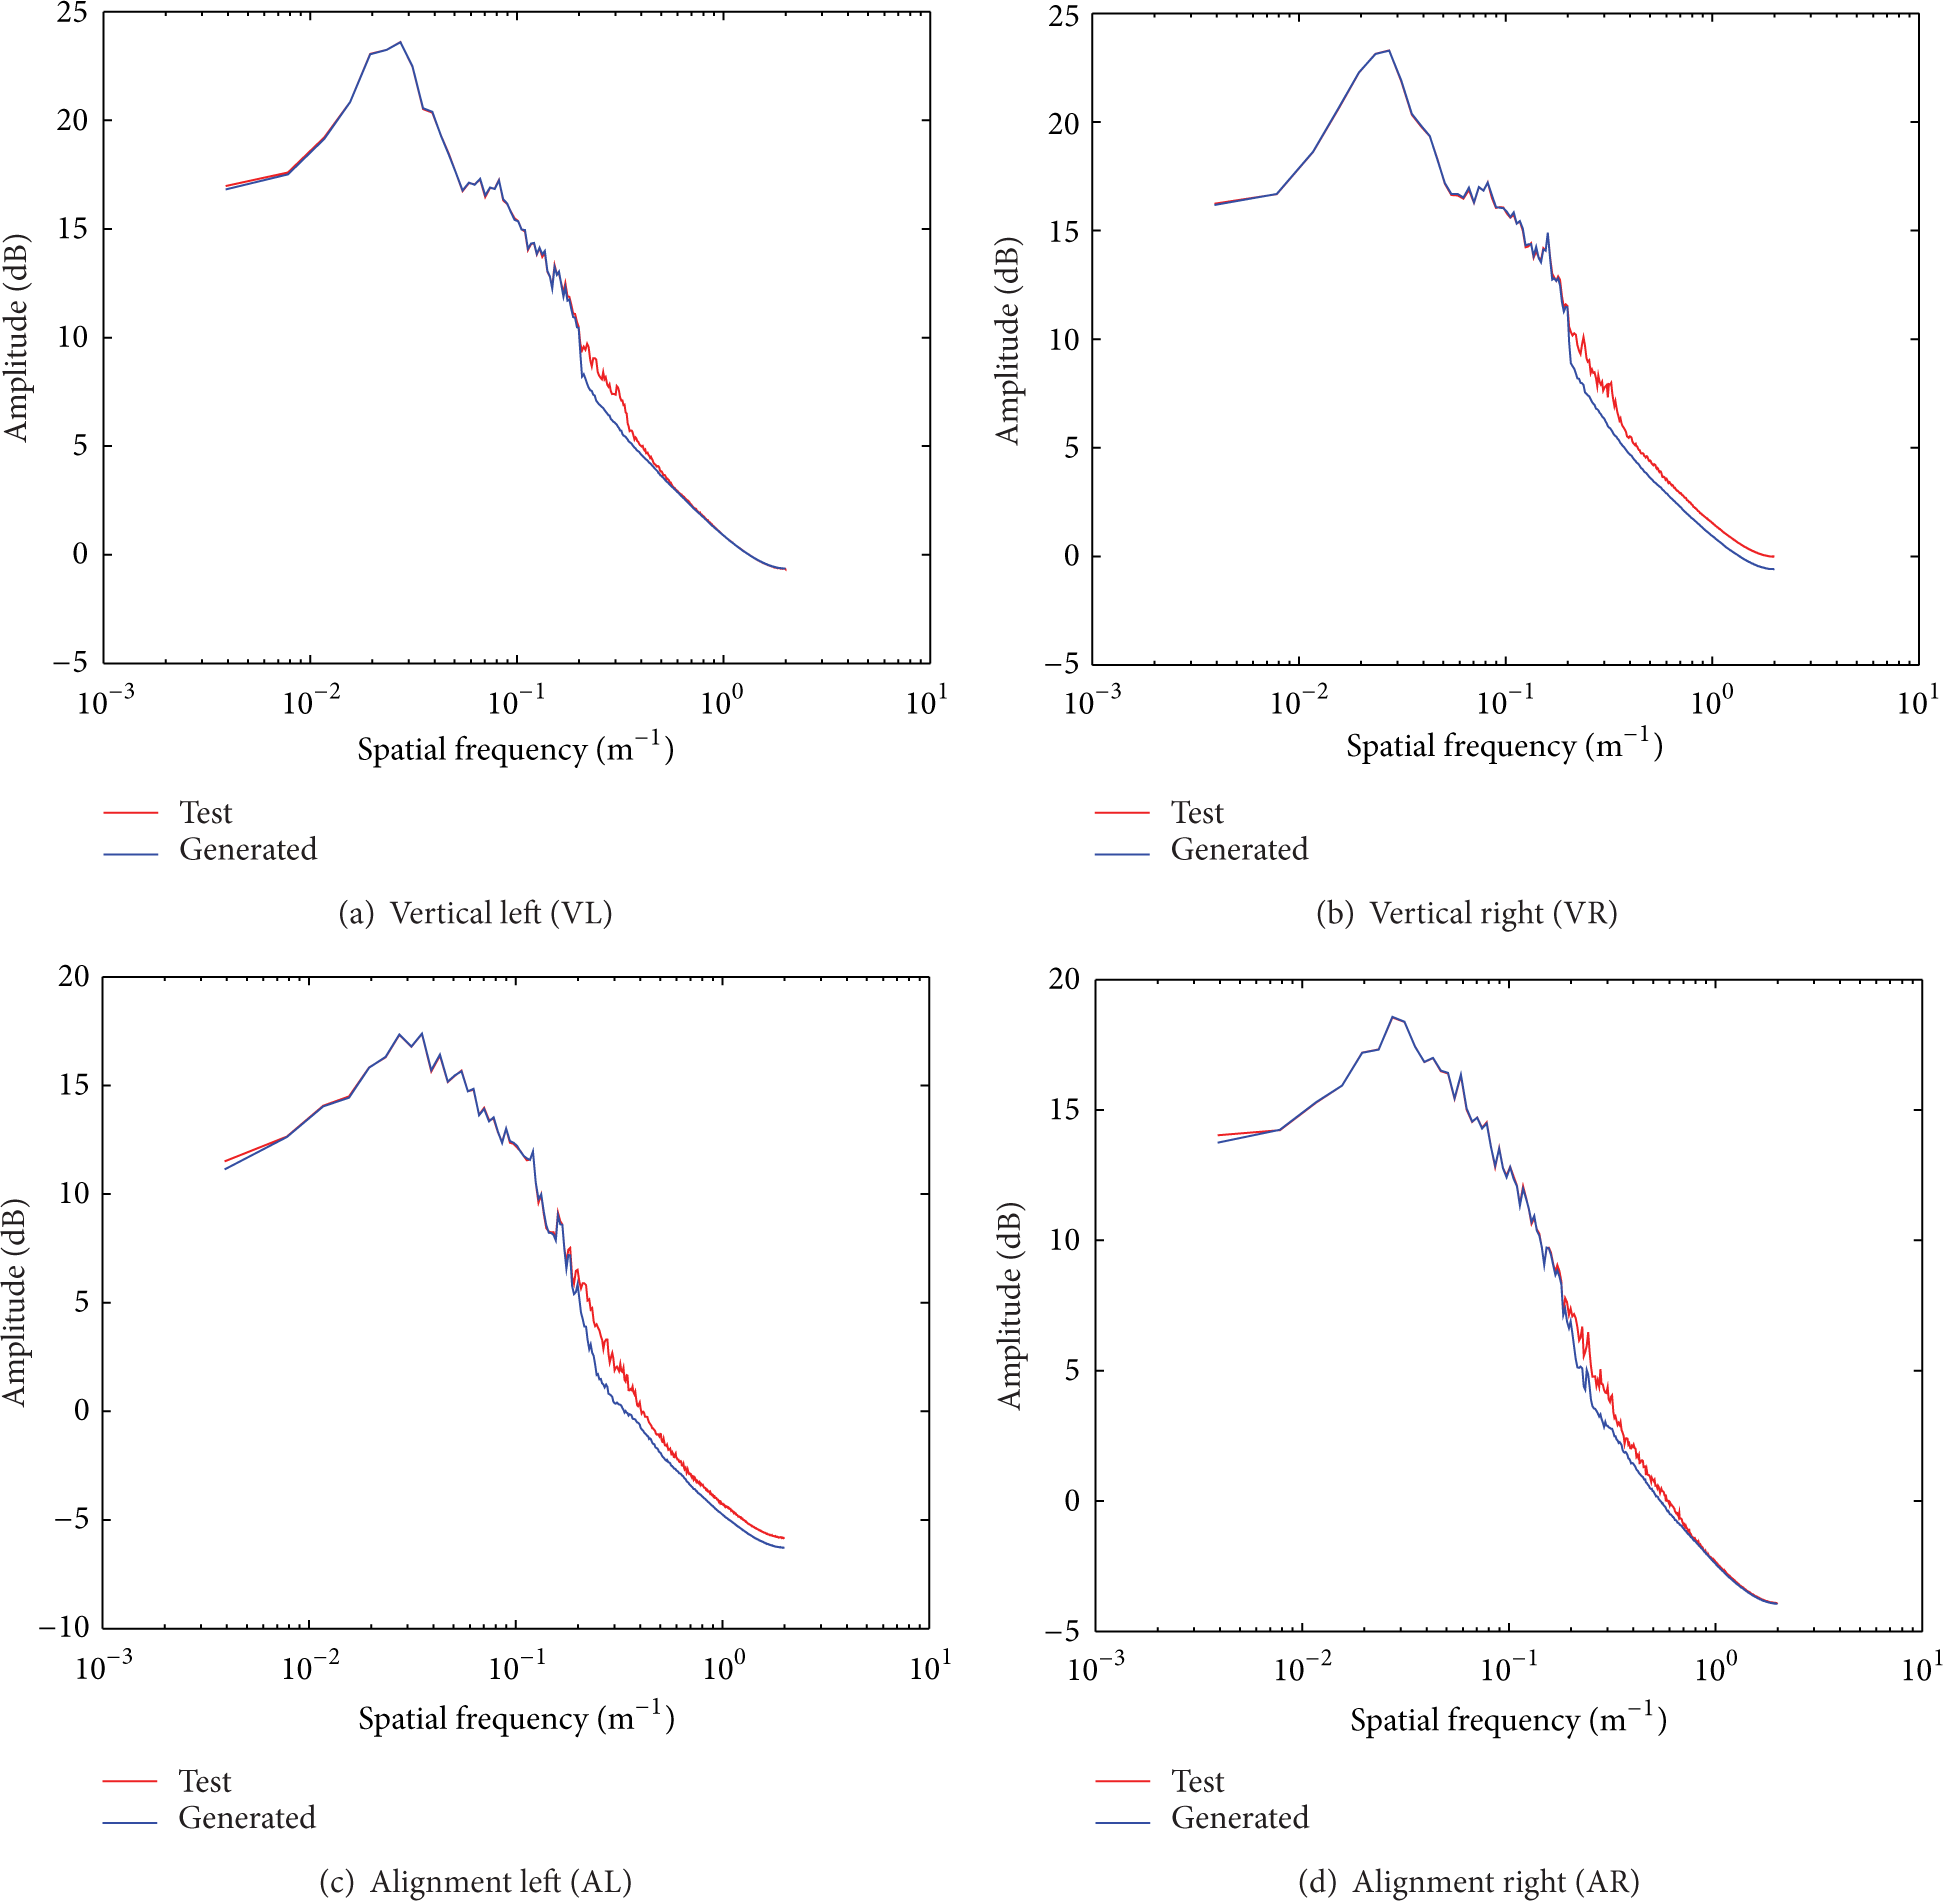
Validation of track irregularities with PSD.
3.4. Application in Dynamic Simulation
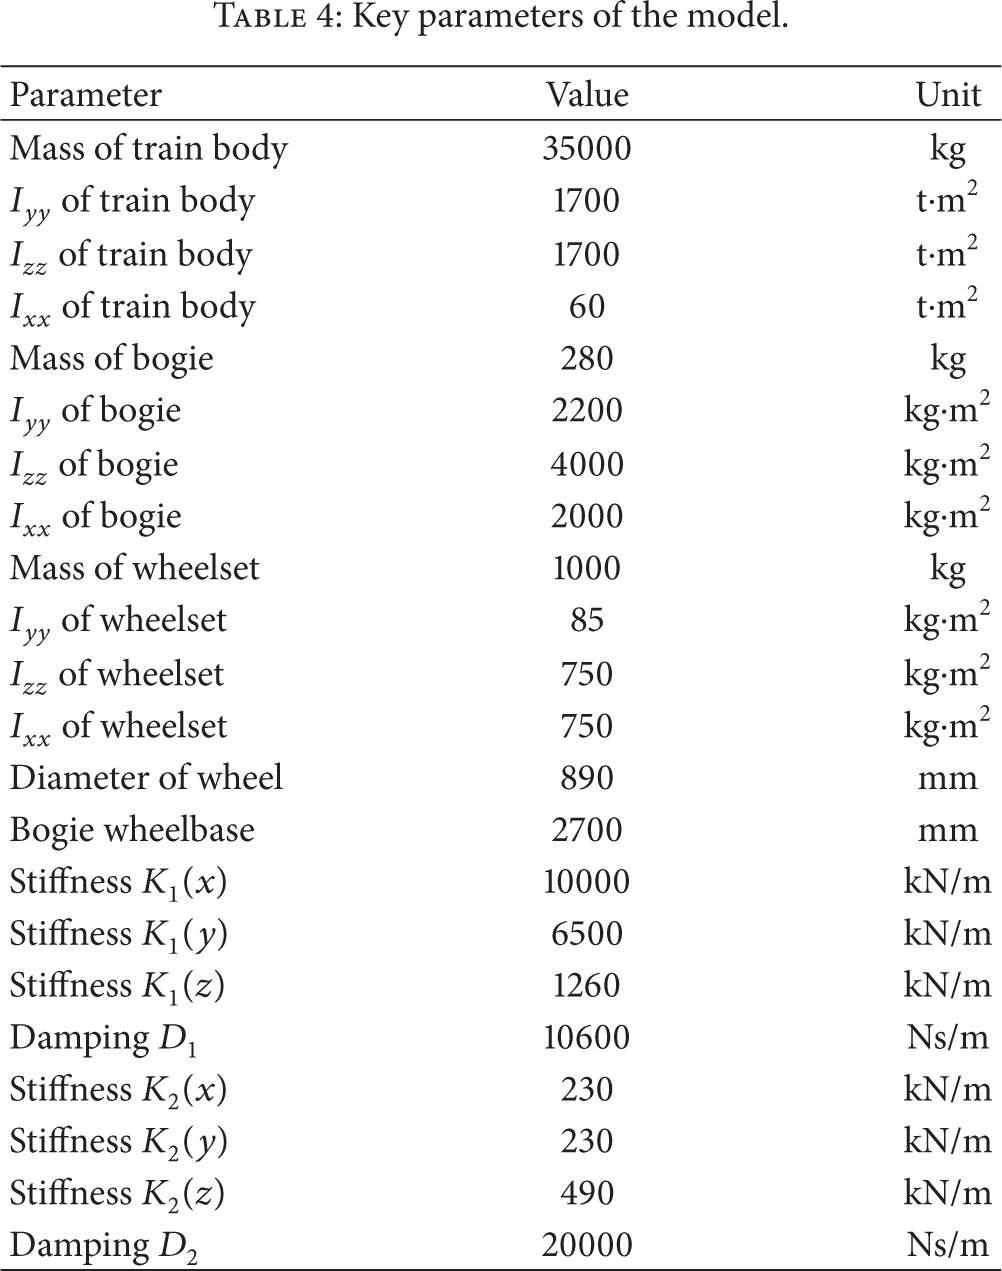
An important application for the generated track geometry is that it can serve as the critical input in dynamic simulation of train-track system. In SIMPACK software, a multibody model of the train is established. Figure 8 shows the simplified sketch of the model and its representation in SIMPACK software. The train parameters in the model are configured the same as the CRH train in operation. Some key parameters are presented in Table 4 (x: longitudinal direction, y: lateral direction, z: vertical direction).
Key parameters of the model.
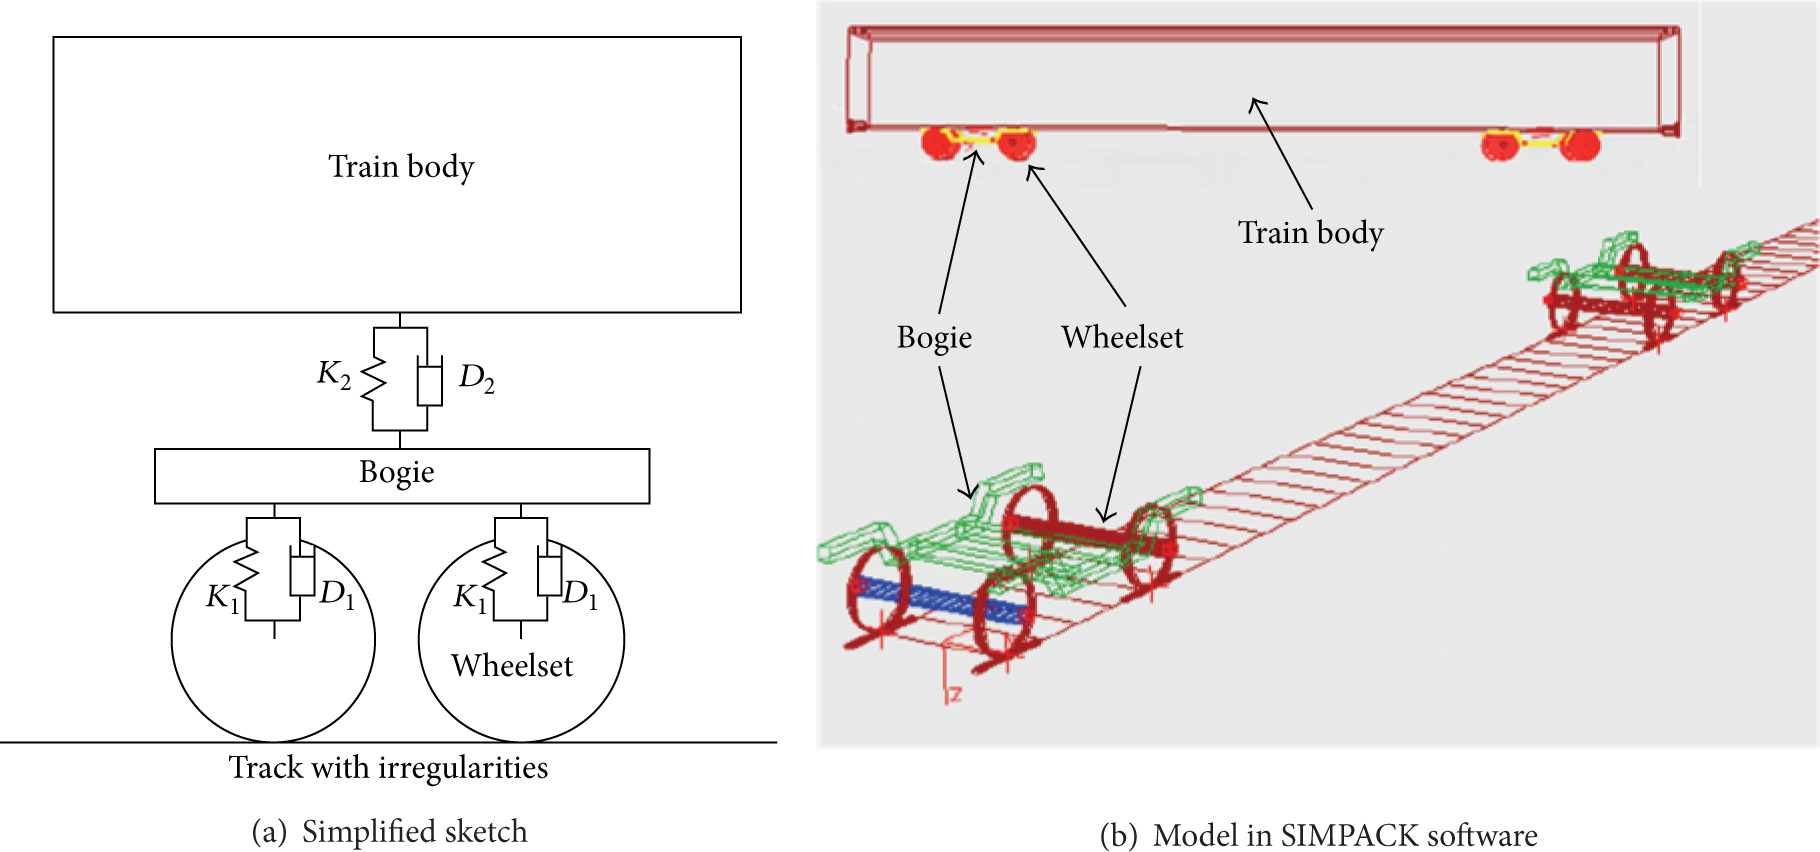
Multibody train model.
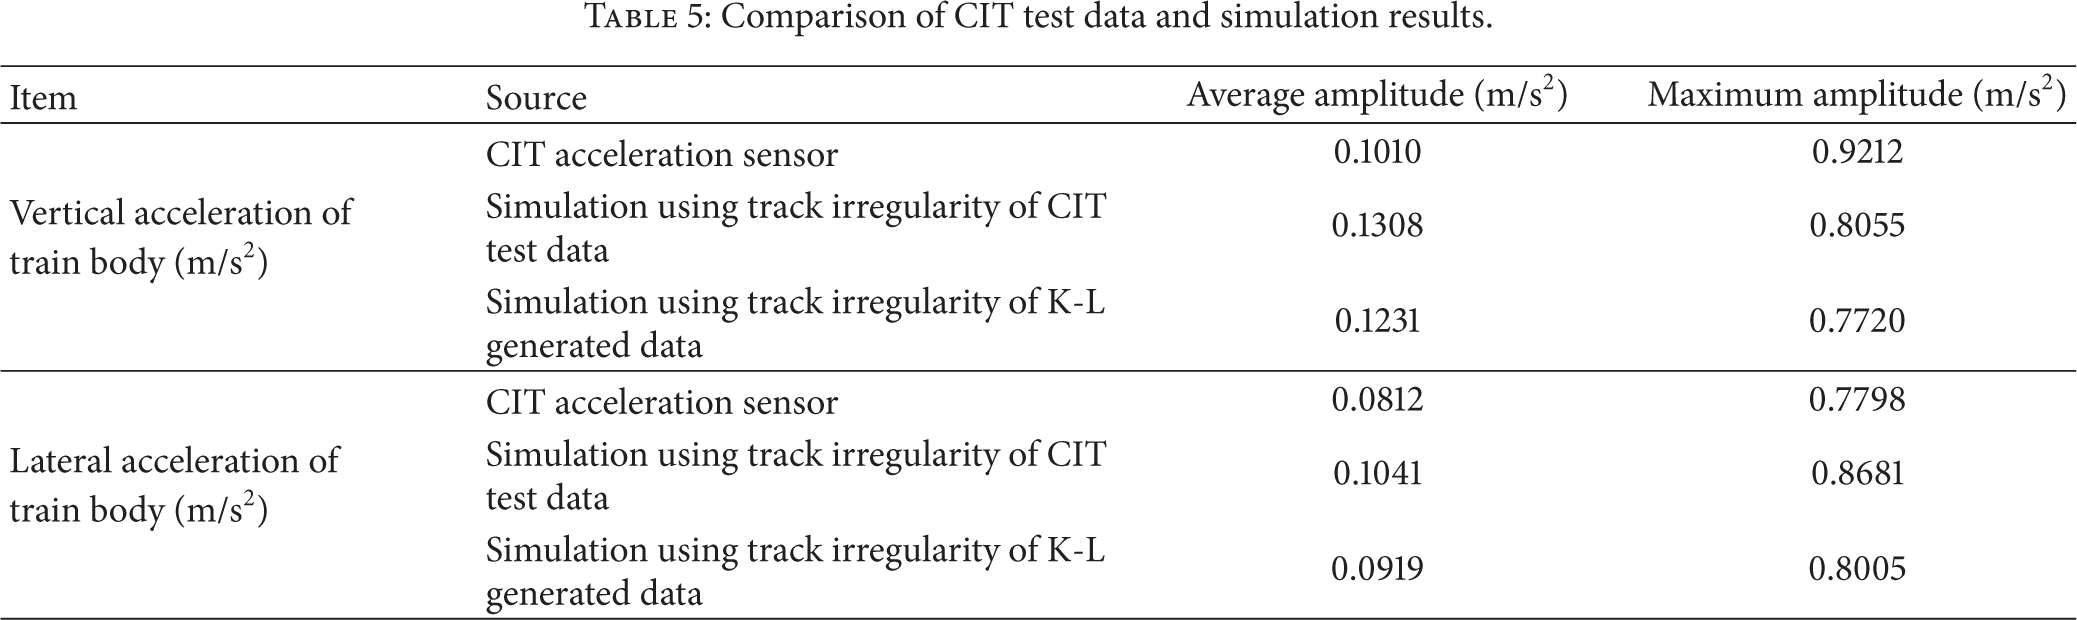
The dynamic response of the high-speed train under different traveling velocity is studied in this simulation. The traveling velocity of the train is set the same as the CIT test condition in Section 3.1, which is 180 km/h. Track section with irregularity directly measured by CIT shown in Figure 3 and those irregularities generated by K-L approach in Section 3.2 are applied as the input track geometry. The simulation results of accelerations of the train body are shown in Table 5 and are compared with data from CIT acceleration sensors. The comparison of vertical and lateral acceleration of the train body shows that the statistics of accelerations using different inputs match each other. This result provides an additional dynamic verification of K-L generated data besides the statistical and frequency verification in Section 3.3.
Comparison of CIT test data and simulation results.
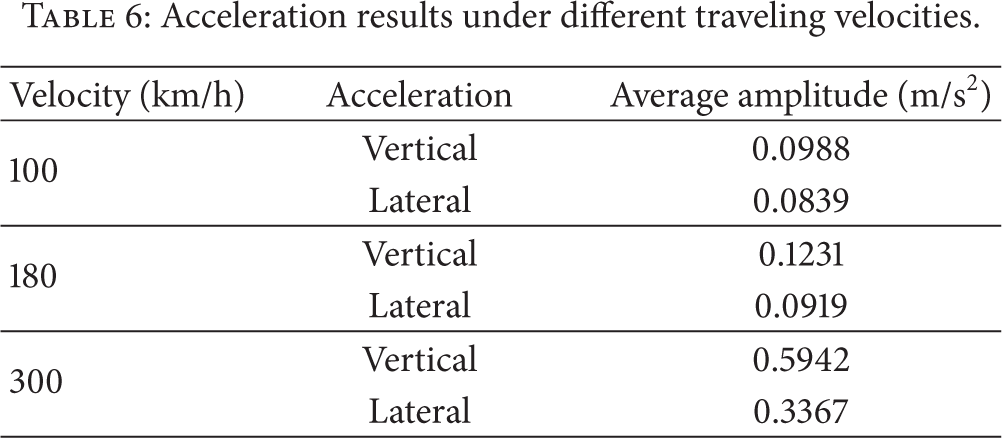
The vertical acceleration of the train body can be easily perceived by the passengers, thus making it a critical indicator for comfort. Using the dynamic model and the track geometry generated above, it is easy to carry out simulations under different traveling velocities. Simulations are repeated with traveling velocity set as 100 km/h and 300 km/h. Results are shown in Table 6, and a typical section of vertical and lateral accelerations is plotted in Figure 9. Results shown in both numbers and figures indicate that when the traveling velocity increases from 100 km/h to 300 km/h, the amplitudes of acceleration increase significantly. Since accelerations of train body and wheels are important factors related to derailment risk of the train, research on detailed relationship between traveling velocity and acceleration responses and a parametric study could be interesting topics for future works.
Acceleration results under different traveling velocities.
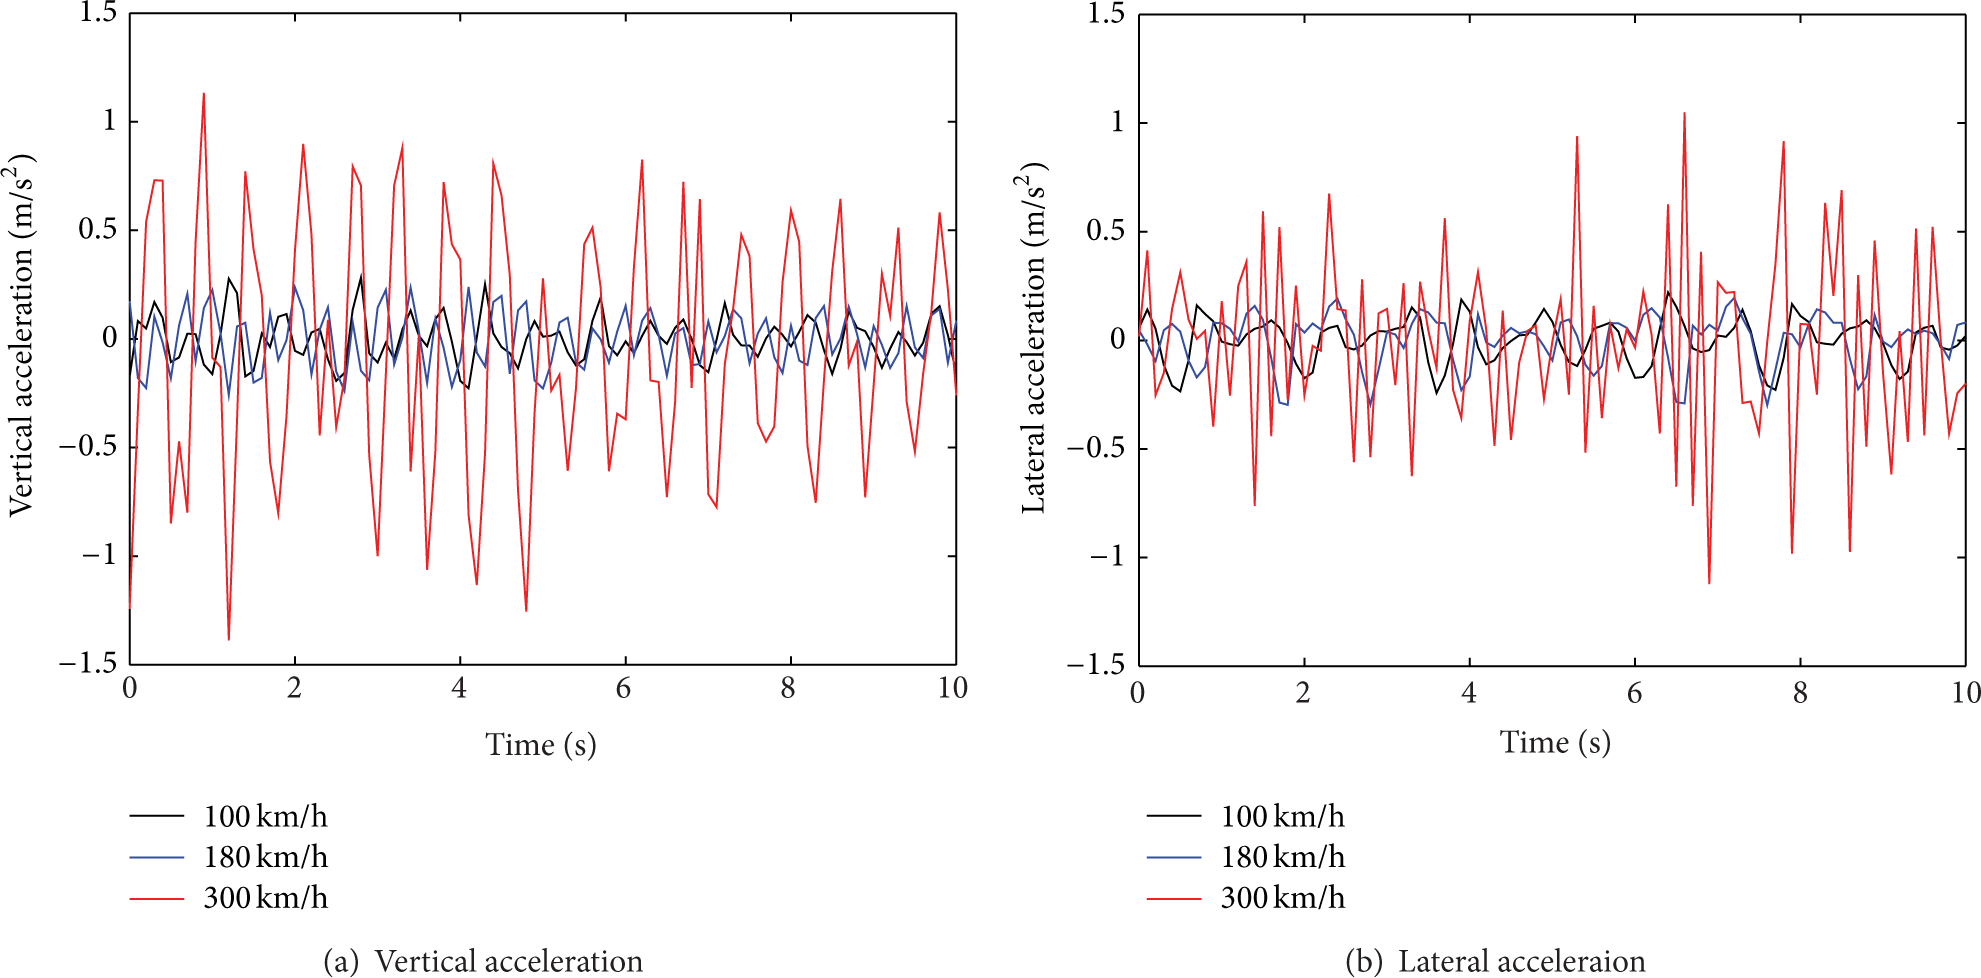
Accelerations under different traveling velocities.
4. Conclusions
Facing the rapid growth of high-speed railway construction and operation, a more thorough understanding of railway safety is required. Railway track irregularity, as a potential threat to safety of operation and comfort of passengers, remains a challenging issue for researchers and engineers. Recorded by sensors in CIT, data of track irregularities are analyzed by railway management currently but deserve more detailed data mining. Methods to model the track irregularities as a random field are reviewed and discussed. In the case study, random track geometries from Beijing-Guangzhou high-speed railway are analyzed by Karhunen-Loève expansion. Eigenvalues are calculated and presented. After the truncation parameters are determined, track geometries that are a representation of this railway network are generated. Statistical and frequency validations of this stochastic model are carried out, to make sure that the characteristics of both time and frequency domain of generated and test track geometries are similar. At the end, an application of the K-L expansion model is studied by a dynamic simulation model in SIMPACK software, which is an effective approach to study the dynamic responses of train-track system with random track irregularities. Accelerations of the train body under different traveling velocity are analyzed and compared. For future research, these parameters and results of K-L expansion could be used for the forecast of track geometry conditions. Further dynamic simulation will provide more scientific foundations and management references for the operation of high-speed railway.
Footnotes
Conflict of Interests
The authors declare that there is no conflict of interests regarding the publication of this paper.
Acknowledgment
This work was supported by Tsinghua University initiative research program of “Research on Key Technique of Wheel-Track Test System” (2012Z06119).