
Abstract
Mobile sensor networks (MSNs), consisting of mobile nodes, are sensitive to network attacks. Intrusion detection system (IDS) is a kind of active network security technology to protect network from attacks. In the data gathering phase of IDS, due to the high-dimension data collected in multidimension space, great pressure has been put on the subsequent data analysis and response phase. Therefore, traditional methods for intrusion detection can no longer be applicable in MSNs. To improve the performance of data analysis, we apply K-means algorithm to high-dimension data clustering analysis. Thus, an improved K-means clustering algorithm based on linear discriminant analysis (LDA) is proposed, called LKM algorithm. In this algorithm, we firstly apply the dimension reduction of LDA to divide the high-dimension data set into 2-dimension data set; then we use K-means algorithm for clustering analysis of the dimension-reduced data. Simulation results show that LKM algorithm shortens the sample feature extraction time and improves the accuracy of K-means clustering algorithm, both of which prove that LKM algorithm enhances the performance of high-dimension data analysis and the abnormal detection rate of IDS in MSNs.
1. Introduction
FOR the special network application, mobile sensor networks (MSNs) are proposed as a new type of wireless sensor network with low node density and sparse network environment. Nodes in MSNs are no longer distributed statically to sample data but wore on the mobile carriers and move with them, which conduces to highly dynamic network topology, poor network connectivity, and intermittent communication between nodes [1]. Furthermore, nodal mobility will easily lead to invalid data transmission, retransmission storm, and easiness of being injected by virus, risking the security of network. Keung et al. studies the intrusion detection problem in a mobile sensor network, focusing on providing barrier coverage against moving intruders [2]. It becomes particularly challenging when the movement route of sensors and intruders needs to be captured. Abduvaliyev et al. propose a comprehensive classification of various IDS approaches according to their employed detection techniques such as anomaly detection, misuse detection, and specification-based detection protocols [3]. Because of wireless broadcast communication, wireless sensor networks (WSNs) are vulnerable to denial-of-service (DoS) attacks. Han et al. identifie malicious nodes through energy consumption of sensor nodes in WSNs, distinguishing the ongoing DoS attack species effectively. It is difficult to set a suitable threshold for evaluating the abnormal energy consumption [4]. To detect the sinkhole nodes in WSNs, Han et al. also make full use of neighbor information stored in the nodes, avoiding the occurrence of abnormal energy holes and severe malicious attacks, for example, the selective forwarding attack [5]. However, there is little related work about the security of MSNs. In the previous studies, IDS is the key technology to ensure network security and also a proactive technology to protect network from attacks. IDS can detect system or network resources in real-time to find out network intruders or prevent legitimate users from misusing resources.
IDS is divided into three parts, for example, data gathering, data analysis, and response. In order to find traces of network intrusion, IDS collects data from multiple points in the network system. Thus, data gathering covers multidimension space including system logs, network packets, important documents, and status or behavior of user activity. In traditional data analysis phase, the collected high-dimension data will be handled with pattern matching, anomaly detection, or integrity testing. Once intrusion behaviors are found, IDS will immediately enter the response phase, including logging, alarming, and security controlling. In the data gathering phase of IDS, therefore, the high-dimension data obtained from multidimension space bring great challenges to the subsequent analysis and response stages. This paper proposes the LKM algorithm that firstly applies linear discriminant analysis (LDA) to accomplish dimensionality reduction of original high-dimension data and then uses the K-means cluster analysis for the 2-dimension data. In this way, LKM solves the high-dimension data analysis problems in IDS.
Lee et al. are the first one to apply data mining techniques to intrusion detection, such as association rules algorithm, classification algorithm, and sequence mining algorithm [6]. Recently, it has been a new trend to use the data mining algorithm in IDS. Related algorithm research will help to improve the security of network. Clustering analysis in intrusion detection is the key to realizing intelligent IDS. Clustering analysis is an important method for data partitioning or packet processing of huge data. Clustering algorithm can be roughly classified into division-based method, hierarchy-based method, density-based method, grid-based method, model-based method, and the fuzzy clustering. K-means algorithm is a typical clustering algorithm based on distance partition. The distance is used as the similarity evaluation index. In the case of two-dimensional or three-dimensional data, K-means algorithm can ensure the quality of the clustering. However, curse of dimensionality is common in K-means clustering algorithm when dealing with n-dimensional (
In this paper, an improved K-means clustering algorithm (namely, LKM algorithms) is proposed. Firstly, LDA is introduced to reduce the dimensionality of the original high-dimensional data, and then K-means clustering algorithm is adopted to make clustering analysis on the dimension reduced data. The so-called dimension reduction refers to the process in which samples from the high-dimensional space are mapped to the low-dimensional space for a meaningful representation of the high-dimensional data by linear or nonlinear method. Through data dimension reduction, the curse of dimensionality can be alleviated and other irrelevant properties in the high-dimensional space are eliminated. Therefore, we offset the defects and improve the performance of the K-means clustering algorithm when dealing with high-dimensional data set.
The rest of the paper is organized as follows. In Section 2, related works of the K-means algorithm are introduced, mainly about existing problems and corresponding improvements. In Section 3, LDA and K-means clustering algorithm are described respectively, and then LKM algorithm is described in detail. Simulation experiments on LKM algorithm are implemented, and experimental comparison results of existing PCA-Km algorithm and LKM algorithm are discussed in Sections 4 and 5. Section 6 concludes the paper.
2. Related Work
Lee et al. introduced an intrusion detection method based on data mining. The basic idea is to use the audit program to extract a large number of network connections and the host session features and apply data mining technology to export the rules that correctly distinguish between normal and intrusion behavior [6]. Elbasiony et al. proposed a hybrid detection framework which is based on data mining classification and clustering techniques. In the framework, K-means clustering algorithm is used to detect novel intrusions by clustering the network connections' data to collect most of the intrusions together in one or more clusters [7]. Muniyandi et al. proposed an anomaly detection method using K-means combined with C4.5, a method to cascade K-means clustering, and the C4.5 decision tree methods for classifying anomalous and normal activities in a computer network [8]. However, there are still some shortcomings of K-means algorithm. The main problems are in the following areas.
Different from other K-means, LKM achieves linear dimension reduction for the original high-dimension data and then generates 2D data for K-means clustering analysis. In this way, LDA and K-means are combined with each other. LKM improves the performance of K-means dealing with high-dimension data than other modified K-means solutions. Since the works of Napoleon et al. and Ding et al. are much similar to ours, the simulation analysis and the experimental comparison of LKM algorithm and PCA-Km algorithm are discussed in Section 4.
3. LKM Algorithm
In LKM algorithm, the linear dimension reduction method, LDA, is firstly adopted to reduce the dimension of the original n-dimension data set A. After the dimension reduction, the l-dimension data set Y can be obtained. Then K-means clustering algorithm is applied to clustering analysis, and the final result is output.
3.1. Algorithm Definition
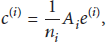
LDA is the method that minimizes within-class distance while it maximizes the interclass distance as much as possible [20]. So we can obtain the optimal projection direction to obtain the best classification. That is, we choose characteristic description of samples that maximize the ratio of within-class dispersion and interclass dispersion. For a given matrix


The concepts of within-class scattering matrix, interclass scattering matrix, and the total scattering matrix of LDA are defined as follows.
Definition 1.
Within-class scattering matrix

The within-class scattering matrix
Definition 2.
Interclass scattering matrix

Definition 3.
In the total scattering matrix

According to formula (5), total scattering matrix can be deduced as follows:

The total scattering matrix

On the basis of formulas (5) and (7), the expression of the overall centroid can be deduced as follows:

In the low-dimensional space reduced by the linear transformation matrix G,
Therefore, we take advantage of the best transformation matrix
Definition 4.
Calculate optimal transformation matrix

Considering formulas (3), (4), and (5), we can get the equivalent form of (10):

In this way, we are able to obtain the optimum conversion matrix

The value of x is solved out which satisfies the above conditions. When matrix

In addition, in order to measure dissimilarity of data object, we use Euclidean distance ranging method in K-means algorithm.
Definition 5.
In the high-dimension space, dimensional mapping process of data objects makes Euclidean distance in two-dimension space close to the shortest path from the high-dimensional space between objects. In two-dimension space, Euclidean distance between two points can be calculated based on the coordinates or vectors of them; namely,

Definition 6.
In order to obtain the best clustering results, error square and the guideline functions are adopted to obtain the optimal value of
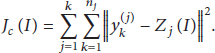
Definition 7.
The iteration is implemented repeatedly to find k clustering centers; n sample points are assigned to the nearest cluster center, so that the clustering error sum of squares reaches a minimum. Clustering center

3.2. Algorithm Steps
LKM algorithm flow chart is shown in Figure 1.
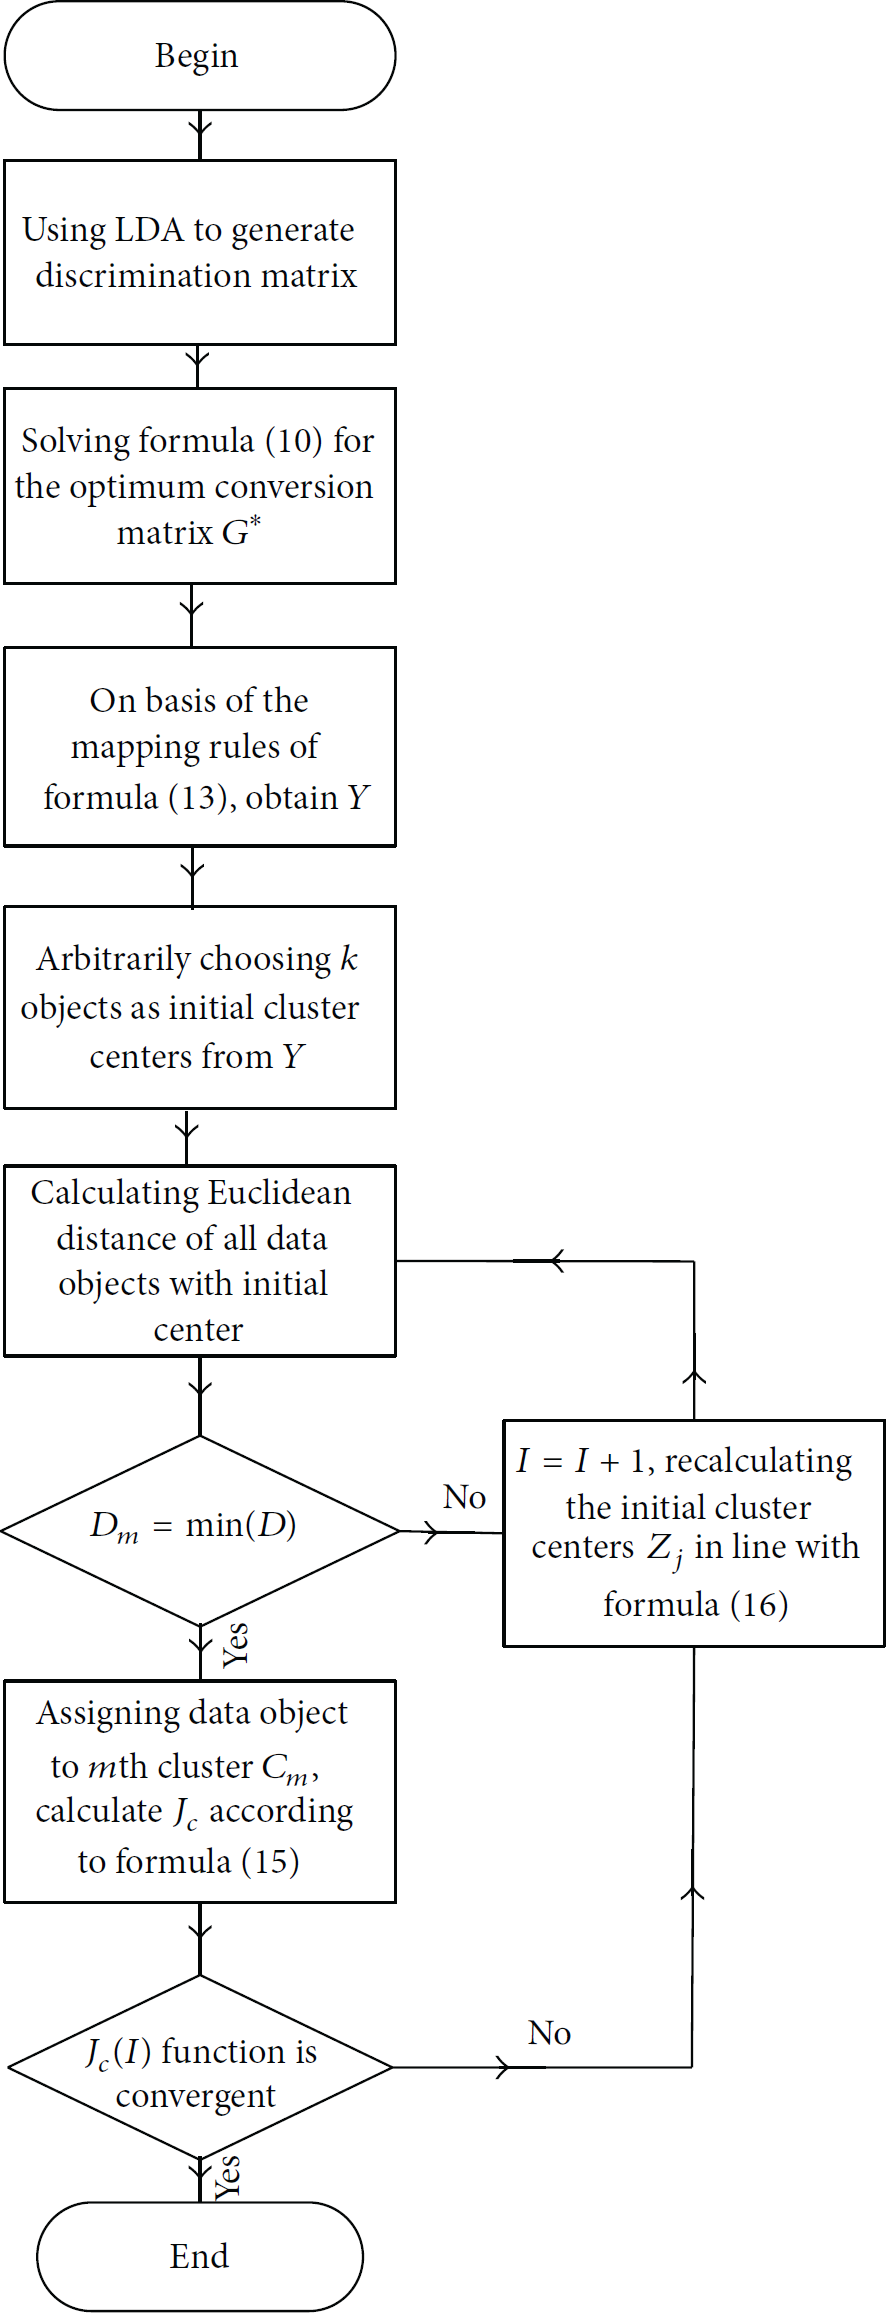
LKM algorithm flow chart.
The specific process of LKM algorithm is illustrated as follows:
n-dimension data set of matrix k clusters
Step 1.
Apply LDA to generate a transformation matrix G.
Step 2.
Generate within-class scattering matrix
Step 3.
Solve the optimization problems and then the best transformation matrix
Step 4.
Using optimal transformation matrix
The pseudocode of the dimensionality reduced data set Y by LDA is shown in Algorithm 1.
Input: n-dimensional dataset of matrix Output: l-dimensional dataset (1) (2) initial n prototype (3) repeat (4) compute (5) if (6) for (7) (8) end for (9)
Step 5.
Randomly select k objects from Y as the initial cluster centers
Step 6.
Calculate the Euclidean distanced
Step 7.
Calculate sum of squared error criterion function
Step 8.
Judge: if function
The pseudocode of K-means clustering analysis of l-dimensional data sets Y is shown in Algorithm 2.
Input: l-dimensional data sets Output: k of clusters (1) (2) (3) initial k prototype (4) repeat (5) for (6) compute (7) if (8) end for (9) if (10) compute (11) (12) for (13) compute (14) Until (15)
4. Simulation Analysis
We employ matlab7.0 programming for simulations. The PCA-Km algorithm [18] is similar to LKM algorithm described in this paper. To compare performance of these two cluster analysis algorithms for high-dimension data processing, we, respectively, utilize the LKM algorithm and PCA-Km algorithm to experiment with 40-dimension data set and 70-dimension data set. The results are shown from Figure 2 to Figure 9. The dimension of the initial data set is changed successively; the LKM algorithm and PCA-Km algorithm are applied to make clustering analysis for 2-dimension, 3-dimension, 4-dimension,…, 70-dimension initial data sets. Therefore, the feature extraction time of LDA and PCA is shown in Figure 10. The changes of the three algorithms (PCA-km, LKM, and K-means algorithm) are shown in Figure 11.
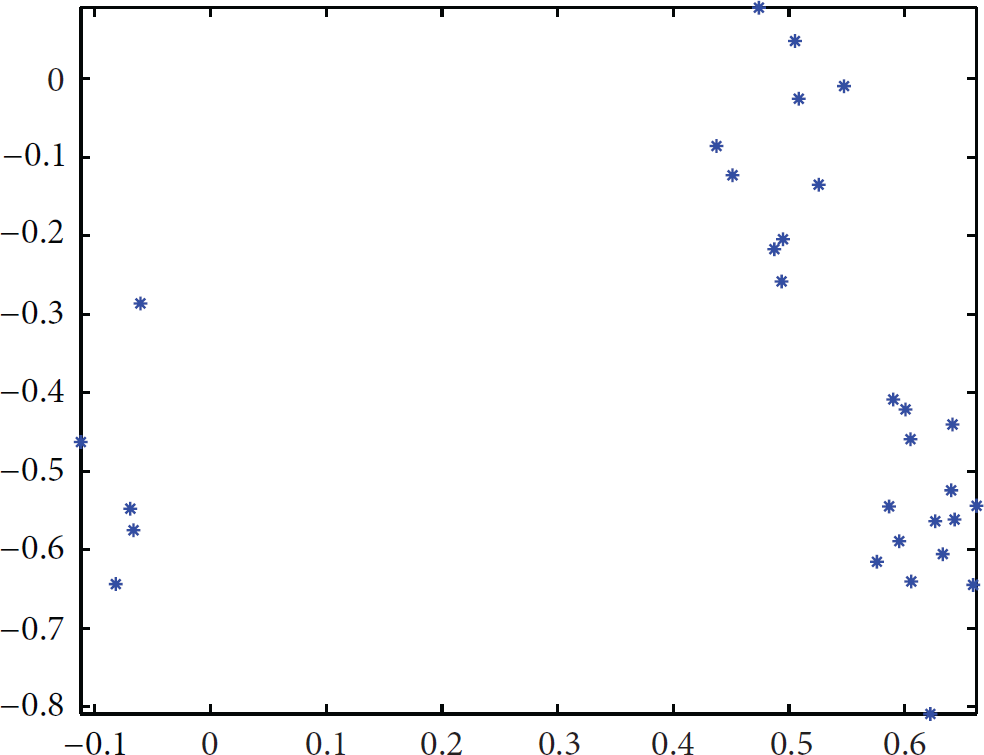
(1) Use the rand() function to randomly generate a 40-dimension data set A with 30 rows and 40 columns. LKM algorithm is used for LDA linear dimension reduction to generate a 2-dimension data set Y with 30 rows and 2 columns. The result is shown in Figure 2. PCA-Km algorithm is used for the PCA linear dimension reduction to obtain a 2-dimension data set

Comparing Figures 2 and 3, although LDA and PCA both complete the process of the data dimension reduction, LDA is superior to PCA in classification.
As we keep running LKM algorithm to perform clustering analysis of 2-dimension data set Y, the final outputs are two clusters. The clustering result of LKM algorithm for the 40-dimension data is shown in Figure 4; similarly, we proceed to implement the PCA-Km algorithms cluster analysis of the data set
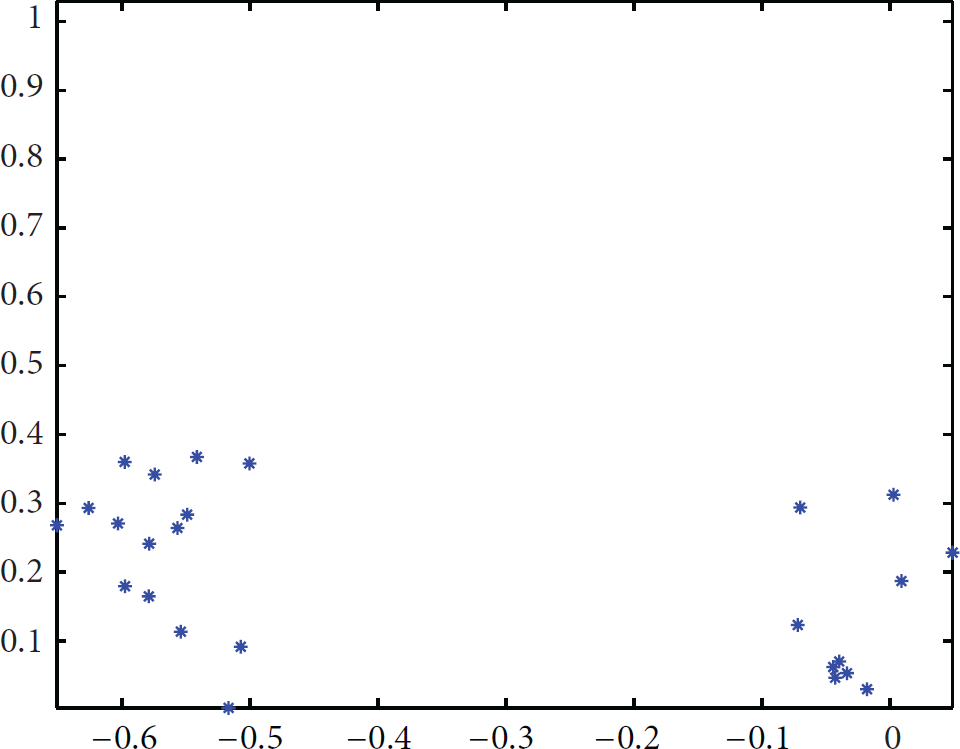
LKM algorithm clustering output.

PCA-Km algorithm clustering output.
By comparison of Figures 4 and 5, the distribution of data objects remains relatively dispersed after PCA-Km clustering. On the contrary, after the clustering process of LKM algorithm, the data objects are divided into two obviously different clusters.
(2) Similarly, simulation is implemented with a 70-dimension data set A with 50 rows and 70 columns randomly generated by rand() function to verify the performance of experiment (1). The LKM algorithm is executed to make LDA linear dimension reduction on A. The result of 2-dimension data set Y in 50 rows and 2 columns is shown in Figure 6. After the PCA linear dimension reduction of PCA-Km, the result of the two-dimension data set


Comparing the results of dimension reduction from Figures 6 and 7, LDA not only maintains the best projection identify information of the original data, but also improves the classification performance. Figures 6 and 7 further verified that the classification performance of LDA is superior to that of PCA.
If we go on with LKM algorithm, the final output will be two clusters. The results of LKM clustering algorithm for 70-dimensional data analysis are shown in Figure 8. And the results of PCA-Km algorithms are shown in Figure 9.

LKM algorithm clustering output.

PCA-Km algorithm clustering output.

Feature extraction time of LDA and PCA.
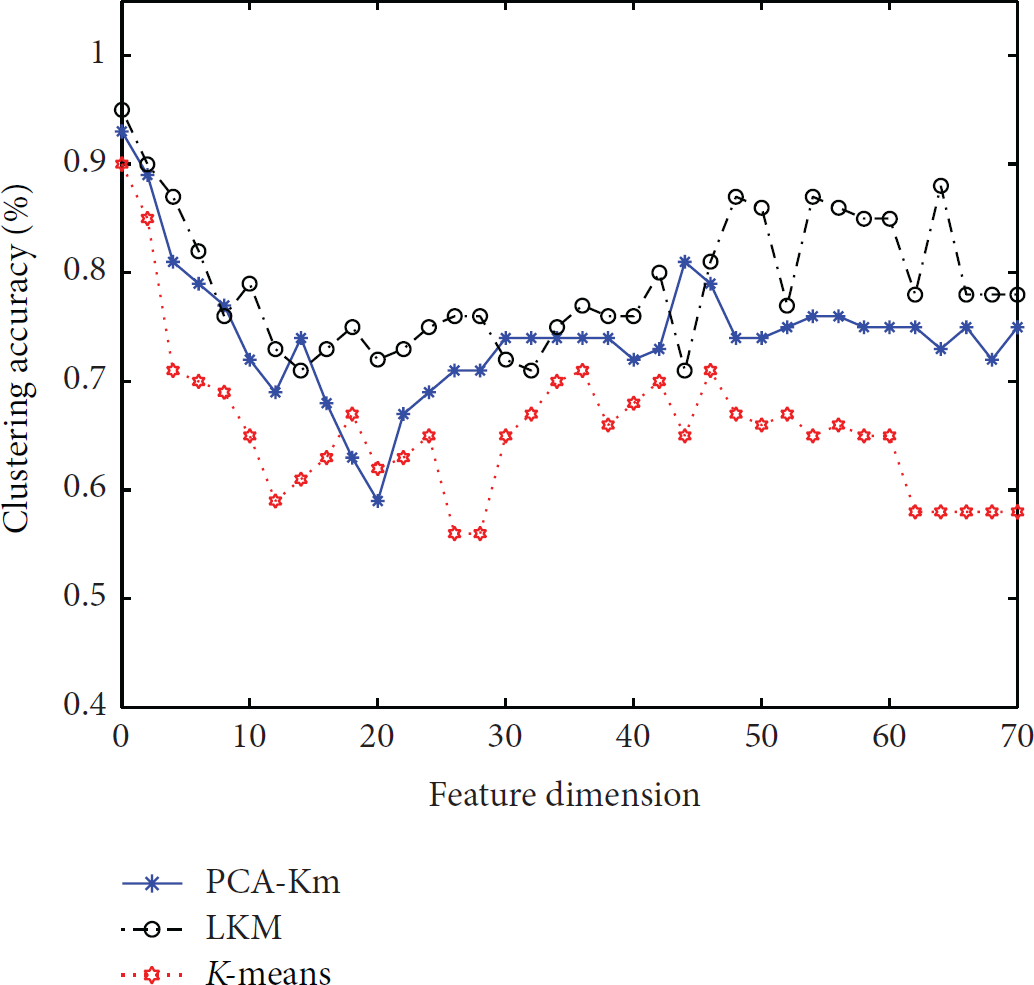
Clustering precision changes of the PCA-Km, LKM, and K-means.
In Figures 8 and 9, the data is divided into two distinct clusters classes after the LKM algorithm clustering analysis, and the clustering effect is very ideal. However, the PCA-Km algorithm clustering analysis still fails to achieve the desired clustering effect. We can conclude that LKM algorithm clustering outperforms PCA-Km algorithm.
(3) The rand() function is run to randomly generate 2-dimension, 3-dimension, 4-dimension,…, 70-dimension initial data sets A. Implement the above experiments, respectively, to make linear dimension reduction for different initial data sets. In order to effectively implement the classification, feature extraction is needed, which means that when all kinds of information contained in high-dimension space are analyzed and processed, the unique attributes are screened without the interference of external factors. And feature extraction time is the average time to complete the feature extraction process. Changes of feature extraction time for LDA and PCA linear dimension reduction technique are shown in Figure 10.
Experiments show that when dealing with the data sets of the same dimension, feature extraction time of LDA linear dimension reduction technique is shorter than that of PCA linear dimension reduction techniques. Unlike PCA, LDA is a supervised feature extraction method, which can not only maintain the best projection identification information of the original data, but also improve the classification performance and the efficiency.
With the increasing dimension of initial data sets, the changes of the clustering precision for these three algorithms, PCA-Km, LKM, and K-means, are shown in Figure 11.
Figure 11 illustrates that when processing 1-dimension, 2-dimension, or 3-dimension data, K-means algorithm is still able to guarantee the quality of clustering. However, when processing the n-dimension (
(4) To further validate the proposed algorithm's effectiveness in IDS, this paper applies the well-known KDD Cup 1999 (KDD’99) data sets to perform the following experiments. The attacks in KDD’99 data sets are categorized into five types: DoS (denial of rervice), Probe, U2R (user to root), date compromise (data), and R2L (remote to local) [22]. For testing, 2500 testing instances are randomly selected from the KDD’99 data sets. The experimental results are evaluated with two indicators that are DR (detection rate) and FPR (false positive rate):
DR (detection rate): DR = the number of detected attacks/the total number of attacks, FPR (false positive rate): FPR = the number of normal connections that are misclassified as attacks/the total number of normal connections.
Since the K-means clustering algorithm requires to input the number of clusters in advance, different values of clusters have great influence on clustering outputs. Both LKM and PCA-KM incorporate the K-means method. Therefore, Figures 12 and 13 illustrate the performance of K-means, LKM, and PCA-KM when the number of clusters equals 10, 12, 14, 16, 18, 20, 22, 24, 26, and 28.

DR versus the number of clusters.
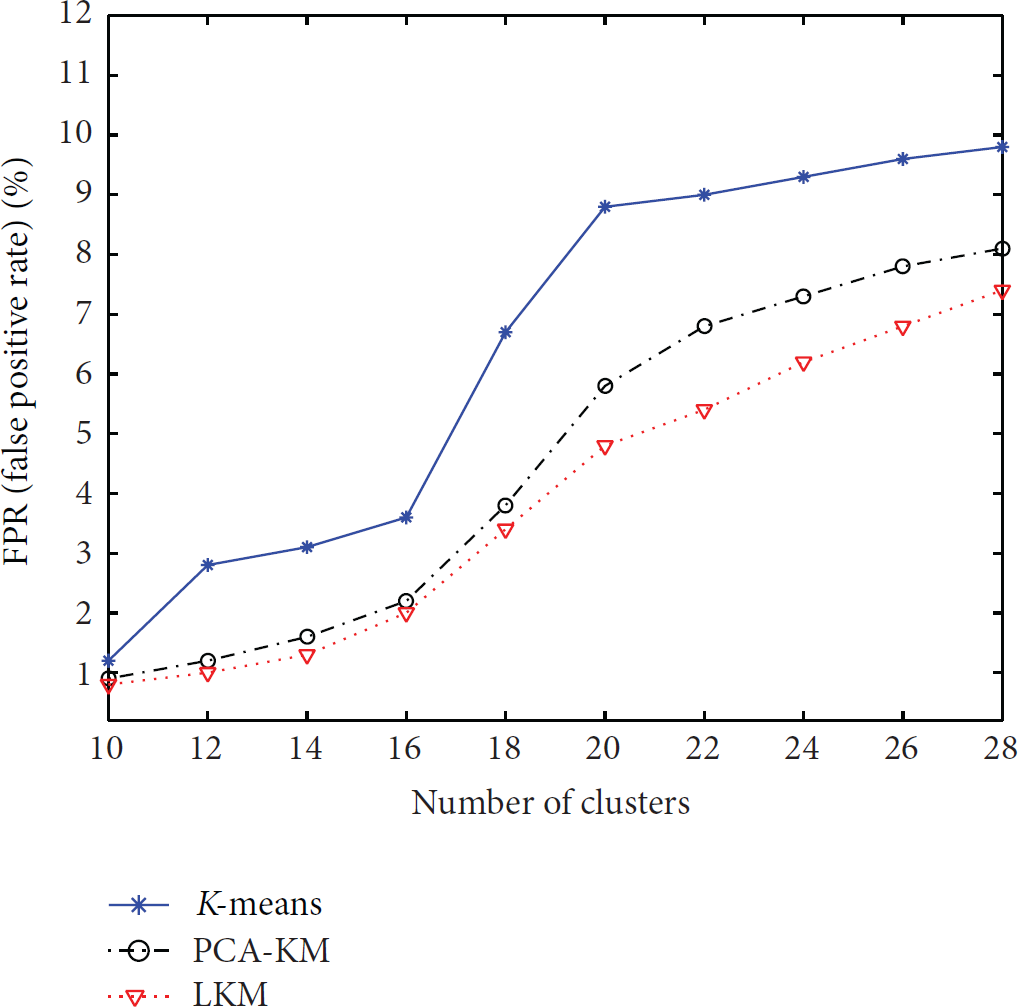
FPR versus the number of clusters.
With the increment of the number of clusters, DR and FPR also increase. Figures 12 and 13 show that when the number of clusters is rare, abnormal data after training are rare. Many unusual attacks are recorded as normal and assigned to normal class while normal ones will not be assigned to abnormal class. But when the number of clusters increases, the abnormal class system after training also increases. Because of the supervised feature extraction (LDA), LKM detects more attacks and makes fewer mistakes than PCA-KM and K-means.
When Figures 12 and 13 are mapped into receiver operating characteristic (ROC) curve, relationship between DR and FPR can be reflected directly as Figure 14.

ROC curve of DR and FPR.
Seen from the ROC curve, FPR increases gradually with DR. At initial stage, the curve of LKM is relatively steep, indicating that DR can have greatly improvement at the expense of FPR. Then as FPR increases, DR begins to rise slowly. When the number of clusters is about 22, curve of LKM is relatively flat even FPR has increased significantly and DR increases significantly small. In general, curve inflection point is considered the best point of the system performance. Therefore, optimal number of LKM clusters is 22 or so.
5. Discussions
Since K-means is a classical algorithm in data mining, many literatures have done a lot of researches to improve the performance of K-means algorithm. Here we will make comparisons between some typical algorithms and our work in detail. Napoleon and Pavalakodi proposed PCA-Km algorithm [18], which incorporated principal component analysis (PCA) and K-means for original high-dimension data set analysis.
The main difference between LKM and PCA-KM is described as follows. LDA, the key technology used in LKM, is a supervised feature extraction method to screen low-dimension features with the strongest discriminating power from the high-dimension space. LDA not only maintains optimal projector identification information of original data, but also improves the classification performance and efficiency. PCA, the key technology used in PCA-KM, is an unsupervised feature extraction method that selects the original data projection with the maximum feature covariance. PCA and linear transformation are used for dimension reduction; then dimension-reduced data set is clustered by K-means clustering algorithm; Ding and He proved that continuous solutions of discrete K-means clustering membership indicators are data projections on principal directions (principal eigenvectors of the covariance matrix) [19]. New lower bounds for K-means objective function are derived, and it is directly related to eigenvalues of covariance matrix. Ding and Li combined linear discriminant analysis (LDA) and K-means clustering into a coherent framework. The most discriminative subspace is selected adaptively [23]. Relations among PCA, LDA, and K-means were clarified. However, further experiments and comparison are not given in detail. It is shown in Section 4 that characteristics extraction time of PCA is higher than LDA. Unlike PCA, LDA is a supervised feature extraction method. LDA maintains the best projection identification information of original data as well as classification performance.
6. Conclusions
To achieve IDS in MSNs, data gathered by mobile nodes covers multidimension space, including system logs, network packets, important documents, and status or behavior of user activity. Applying clustering analysis in intrusion detection is the key to realizing intelligent IDS. By K-means clustering analysis for high-dimension data, the performance of data analysis in intrusion detection can be enhanced. Through linear dimension reduction method of LDA, the LKM algorithm proposed in this paper reduces the curse of dimensionality. Other irrelevant attributes in high-dimension space are eliminated, and characteristics of sample extraction time have been shortened. The integration of K-means clustering into dimension-reduced data set improves clustering accuracy, which is rather meaningful in enhancing data analysis of high-dimension data set. As a result, the anomaly detection rate increases, which improves the performance of IDS. However, the initial centers of K-means algorithm used in the LKM algorithm are chosen arbitrarily, which have a great impact on results of clustering analysis. Optimization of initial centers of the LKM algorithm will be discussed in our future work.
Footnotes
Glossary
Conflict of Interests
The authors declare that there is no conflict of interests regarding the publication of this paper.
Acknowledgments
This work is supported by NSFC (61100199, 61100213, 61170276, 61201160, 61201222); Specialized Fund for the Doctoral Program of Higher Education (20113223120007); Natural Science Foundation of Jiangsu Province (BK20141427); China Scholarship Council Project (201208320212); Program of Natural Science for Universities of Jiangsu Province (12KJD510007); Open Lab Fund of NUPT (2014XSG03); Scientific Innovation Project for Postgraduates of Universities in Jiangsu Province (CXLX13_463).