
Abstract
Mobile node location predication is critical to efficient data acquisition and message forwarding in participatory sensing systems. This paper proposes a social-relationship-based mobile node location prediction algorithm using daily routines (SMLPR). The SMLPR algorithm models application scenarios based on geographic locations and extracts social relationships of mobile nodes from nodes' mobility. After considering the dynamism of users' behavior resulting from their daily routines, the SMLPR algorithm preliminarily predicts node's mobility based on the hidden Markov model in different daily periods of time and then amends the prediction results using location information of other nodes which have strong relationship with the node. Finally, the UCSD WTD dataset are exploited for simulations. Simulation results show that SMLPR acquires higher prediction accuracy than proposals based on the Markov model.
1. Introduction
Participatory sensing is a recent appearing sensing technology which emphasize that people participate in the sensing process. Participatory sensing enables individuals and communities to gather, analyze, and share local knowledge and to subsequently make intelligent decisions and also offer social services. The earliest research of participatory sensing is executed by Srivastava et al. who have proposed the conception of urban sensing in a technical report [1] in the year 2006 to discuss the system architecture and technical methods of urban sensing. The MSG (Mobile Sensing Group) laboratory at Dartmouth College also conducts research on this area, including BikeNet [2], SoundSense [3], CenceMe [4, 5], MetroSense [6], and Bubble-Sensing [7].
Participatory sensing systems rely on mobile phone users to sense and transmit data with diverse purposes in the process of monitoring or solving a particular problem. Based on the large number of users, participatory sensing systems have the potential to acquire large amounts of data from various places and address large-scale location-based problems [8–10]. A typical example of location-based participatory sensing systems collects and records air quality measurements to monitor the pollution of a particular location. What is more, the smartphone with Internet connectivity can also contribute to the participatory sensing systems' growth. In [11], a solution based on web services is proposed to permit the interaction between a mobile application and the IPv6 compliant WSNs scenario.
In participatory sensing systems, mobile devices are usually weakly connected. Due to uncertainty of connection, nodes sometimes need encounter opportunities to accomplish data communication and transmission. If the location of mobile nodes can be predicted ahead of several time slots, the service quality and efficiency of the system will be remarkably improved.
In order to solve the location prediction problems, human mobility has been analyzed at different geographic scales [12–14]. In [12] the limits of predictability provided by humans' mobility patterns are examined. The data that is collected by 50,000 anonymous mobile phone users over a period of three months has been used to study the humans' mobility patterns, and different entropy measures are adopted in this research to estimate the potential predictability in human dynamics. Based on their analysis, a 93% potential predictability in user mobility across the whole user base is found in their report. In [13] the location data from 100,000 mobile phone users collected by tracking each person's position for six months is investigated. This research shows that individual mobility patterns of the test persons can be described by a single spatial probability distribution after some corrective preprocessing. Thus the results of this study suggest that humans generally follow simple reproducible patterns.
Based on the human mobility analysis, different techniques based on the Markov model have been applied to location prediction problems of human individuals. In [15], a set of discrete locations has been defined using the WIFI cells on a university campus. Two different kinds of location predictors, the kth order Markov predictor as well as a LZ-based predictor, are tested in predictions to the next location. Based on the test results, the research shows that the second order Markov predictor with a certain fallback feature performs best and provided a median accuracy of 72%. Literature [16] presents a similar extended Markov predictor, which takes the arrival time and residence time into account. Specifically, delay embedding is used to extract location sequences of a certain length from time series. Then these sequences are directly used to predict a user's location, and the prediction result is obtained by comparing the last observed locations to all embedded location sequences.
Meanwhile, hidden Markov models (HMMs) are also considered to predict human mobility. Literature [17] presents a hybrid method on the basis of hidden Markov models. The proposed approach clusters location histories according to their characteristics, and the latter trains an HMM for each cluster. Based on HMMs, location characteristics are considered as unobservable parameters and the effects of each individual's previous actions are also accounted in the process of predictions. Finally, a prediction accuracy of 13.85% can be achieved when considering regions of roughly 1280 square meters.
Except for the Markov model and HMM, there are some other location prediction algorithms that are used to analyze location information in literature [18–26], such as the artificial neural network-based algorithm [18], Bayesian network-based methods [19, 20], mobile-sink-based methods [21, 22], the regression-based method [23], and mobile anchor assisted localization algorithms [24, 25]. These methods predict future positions of nodes from different perspectives, which focus on the behavior of each single node.
However, in fact the behavior of a node is decided not only by location state of the former period but also by the social relationship of mobile users.
In this paper, a social-relationship-based mobile node location prediction algorithm using daily routines (SMLPR) is proposed. In this approach, the social relationship of nodes is used to optimize the location prediction algorithm so that it can better adapt to participatory sensing applications and promote the prediction accuracy. The remainder of this paper is organized as follows: the network model is illustrated in Section 2. Section 3 specifies the mobile node location prediction algorithm. Extensive simulations have been done for performance evaluation in Section 4. Section 5 concludes the paper.
2. Network Model
Human movements often exhibit a high degree of repetition including regular visits to certain places and regular contacts during daily activities. In this paper, a hybrid urban network model is proposed for participatory sensing systems, as illustrated in Figure 1. The map M is partitioned into small regions. In other words, M is represented as a finite set of regions

Participatory sensing scenario.
As mentioned above, the network has been reinforced as a mixture of an opportunistic network and a centralized infrastructure which is shown in Figure 1. The centralized infrastructure consists of a number of wireless access points (APs) and a backbone connecting the APs. The purpose of this model is to collect data from a peer-to-peer network (scenario 2 in Figure 1) or WIFI APs which is in the vicinity of the consumers (scenarios 1 and 3 in Figure 1), rather than collecting it from any 3G/4G server. Mobile nodes that are carrying smart device can only access to the network when they are walking into the transmission range of any AP, and data transmission can only occur between peer counterparts when they fall into each other's transmission range as in normal opportunistic networks.
Definition 1 (location).
Inside a geographical region, a mobile device closest to a fixed location is selected to perform data collection and the collected data is sent to a set of bounding APs where it is stored and pulled by the consumers. The fixed location is termed as the aggregation location.
Definition 2 (location granularity).
An aggregation location includes a set of APs in adjacent position. The granularity of the location represents the location's transmission range which is decided by the number and the scope of the APs in the same geographical region.
In this study, historical trajectories of users connecting with APs are recorded and they are divided by time granularity. Trajectory of a moving user is defined as a sequence of points
The urban scenario is transformed into a graph

Using the greedy algorithm of Kruskal [27], the maximum spanning tree from the graph G is easily got, denoted as T. After choosing a weight λ as the location granularity, the edge in T whose weight is less than λ will be cut down, and leave the tree into some separated connected components. One connected component is regarded as a location. Figure 2 shows the process of constructing the aggregation locations, and a construction with granularity 0.6 is represented in Figure 2(c).

Process of location construction.
In most WLAN datasets, connection is recorded by the format (node, contact time, APs, and signal strength), and one or more APs which a user connects to may appear in one item at the same time, which may cause users' location confusion. Therefore, after getting the set of locations in the mobility scenario, estimating which location the user belongs to in the same period is also needed. The signal strength between a user's mobile device and a WIFI AP in the WLAN dataset can help to solve this problem. A weight between the user and location can be calculated by
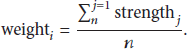
In formula (2), n represents the number of aps in location i, and strength j represents the signal strength between the user A and AP j (

3. Algorithm Design
This paper proposes a simple method for predicting the future locations of mobile nodes, on the basis of their previous ways to other locations. The proposed approach considers different daily time periods, which relates to the fact that users present different behaviors and visit different places during their daily routines. Therefore the hidden Markov model is introduced to capture the dynamism of users' behavior resulting from the daily routines.
What is more, users experience a combination of periodic movement that is geographically limited and seemingly random jumps correlated with their social networks. Social relationships can explain about 10% to 30% of all human movement, while periodic behavior explains 50% to 70% [28]. On the basis of this theory prerequisite, social relationship between nodes is also exploited in this paper for optimization and amendment of location prediction result.
3.1. Hidden Markov Prediction Model
In urban scenario, users adopt different behaviors during different periods of daily time, and the users' daily routines may influence users' trajectories. Thus the different daily time periods (same as daily sample) should be considered in order to guarantee a more realistic representation. With filtering and hidden Markov model, this can be done in a simple way.
Hidden Markov model (HMM) is a well-known approach for the analysis of sequential data, in which the sequences are assumed to be generated by a Markov process with hidden states.
Figure 3 shows the general architecture of an instantiated HMM. Each shape in the diagram represents a random variable that can adopt any number of values. The random variable

Example of hidden Markov model.
Given the result of filtering up to time t, one can easily compute the result for
In participatory sensing system, for each application scenario, the hidden Markov model can be used to predict the future location state of each mobile node. Prediction process includes the following steps.
3.1.1. Preparatory Stage
At the beginning, the system needs to collect enough information of user movement trajectories to construct the Markov chain, and therefore a “warm-up” stage is assumed in the prediction system. During preparatory stage, the system only collects historical data and it cannot provide any predicted information. The warm-up stage can last for one day or one week depending on the amount of information collected.
3.1.2. Determination of State Set
The location elements in the collecting data are extracted and they are denoted as set L. As set L contains a number of location elements, the location of higher visiting frequency is chosen as state set of the system, denoted as set E. If there are m locations in the current scene, the state space can be denoted as
3.1.3. Discretization of Data Set
Statistical data of all users related to state set E is made. Then the data set of each user is processed to be discrete set of the fixed time period, so the set after discretization is denoted as follows:

3.1.4. Calculation of 1-Order Transition Probability Matrix

Therefore, suppose that there are m locations in the set, an

Given

For example, assume that the initial state is

3.1.5. Update the Result from the New Evidence
The different daily time periods (daily sample) is regarded as the evidence variable e, so the set of evidences can be defined as

For each daily sample r, a diagonal matrix

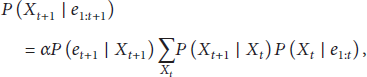
Based on all of the above, calculate the probability of node arriving on location i at next time slot

It can be considered that the state
The formula above incorporates a one-step prediction, and it is easy to derive the following recursive computation for prediction of the state at

3.2. Social-Aware Prediction Optimization
In participatory sensing system, a mobile node can be the social node carrying data acquisition equipment. Thus, the social relationship is used to estimate the future locations of mobile nodes and optimize the prediction result of hidden Markov model.
In this paper, capturing the evolution of social interactions in the different periods of time (daily sample) over consecutive days is the aim, by computing social strength based on the average duration of contacts.
Figure 4 shows how social interaction (from the point of view of user A) varies during a day. For instance, it indicates a daily sample (8 a.m.–12 p.m.) over which the social strength of user A to users B and C is much stronger (less intermittent line) than the strength to users D, E, and F. Figure 4 aims to show the dynamics of a social network over a one-day period, where different social structures lead to different behavior when a user moves towards the social community that the user is related to.

Contacts a user A has with a set of users in different daily samples
As illustrated in Figure 4, the total contact time of mobile nodes A and B during a daily sample

Hence the social strength between any pair of nodes A and B in

According to formula (15), the social relationship matrix of nodes in
Suppose that it used social relationship to calculate the probability of node A arriving at the location i (


Given the relationship weight of node A and node
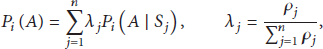
According to the location distribution of all the nodes belonging to C, the probability of node A arriving at different location can be obtained. And combined with the prediction result from hidden Markov model and using weight formula (19) to calculate the probability distribution of node A arriving at all the location in the location set, the location having the maximum of the visiting probabilities is considered as the output of the prediction algorithm:

It is beneficial to use social relationship to optimize the prediction result, making the transition probability matrix sparse and improve the accuracy of the prediction model.
4. Experimental Analyses
4.1. Simulation Configuration
In this paper, the experiment data is from the dataset provided by Wireless Topology Discovery (WTD) [30], from which two-month-period data, total 13,215,412 items, is chosen to simulate the prediction algorithm. There are 275 nodes and 524 APs (access points) in the dataset. According to the vicinity of AP positions, the number of locations at which APs are clustered is shown in Figure 5.

Quantity of locations.
Figure 5 shows that when the defined granularity λ becomes bigger, the quantity of the locations in the gained scenario will also become larger. When λ is defined as 1, the quantity of location is equal to the total number of APs. The location granularity λ has been given as 0.5 in following experiment.
4.2. Similar User Clustering
In order to predict the further location of mobile nodes using social relationship, the social network structure in the system should be primarily considered. Based on the quantization formula (15), we calculate the relation strength between any pair of nodes A and B in different daily sample (a.m., noon, p.m., and evening), and the social network structures of the dataset are achieved, illustrated in Figure 6.
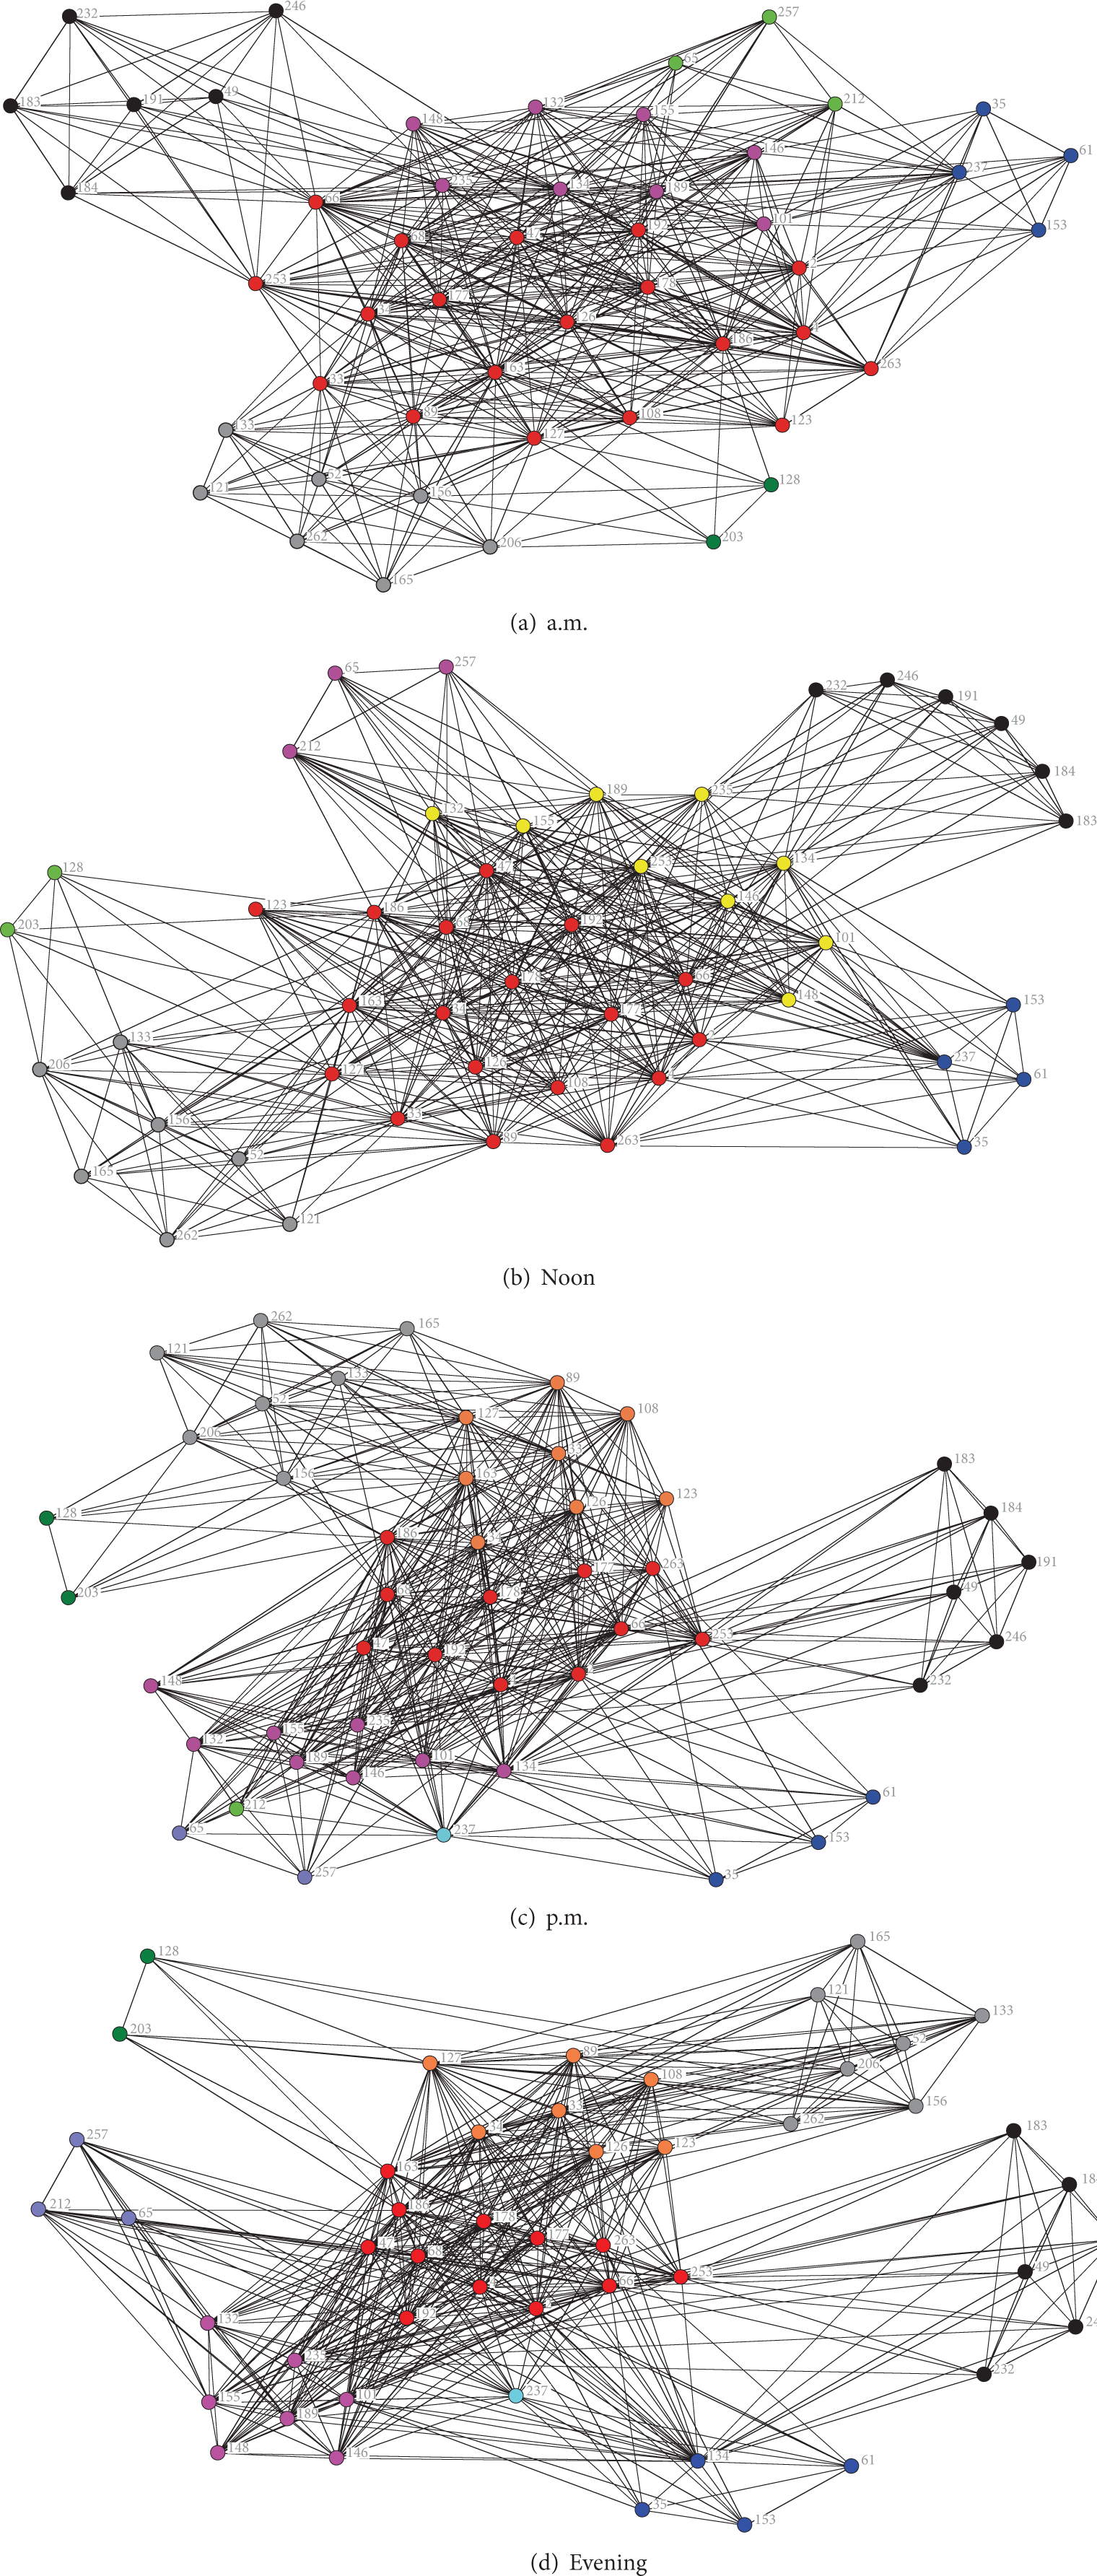
Social network structures of the dataset in different daily samples.
A hierarchical clustering method, complete linkage clustering, has been used to cluster mobile users. Figure 6(a) shows the social network clustering result in the a.m. period, and the clustering structures in the period of noon, p.m. and evening are, respectively, illustrated in Figures 6(b), 6(c), and 6(d).
4.3. Prediction Accuracy
In order to evaluate the accuracy of prediction model, the processed node locations can be divided into two parts: using the 50% that has been chosen from the original information to train the Markov model and using the rest as the test case of the prediction model. The prediction precision

In formula (20), n represents prediction times, and

Firstly, the training data set is used to train the prediction model which includes standard Markov model (SMM) and daily-routine-based prediction model (MLPR). Afterward the test cases are used, respectively, to verify the above mentioned two models. The prediction accuracies of the two prediction models are shown in Figure 7, where Figure 7(a) shows the prediction accuracy of nodes from 1 to 92, Figure 7(b) shows the prediction accuracy of nodes from 92 to 184, and Figure 7(c) shows the prediction accuracy of nodes from 185 to 275. From Figure 7, it indicates that the daily-routine-based mobile node location prediction algorithm (MLPR) gains a better performance than standard Markov model. This shows that daily routines can promote the accuracy and improve the algorithm's performance.

Prediction precision of SMM and MLPR.
Then make a comparison among the proposed social-relationship-based mobile node location prediction algorithm using daily routines (SMLPR), O2MM and the
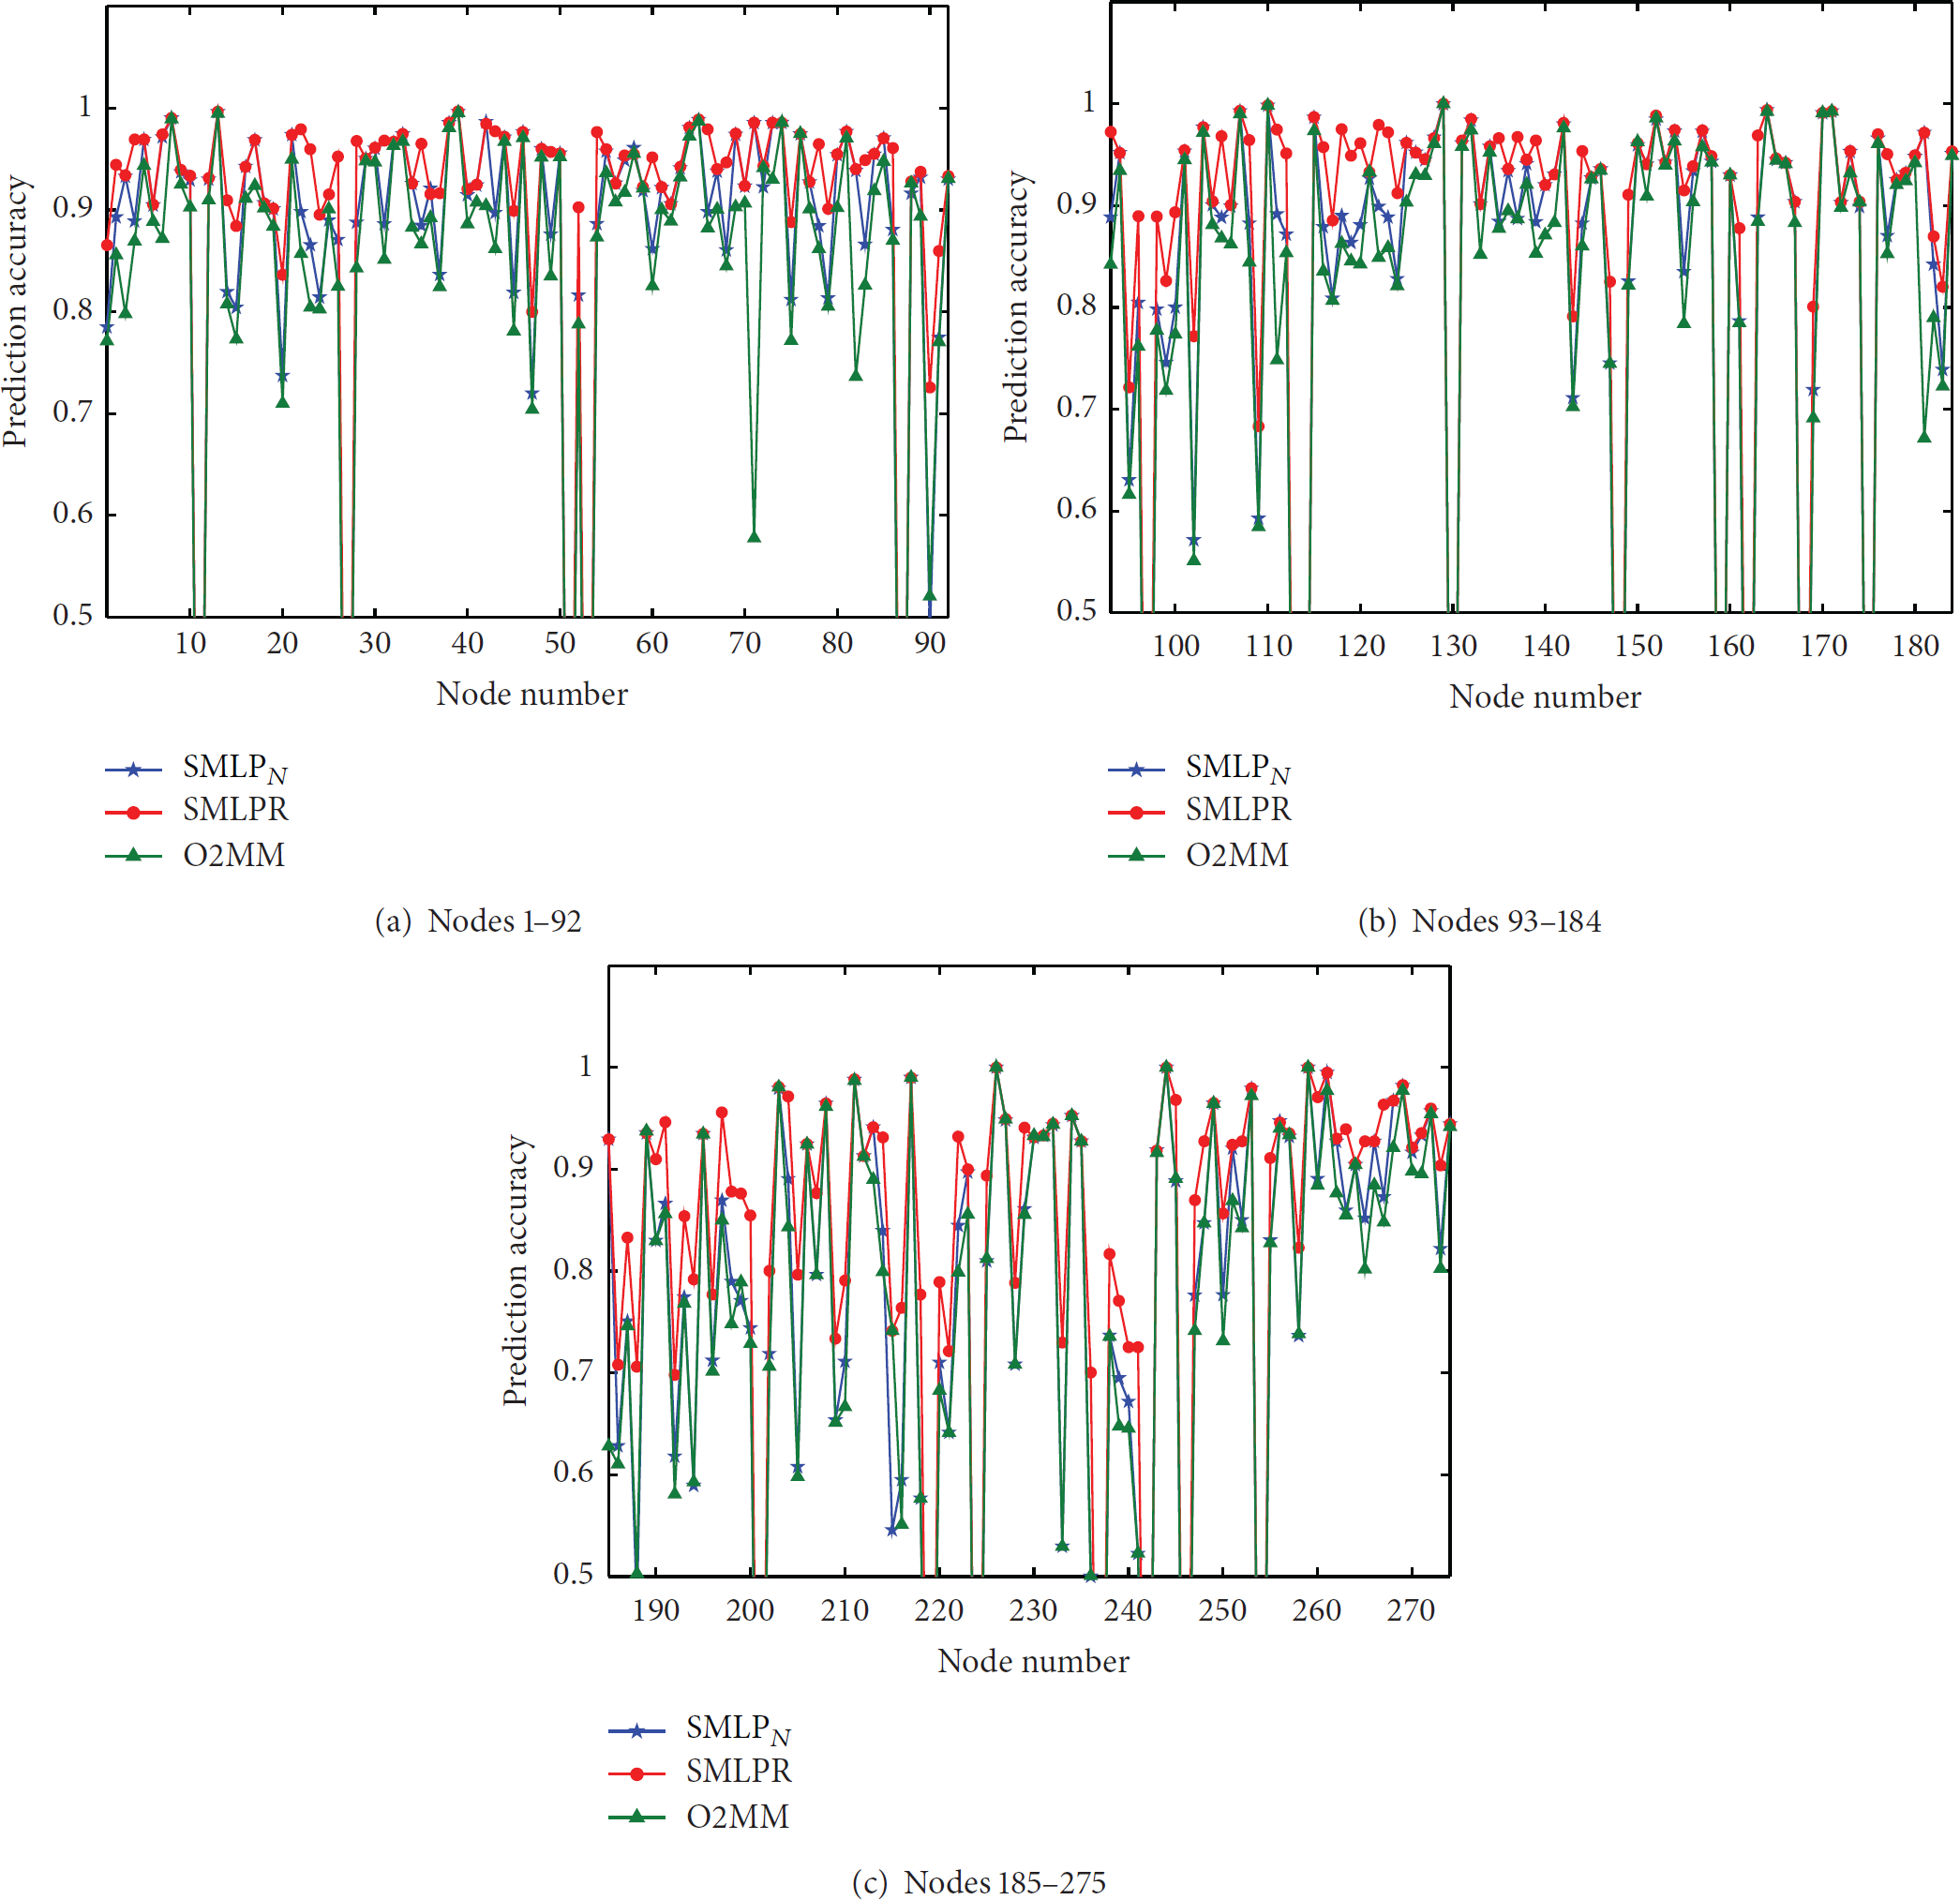
Prediction precision of O2MM,
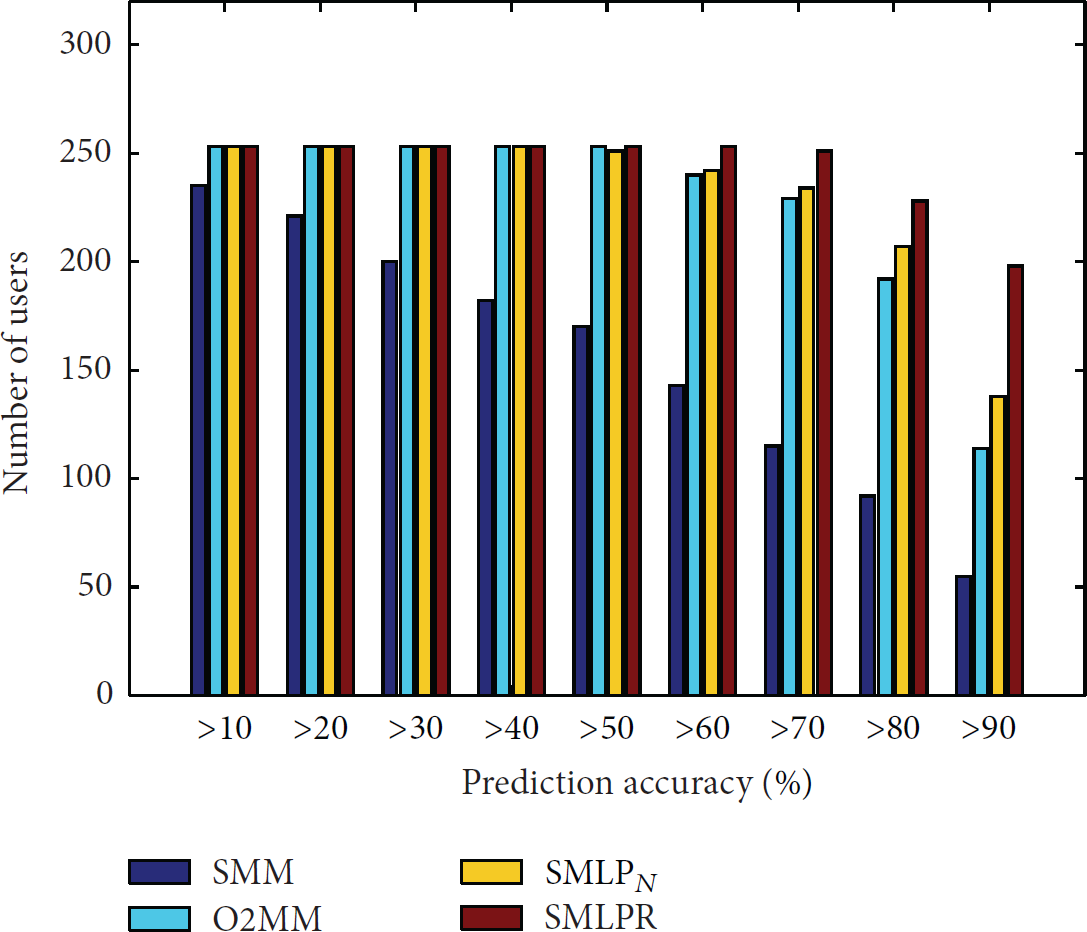
The number of users in different precision range.
Lastly, the performance of these algorithms is shown as Table 1. The accuracy of SMLPR is 30% higher than the standard Markov model and nearly 10% higher than the second order Markov model. Then a better result could also be obtained in the comparison between SMLPR and
The algorithm performance comparison.

In the aspects of space cost from Table 1, the complexity of SMLPR is
4.4. Impact of Location Granularity
In location-based mobility scenario, location granularity may have a significant influence on the prediction accuracy. In order to evaluate the impact of location granularity, the algorithms' performance is tested by adjusting the granularity value λ, and the result is shown in Figure 10.
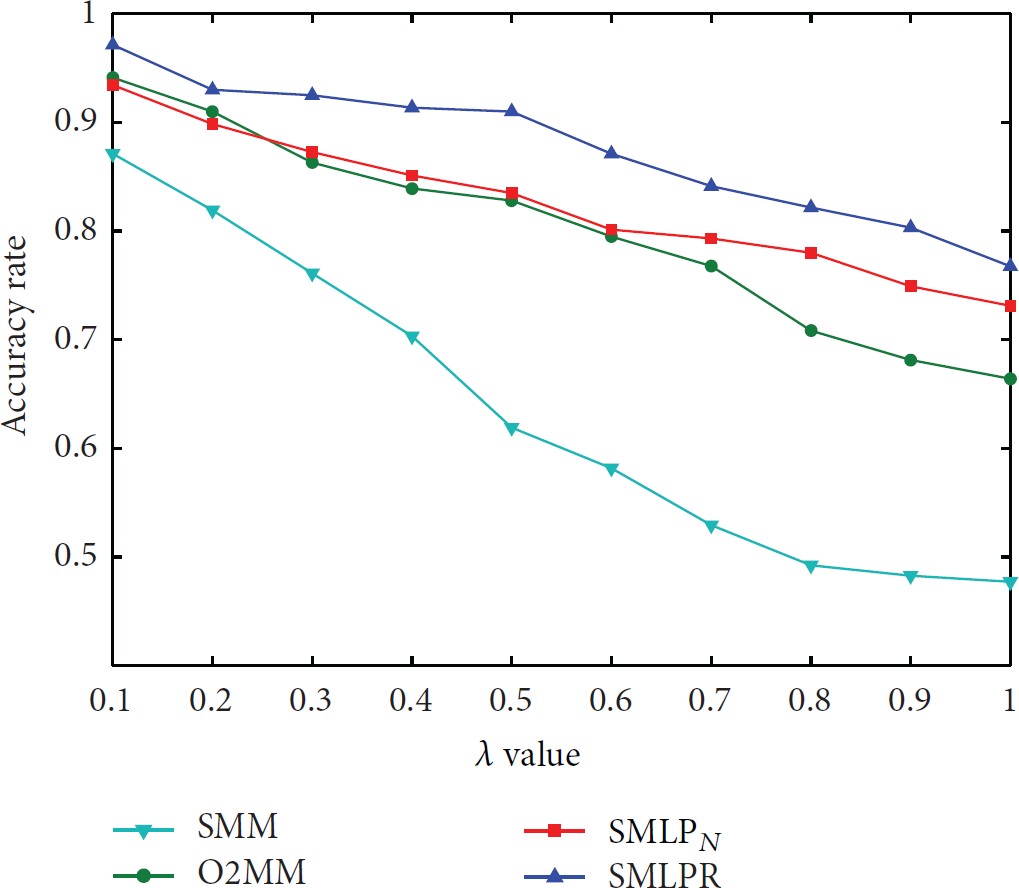
The influence of location granularity to prediction accuracy.
As shown in Figure 10, with the increasing of the location granularity λ, due to the number of locations in the scenario, the average accuracies of these four algorithms are relatively decreasing. In these algorithms, SMM and O2MM meet a more significant impact on the factor of location, and the accuracy reduces approximately to 25%. For SMLPR, it shows a relatively moderate downward trend and the location granularity effect to SMLPR is not very obvious.
5. Conclusion
In this paper, the influence of opportunistic characteristic in participatory sensing system is introduced and the problems of sensing nodes such as intermittent connection, limited communication period, and heterogeneous distribution are analyzed. This paper focuses on the mobility model of nodes in participatory sensing systems and proposes the mobile node location prediction algorithm with users' daily routines based on social relationship between mobile nodes. According to the historical information of mobile nodes trajectories, the state transition matrix is constructed by the location as the transition state and hidden Markov model is used to predict the mobile node location with the certain duration. Meanwhile, social relationship between nodes is exploited for optimization and amendment of the prediction model. The prediction model is tested based on the WTD data set and proved to be effective.
Footnotes
Conflict of Interests
The authors declare that there is no conflict of interests regarding the publication of this paper.
Acknowledgments
This work is supported by the National Natural Science Foundation of China under Grant no. 61272529, the National Science Foundation for Distinguished Young Scholars of China under Grant nos. 61225012 and 71325002; Ministry of Education-China Mobile Research Fund under Grant no. MCM20130391; the Specialized Research Fund of the Doctoral Program of Higher Education for the Priority Development Areas under Grant no. 20120042130003; the Fundamental Research Funds for the Central Universities under Grant nos. N120104001 and N130817003; and Liaoning BaiQianWan Talents Program under Grant no. 2013921068.