
Abstract
Recently, the Internet of things (IoT) became useful in various applications based on the web communication technology. The IoT has great potential in several service domains including cultural, educational, or medical areas. We consider a recommendation technique suitable for the IoT-based service. A personalized recommender system often relies on user preferences for better suggestions. We notice that we need a different recommendation approach in the IoT platform. While the conventional recommendation approaches rely on user preferences provided by users, these approaches may not be suitable for the IoT environment. The conventional systems utilize user ratings for items to compose recommendation list. This implies that the systems require additional user activities such as adding their preferences. We notice that the IoT environment can naturally provide user information such as users’ item selection history without users’ additional actions. We propose a recommendation model that does not require users’ additional actions and is more suitable for the IoT environment. We examine the usability of the bandwagon effect to build a new recommender system based on users’ selection history. We first consider the bandwagon effects in movie recommendation domain and show its usefulness for the IoT. We then suggest how to use the bandwagon effect in recommender systems with IoT.
1. Introduction
Recently, many researchers studied the Internet of things (IoT). The basic concept of the IoT is that various things or objects are interconnected with each other and achieve their common purpose [1]. Various types of things or objects can be interconnected by utilizing wireless communication technology such as radio frequency identification (RFID) or near field communication (NFC) [2, 3]. For example, in logistics domain, researchers examined reduction of logistics by addressing purchasing of materials, transportation, and storage using the IoT [4, 5]. People also considered efficient methods that analyze personal information such as social or historical activities on the web using smart devices in the IoT [6].
We can utilize the IoT in several domains and the IoT has great potential as a novel paradigm of modern wireless telecommunications [2]. We, in particular, consider the IoT in a recommender system on the web and propose a new recommendation model for the IoT. In other words, we apply the IoT concept to the recommender systems based on user activities collected through the IoT.
With the development of the web, many people can use lots of information. These Internet users can upload their data and download wanted information using web platform; YouTube is a good example. In addition, users make use of web services such as Google and Yahoo! to search for images, songs, or video content available on the web. The web has, thus, become a platform to upload and share content where lots of data are available. However, the huge amount of data is often an obstacle to finding relevant information because there are also a lot of spam data and erroneous information that is simultaneously present. For this problem and efficiency of searching data, several researchers have suggested recommender systems as a solution [7–10].
The recommender systems often rely on the collaborative filtering (CF) approach [11–13], which is a collective intelligence technique. In general, a CF approach employs user information such as ratings, locations, or preferences to filter results. For example, assume that user A wants a certain recommendation. The conventional way of CF is to first select neighbors. The neighbors are a group of users with similar preferences to user A [14, 15]. The next step is to select items based on the preferences of neighbors and suggest the selected items to A.
The recommender systems based on CF need an additional operation that analyzes the user preferences since the systems predict and recommend items to users by addressing users’ actions such as ratings or commenting for items. This implies that the conventional CF approaches for the recommender systems may not be appropriate for the IoT which provide users’ selection histories for items since the approaches utilize users’ other activities such as the ratings for items. Because of this reason, we show existence of the bandwagon effects that affect a choice of an item to other users’ choices to build the recommender systems that are appropriate for the IoT. If the bandwagon effects exist in Internet contents, the effects can lead to recommend contents using only users’ selection history. There exist the recommendation techniques utilizing the IoT [16, 17]. These techniques employ context-aware systems. We show the existence of the bandwagon effects to propose a novel recommendation technique that does not employ context-aware systems for the IoT.
Figure 1 shows the flow chart of this paper. We analyze the problems in CF approaches and design recommendation models using the bandwagon effect to propose more suitable models on the IoT environment. Then, we validate our models using statistical experiments. Finally, we identify and provide suitable recommendation model for the IoT.

Flow chart of this paper.
We first revisit the conventional recommendation approaches and the studies on the bandwagon effects on the web services in Section 2. Then, we propose our approach that verifies the bandwagon effects on the movie domain in Section 3. In Section 4, we show the test results and analysis for our approach. Finally, we conclude this paper with future work in Section 5.
2. Related Work
2.1. Collaborative Filtering Approach
A collaborative filtering (CF) approach based on user preferences consists of the following three steps: (1) calculate similarities between users using user preferences, (2) choose neighbors of user A who seeks recommendations (neighbors are a group of users who have similar preferences to user A), and (3) estimate the preference for a specific item based on the neighbors ratings.
2.1.1. Calculating Similarities
In the literature, we often calculate the user similarity using the Pearson correlation coefficient in (1) or the Cosine similarity in (2) [12, 13, 15]. Consider


Figure 2 shows an example of the first step for calculating the Pearson correlation coefficient. Since the Pearson correlation coefficient between

The Pearson correlation coefficient calculation.
2.1.2. Selecting Neighbors
We can choose neighbors using results of (1). We first fix a certain correlation coefficient value (close to 1) as a threshold and select users whose correlation coefficient to
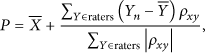
2.1.3. Predicting Preferences
Once we have all neighbors, we then predict preferences based on the ratings of neighbors using
2.1.4. Applications of CF Approaches
The CF is commonly applied in industries. Amazon (http://www.amazon.com) recommends items to users using the item based CF [18]. Google News (http://www.news.google.com) also provides personalized recommendations through CF [19]. Netflix (http://www.netflix.com) has supported various recommendation studies including CF by Netflix Prize (http://www.netflixprize.com).
2.2. Content-Based Filtering Approach
The content-based filtering is to recommend an item that is similar to the items described in the user preference. This approach relies on both the user preference and item properties [20, 21]. In other words, the content-based filtering tries to recommend items that have similar properties and the user liked in the past. This technique computes the similarity between items by the Euclid distance, the cosine value, or the Jaccard coefficient [22–24]. Since the content-based filtering analyzes the item properties, it often provides a better recommendation. However, depending on application domains, we may not be able to measure the similarity between item properties [25].
Flickr (http://www.flickr.com)—a photo sharing site—does not offer a recommendation service but contains a large volume of photos. Flickr employs the photo tag for classifying photos. Even though it does not actually recommend photos to users, Sigurbjornsson and van Zwol [26] introduced the recommendation of tags to a user based on the tag contents in the past for Flickr. Their method allows users to add tags to photos in an efficient way. Oord et al. [27] employed the BOW (bag of words), a method for information retrieval, to extract negative words and positive words which executes the content-based filtering in consideration of implied meaning.
2.3. A Suitable Recommendation Approach for the IoT Paradigm
The conventional approaches including collaborative or content-based filtering utilize user preferences for predictions and recommendations. This implies that these approaches always need users’ specific actions for the recommendation processes. In the IoT paradigm, we can easily obtain users’ item selection history. Because of this reason, if there is a recommender system that predicts user preferences based on selection history, then we do not need to require user actions to recommend items. In other words, we can figure out what users want from their selection history.
Figure 3 shows a recommendation processes in the IoT paradigm based on the conventional approaches. The first step in Figure 3 is to gather the personal data through the IoT. We can gain the users’ selection history through the first step for recommendation processes. The second step is to gather the user preferences. In this step, the systems have to require specific actions from each user. After these steps, the systems calculate the similarities between users or items and then select items to recommend.

The recommendation processes based on the conventional approaches.
We notice that the systems may provide a recommendation list without the second step in Figure 3 if we fully utilize the IoT paradigm. In other words, the systems can make a recommendation only using users’ selection history. We also consider the bandwagon effects in recommendation based on users’ selection history.
2.4. The Bandwagon Effects in Recommender Systems
2.4.1. Recommendation Approaches Utilizing the Bandwagon Effects
The bandwagon effect is a phenomenon in which fashionable information affects personal choices for an item [28]; when most people want an item, a person also wants the item as well. The rapid increase of the social network usage shows one of the typical examples of the bandwagon effect in the web service. When a social network service becomes popular and its usage becomes larger and larger, many other people also become interested in the service. This interest leads other people to join the social network service. We have observed several such examples in practice including twitter or Facebook. We can find the bandwagon effect in politic area [29] as well as clothes and IT products. In particular, some online shopping malls and home shopping services utilize the bandwagon effect for marketing. Shyam Sundar et al. [30] show that users’ purchase intention and attitudes for a product are influenced by other users’ reviews and evaluations in online shopping malls. Their study shows that a users purchase intention for a product increases when other users are greatly interested in the product and the user knows about this interest. Because of the bandwagon effect in online malls, the research insists that well-designed web sites that reveal users’ opinions can improve purchase rate.
2.4.2. Advantages of the Bandwagon Effects for the IoT
We expect that the bandwagon effects also exist in the online contents such as music, movie, and UGC (user generated content). We verify the existence of the bandwagon effects in a movie recommendation domain. Often film distributors promote their movies using the box office result. They expect that when the box office result is large, it brings more people to the movie; namely, there exists the bandwagon effect in promoting movies by the film distributors.
If there is the bandwagon effect in movie domain, then we can identify the trend items and the users who jumped on the bandwagon. Moreover, we can cluster the users who frequently select the trend items as a similar group. Then, we can predict the users’ future selections based on the similar group. This means that we can design recommender systems without user preferences by utilizing the bandwagon effects. The designed systems are suitable in IoT environment.
3. Our Approach
3.1. Database
We test our approach using GroupLens (http://grouplens.org/dataset) movie database. Table 1 summarizes the movie database. We mainly utilize rating dataset composed of user ID, movie ID, and rating for our tests.
GroupLens movie database.

3.2. Identifying the Movies That Show the Bandwagon Effect
We consider that the popular movies can exhibit the bandwagon effects and classify the popular movies based on two criteria: rating and the number of views. We then generate the score that indicates the bandwagon effects by ratings and the number of views. We classify two sets for the movies with high ratings and views. Then, we characterize these two sets and propose a more suitable set for analyzing the bandwagon effects in movie domain.
We divide all users (69,898 users) by ten groups. In ten groups, one group is probe one and other nine groups are training one. We compare the popular movies that appear in two groups. Each group is selected once as probe set and other groups excluding the probe set become training set. Figure 4 illustrates this step.
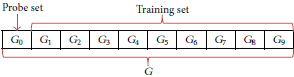
The example of training set and probe set.
In Figure 4, there are total 10 groups (from 
Equation (4) shows definition of the set of popular movies
Equation (5) indicates definition of the set of the movies which shows the bandwagon effect:

In (5),
4. Test and Analysis
We compare other two sets for the verification of the comparison between
The results of (5) based on movie ratings.

The results of (5) based on the number of views.

In each table, “Training set movies” and “Probe set movies” denote the number of popular movies extracted from the training set and the probe set, respectively. “Common movies” means the results of (5).
Table 2 shows the results of (5) based on the ratings. Note that the probe set (the training set) has about 47% (12%) common movies based on (5). Similarly, Table 3 shows the results of (5) based on the number of views. The probe set (the training set) has about 91.5% (91.1%) common movies.
As the frequency for the intersection of the popular movies between two sets increased, we can classify the movies that show the bandwagon effect more clearly. Thus, we check existence and frequency of these movies. We define the preference frequency as how many times a movie appears in each set. For example, if movie A appears in sets
The comparison results according to ratings.

The comparison results according to the number of views.
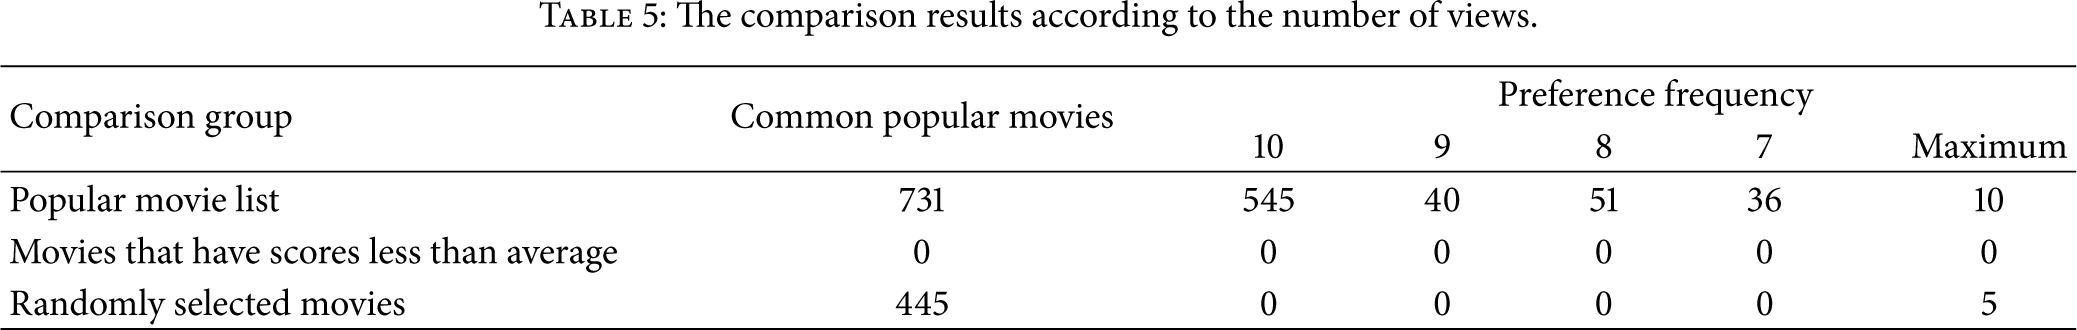
We can observe that the popular movies extracted from the training set are almost the same as the popular movies from the probe set, by comparing between preference frequencies of the probe set and the others. In each table, there are no movies that have more than seven preference frequencies in the comparison between the other two movie lists, a list of movies with less than the average scores and the list of randomly selected movies. The maximum frequency in these two lists is four based on ratings. When criterion is the number of views, the preference frequencies for the list of movies have less than the average scores and the lists of randomly selected movies are zero and five, respectively. We can confirm that all frequencies which appeared in these two lists according to two criteria are low value.
In summary, we verify that the popular movies extracted from lots of users, the training set, are similar to the popular movies in the probe set. We also find that the number of views is more suitable to identify the popular movies than ratings.
5. Conclusions and Future Work
We have shown the bandwagon effect in movie domain using the GroupLens database. People tend to choose movies that have been watched by many other people. We have also observed that the number of views is a better metric than rating for defining popular movies. We have checked that the popular movies extracted from lots of users are similar to the popular movies from a small size of user group through our test result. We have found that the number of views is a more suitable factor to identify the popular movies than ratings since our test results have shown that, for the common movie frequency, the number of views has 91.1% and 91.5% while the ratings have 12% and 45% in the training and the probe set, respectively. Because of this reason, we can conclude that our approach makes a recommendation list from user selection history based on the bandwagon effect. This has motivated us to model a recommender system suitable for the IoT environment, where various types of information are provided by IoT devices such as mobile phones or sensors.
In near future, we aim to apply our approach to other datasets to verify the bandwagon effect. The GroupLens database contains movies in 90s or before the 90s. Since nowadays people are able to get others’ opinions easily by the web or SNS, we think that the effect will appear more clearly in recent movies. Furthermore, to enhance the commercial applicability, our approach will be potentially exploring the relationships between e-marketing services adoption and e-marketing performance. Enterprises could then derive a better understanding and measurement of marketing activities that appropriately balance between traditional and e-marketing practice.
Footnotes
Conflict of Interests
The authors declare that there is no conflict of interests regarding the publication of this paper.
Acknowledgments
The research work presented in this paper is partially funded by the National Natural Science Foundation of China (NSFC), Grant no. 71402143, and by the Basic Science Research Program through the National Research Foundation of Korea funded by MEST (2012R1A1A2044562).