
Abstract
Smartphones have become ubiquitous personal devices so that much of sensitive and private information will be saved in the phone, and users have their own unique behavioral characteristics when using smartphones, so, to prevent private information from falling into the hands of impostors, there is a kind of identity authentication system based on user's behavioral features while the user is unlocking. However, due to the impact of environmental factors, changes of gesture will introduce bias into the feature data, which results in a diminishment of the system performance. To solve this problem, we propose an implicit identity authentication system based on keystroke behaviors, and it is the first attempt to consider the changes of a user's gesture. This system collects five keystroke features in the background and analyzes to identify different users without additional hardware supporting. We present our work with an experimental study, and our experiments show that the accuracy of identity authentication system we proposed is up to 99.1329%. Comparing with the identity authentication system without considering the impact of gesture changes, the EER of the system considering the impact of gesture changes is decreased by 1.2514%.
1. Introduction
Smartphones have become ubiquitous personal devices. A recent report [1] points out that the sales of smartphones worldwide topped 1.2 billion in 2014, which is up to 28% from 2013. Smartphones allow users to chat on line, transfer files, and trade anywhere and anytime, so that much of sensitive and private information will be saved in the phone. This inevitably poses great security risks to smartphone users [2–4], because the phone contains many important private information, such as confidential documents, login information, and contact list. In addition, as a portable device, the smartphone is easier to be lost or stolen than a typical desktop electronic device. Therefore, how to prevent private information from falling into the hands of invalid users (hereafter called impostors) is a key point for smartphone developers to study.
Nowadays the password form is adopted in most phones to protect privacy, so that users need to unlock the screen before using it, which generally includes digital password and graphical password [5]. Although smartphones are basically equipped with the functions of digital password locks for identity authentication, the following several aspects make such locks useless. First of all, many people may choose a weak password in order to avoid forgetting it. A survey [6] of smartphones 4-digit password shows that “0000,” “1234,” and “2580” are the most popular passwords, which accounts for 15% of the total number of people in investigations. Second, the passwords are easy to leak. For example, it is easy to be peeped in a crowded bus without security measures when unlocking a smartphone. Moreover, oily residues left on the screen can also clearly show the password. Therefore, it is of high importance to improve the effectiveness and preciseness of user's authentication of smartphones.
An enhanced authentication mechanism appeared on the market, namely, artificial continuous authentication. It keeps authenticating the current user continuously in the background, thus greatly increasing the complexity of potential intrusions [7]. This novel authentication mechanism includes fingerprint or face recognition frequently and answering a series of predefined security issues or passwords. However, this method is a kind of trouble or burden for users. Furthermore, this method requires a high cost.
Since most cell phones are equipped with a variety of built-in sensors for human-computer interaction, the user's keystroke behaviors can trigger these sensors to gather the data of behavioral characteristics without extra hardware devices. Those behavioral characteristics can accurately describe a user's keystroke behavior, such as rhythm, strength, and angle. They are not easily imitated and copied and therefore have a higher security. While a user performs his normal keystroke behaviors, the authentication system monitors him continuously without his notice, that is, in an implicit way [7]. Therefore, it is not only user-friendly, safe, but also economical to use behavioral characteristics of user's keystroke behaviors for identity authentication.
According to the above ideas, the user's authentication system based on keystroke behaviors will face four challenges. First of all, what features need to be extracted from the user's keystroke behaviors that they can represent the user's identity, that is, ensuring distinctiveness of the characteristics; secondly, how to handle the collected data to not merely maintain distortionless, but also reduce experimental complexity; the third challenge is how to avoid the deviation of the feature data as environment changes, that is, ensuring permanence of the characteristics; finally, how to optimize classifier to improve identity authentication system performance.
Zheng et al. [8] have been using the combination of four kinds of features, such as acceleration, pressure, size, and time, to verify whether the smartphone user is a valid user. Their experimental results show that their authentication system achieves high accuracy with averaged equal error rate of 3.65% [8]. This authentication experiment, however, is done without any outside interference. The impact of environmental change in real life will enable the user to change the way of tapping. In general, user's tapping gesture is one of the most common influential factors because different gestures correspond to different habits. Therefore, taking into account the gesture changes will cause some differences of authentication results, and we propose an identity authentication system based on keystroke behaviors which consider the changes of gesture.
In this paper, built-in smartphone sensors are utilized to collect behavioral characteristics when a user unlock the screen and match with the corresponding preestablished gesture models in order to determine whether the user is a valid user or not. This authentication method is more suitable for real life, as it can reduce the authentication system's error rate by matching with the corresponding gesture models. This method and digital password are, respectively, regarded as implicit and explicit authentications for the identity authentication of smartphones. In other words, our approach can act as a second authentication method and make up for the inadequacy of digital password in a cost-effective and user-transparent manner.
At the end of this paper, we conduct a real-world experiment and invite 100 volunteers. Experimental results show that authentication system's error rate of considering gesture changes is lower than the case of without considering. In addition, the system's performance has improved significantly after data normalized preprocessing and algorithm's parameters optimization.
The main contributions of this paper lie in the following aspects: It is the first attempt to take environmental factors, especially the changes of tapping gestures, into consideration when matched with the authentication models to prevent the system's false rejection or false acceptance. Identity authentication we proposed is not only user-friendly, but also economical. While a user unlocks smartphone, his keystroke behaviors can trigger smartphone built-in sensors to gather the data of behavioral characteristics without extra hardware devices, and the authentication system authenticate him uninterruptedly, that is, in an implicit way. We break down a single keystroke event into three consecutive phases, and each phase of the keystroke operation contains five behavioral features. In addition, we propose a system approach that segments each behavioral feature into subfeatures, which could maintain the characteristics’ distinctiveness and permanence. We present the design and implementation of TouchRecorder, an application based on the Android system to collect and handle sensor events. We collect roughly 20000 samples data sequences in total from 100 participants and evaluated the performance of our identity authentication system. Our experiments show that the accuracy of the system we proposed is up to 99.1329%. Comparing with the identity authentication system without considering the impact of gesture changes, the EER of the system considering the impact of gesture changes is decreased by 1.2514%.
The rest of the paper is organized as follows. Section 2 reviews the related works in the field of smartphone identity authentication. Section 3 overviews the method of keystroke-based identity authentication and goes through details about the model of identity authentication system and performance measures. Section 4 presents our experimental design, data collection, and experimental results. We also evaluate the performance of our system based on the framework. In Section 5, we study other factors that affect system performance, finding that the password's repetitiveness, validity of the characteristics, and the size of the training set will have impacts on system's performance. Section 6 concludes our research and suggests potential future work.
2. Related Works
In recent years, identity authentication based on biometrics has been an active research area and successfully applied in practice. In general, biological characteristics include physiological and behavioral characteristics. While physiological characteristics refer to the static characteristics of human body, such as fingerprints, facial features, hand geometry, iris, or DNA [9, 10]; behavioral characteristics are generated during human activities such as trajectory and exercise intensity [11, 12].
References [13–16] are some researches about smartphone identity authentication by means of physiological characteristics. In [13], the authors use multiple biometrics such as voice, face, and signature data for authentication on smartphones. The goal is to enable legally binding contracts to be signed [13]. The physiology-based identity authentication is more susceptible to environmental influences, which diminishes the system's accuracy and reliability to a large extent. For example, face recognition will be plagued by different visual angle and illumination intensity [14], and voice recognition is vulnerable to interference of surrounding noise [9]. A study shows that face recognition is of higher EER about 28%, and the EER of voice recognition and signature verification is, respectively, up to 15% and 18%. Physical characteristics are not only vulnerable to outside interference, but also easy to be imitated and copied. Besides, due to the high costs, they are not widely used in smartphones.
Smartphone identity authentication technology based on behavioral characteristics is considered to be an emerging technology with higher security and lower cost in terms of physical characteristics. Users are authenticated not only by the shape they input but also by the way they perform the input [17]. We can find this kind of researches in [8, 17–23]; they belong to the field of digital password authentication. Cai and Chen [18] develop an Android application that collects data of device orientation when user is tapping. But their evaluation shows that their application can only identify more than 70% of keystrokes on a virtual keyboard. Zheng et al. [8] get the combination of four features (i.e., acceleration, size, time, and pressure) from built-in smartphone sensors, and they suggest a nonintrusive identity authentication mechanism to determine whether a user is the owner of smartphone or an attacker who happens to know the password. Xu et al. [24] install a self-made application in smartphone to monitor the user's movement and gesture changes stealthily, using its built-in sensors to obtain acceleration, direction, and other features. However, the environment of user using a smartphone in life is complex and various, and gesture of a user's keystroke behaviors is one of the most common factors that environment affects. These works cannot be clearly sensitive to user's environment or how this environment affects user's behaviors. We will focus on the shortcomings to improve the existing works. Therefore, we take environmental factors, especially the changes of tapping gesture, into consideration when matching with the authentication models to prevent the system's false rejection or false acceptance.
Many studies have employed the KDA (Keystroke Dynamic-Based Authentication) system, which is based on keystroke time features to enhance the security of graphical-based authentication [25]. For example, Chang et al. [25] believe that graphical-based password increases the password space and improves the KDA applications on smartphones. Similarly, de Luca et al. [17] consider graphical-based authentication method as an easier and more convenient system for people to remember. So they made an implicit graphical-based authentication system to ensure the smartphones privacy. Whenever a user taps on the screen, the system not only checks if the graphical password is correct but also how it is entered, to determine if the person should be authorized. But it has drawbacks. On the one hand, its authentication process is complex, and it needs much longer time for authentication than digital-based authentication. On the other hand, they also do not take into account the impact of environment to the work, and graphical-based authentication is similar to the principle of digital-based authentication, and gesture changes will cause some differences of authentication results. So we propose an identity authentication system based on keystroke behaviors which consider the changes of gesture.
Now many researches study smartphone authentication system, which authenticates users continuously based on the way they tap. Frank et al. [26] design a systematic experiment to test how behavioral touch features exhibit consistency over time. In [7], Xu et al. adopt an authentication mechanism based on users’ touch-screen operation, which requires the certification system to conduct monitoring continuously and implicitly. And each time a touch-screen behavior would trigger the identity system. They think that stroke is not the only type of touch-screen operation; it should also include other behaviors, such as slide, pinch, and handwriting. So, they study how to set up a continuous certification model based on multi-touch-screen operation. And they use experimental method to justify distinctiveness and permanence of the touch biometrics as a first attempt. In the end, their experimental results verify that touch biometrics serve as a promising method for continuous and passive authentication [7]. But their experiments show that the users’ behavioral biometrics cannot remain stable over a period of time, while the continuous authentication requires stable signal and long life battery strictly. In our work, we give up continuous authentication mode because of their instability and more power consumption; our identity system will be triggered only in the process of unlocking. And we break down a single keystroke event into three consecutive phases, and each phase of the keystroke operation contains five behavioral features. So, we propose a system approach that segments each behavioral feature into subfeatures, which could not only be done in a very short period of time to reduce the battery power consumption, but also ensure the stability and continuity of the obtained characteristics.
It must use classifiers for identity authentication through behavioral characteristics, and each has its own merits. For example, Frank et al. [26] use a k-nearest neighbor classifier and a Gaussian RBF kernel support vector machine. These classifiers achieve excellent authentication performance, with equal error rates between 0% and 4%. In [17], de Luca et al. use five kinds of tapping features and dynamic time warping (DTW) to distinguish between the valid users and impostors. Zheng et al. [8] think one-class learning is straightforward and more practical because it does not involve other users’ data. However this method has slightly lower verification accuracy. In order to improve system performance and reduce experimental complexity, in our work, we adopt the data normalized preprocessing first, which includes outlier removal process, uniformization process, and dimensionality reduction process, and then train our classifier by parameters optimized SVM. These steps can obviously improve the system performance.
Feature derivation is essential for keystroke dynamics, and it will lead to different authentication performance with different feature combinations. Zheng et al. [8] compute four sets of features for each PIN typing action: acceleration, pressure, size, and time. They record raw data of these features between each key-press and key-release phase. And they find that the combination of all four feature sets always outperforms individual feature set. Nevertheless, these four individual feature sets perform similarly and not very well. So in our work, we will add device orientation feature to feature set, and we find its contribution to the certification work is not only the highest among other features, but also much better than them.
3. Identity Authentication Method Based on Keystroke Behaviors
In order to design an effective identity authentication system based on keystroke behaviors, two key steps are needed to explore:
3.1. Model of Identity Authentication System
In this paper, we assume the following application scenarios. An impostor accesses a user's mobile phone without the owner's permission and has acquired the password before. For example, it exposes your password to an impostor looking over your shoulder in a crowded bus. Then the impostor can successfully enter the user interface by inputting the correct password to steal the user's privacy and confidential documents (such as chat logs, confidential papers, and bank account passwords). In order to protect the privacy and confidential documents of smartphones from disclosure, we propose an identity authentication system based on keystroke behaviors; that is, assuming that the first defense line had been broken down, then we can judge whether a current user is the owner of smartphone by collecting characteristic data when he unlocks the screen. The user is not allowed to enter the user interface until the judging results are right, even if the password is correct.
An identity authentication system based on keystroke behaviors includes two important phases: training phase and authentication phase. In the training phase, we input some labeled samples of two classes to train a classifier. Classifier training process includes subfeature derivation for the initial collected data, normalization preprocessing for the subfeature data, the selection of the classifier parameters by optimization algorithm, and the establishment of the corresponding classification model in accordance with the different gestures. Among them are the normalization preprocessing including outlier removal process, uniformization process, and dimensionality reduction process. In the authentication phase, we can use the trained classifier to determine whether a current unlabeled sample is from a valid user or an impostor. Figure 1 is a brief workflow chart of the identity authentication system. Next, we will elaborate on the subfeature derivation, analysis of gesture changes, and classifier parameters selection.

Workflow chart of identity authentication system.
3.1.1. Subfeature Derivation
Most latest smartphones support a diverse and complex set of touch-screen operation, such as keystroke, slide, pinch, and drag. In this paper, our model is based on keystroke behaviors because of its simplicity as well as universality. It will trigger built-in sensors of smartphones to read and store the data of behavioral characteristics when a user is tapping on the smartphone screen.
We break down a single keystroke event into three consecutive phases: key_down, key_hold, and key_up. The smartphone will move downward by an external force at the moment of touching down on the screen (i.e., be in the key_down phase); at the end of key_down phase, smartphone will stop moving (i.e., be in the key_hold phase); next, when the user lifts his finger from the screen, the smartphone will move back to its original position due to the diminution of external force and reaction of user's hands (i.e., be in the key_up phase). The whole keystroke event is completed in a very short time, roughly ranging from 50 ms to 500 ms with different users.
Each keystroke operation contains five behavioral features in each phase: keystroke acceleration, pressure, size, time, and device orientation. Since these behavioral features can be obtained from a built-in smartphone sensors, such as accelerometers, pressure sensors, and gyroscopes, it requires no additional hardware devices. These five behavioral features are different and sustainable for each person [27]. There is some certain inherent correlation among them. For example, changes of keystroke pressure will change the device's orientation. There are some affecting and affected relationships among acceleration, pressure, and size. Therefore, the characteristics of user's behaviors are not solely reflected by the individual feature of these five factors, but the intrinsic correlation among them. All these features can be easily obtained from built-in smartphone sensors and accurately represent a user's consistent and unique keystroke behaviors. In addition, we can distinguish between valid users and impostors through these characteristic data.
In Figure 2, we illustrate the three-dimensional coordinate system of a smartphone that is placed horizontally. The shorter side of the screen is set to be the x-axis, and the right direction is positive; besides, y-axis is parallel to the longer side of the screen, and the direction points to the top of the phone; then, the direction of the z-axis is perpendicular to the screen, and pointing to the sky.

An introduction of coordinate system on smartphones.
(1) Keystroke Acceleration. We divide keystroke acceleration into three components according to the coordinates of smartphones (i.e., the magnitude of acceleration when keystroke motion is in the key_down phase; the magnitude of acceleration when keystroke motion is in the key_hold phase; the magnitude of acceleration when keystroke motion is in the key_up phase.
(2) Keystroke Pressure. The intensity of keystroke pressure ranges between 0 and 1 and “0” for no pressure at all, while “1” for the maximum pressure that screen is able to withstand. We will record three pressure features for each keystroke event: the magnitude of pressure when keystroke motion is in the key_down phase; the magnitude of pressure when keystroke motion is in the key_hold phase; the magnitude of pressure when keystroke motion is in the key_up phase.
(3) Keystroke Size. Keystroke size is relative to many reality factors, such as user's finger size, keystroke pressure, and user's gestures when hand-held a smartphone, so the possibility is rather low that different users have the same keystroke size for the same button. Similarly, the magnitude of size is scaled to a value between 0 and 1. We will record three size features for each keystroke event: the magnitude of size when keystroke motion is in the key_down phase; the magnitude of size when keystroke motion is in the key_hold phase; the magnitude of size when keystroke motion is in the key_up phase.
(4) Keystroke Time. Duration time of one keystroke event and interval time of two nearby keystroke events are different among different users, while the same user's each keystroke event makes little difference. So for an 8-digit password action contains 15 related features. We will record two kinds of time features for each keystroke event by taking advantage of this specialty: the duration time of keystroke motion is in the key_down phase; the interval time from the end of this keystroke motion to the next keystroke motion.
(5) Device Orientation. Device orientation can be measured by the changes of three-dimensional data: azimuth (α), pitch (β), and roll (γ). It is measured by degrees. α is the azimuth rotating around the z-axis, with the range of [0°, 360°); β is pitch rotating around x-axis, with the range of [−180°, 180°); and γ is roll rotating around the y-axis, with the range of [−180°, 180°).
Different keystroke areas and pressures will result in a different device orientation, and we will record nine device orientation features for each keystroke event:
For every user's each keystroke event, built-in smartphone sensors will collect 20-dimensional behavioral features. For an 8-digit password, the characteristics data of one keystroke event can be up to 160 dimensions.
3.1.2. Classifier and Parameters Selection
Our aim is to accurately identify whether the user is a valid user or not, so we use two-class classification to solve the problem. The first class, labeled “+1,” is composed of characteristic data generated from 20 valid users; the second class, labeled “−1,” is composed of characteristic data generated from the other 80 impostors. We train model by Support Vector Machine (SVM), a method of machine learning, to find the hyperplane that optimally splits the two classes. However, these two samples are nonlinear separable, so it will fall into the “curse of dimensionality” if using a general linear transformation, which may make computation complex and unworkable. Therefore, the Support Vector Machine uses the kernel function of the input space to replace inner product operation with high-dimensional feature. It maps data in the lower dimension input space into the high-dimensional attribute space by nonlinear function. Then the classification problem will be transformed to feature space.
If the appropriate kernel function is selected, the linear inseparable problem in the input space can be transferred into linear separable problem in the attribute space. We adopt the Radial Basis Function (RBF) kernel function, and Support Vector Machine (SVM) can realize the function of a Radial Basis Function (RBF) neural network. For RBF kernel function, it needs to confirm two parameters, penalty parameter c and kernel function parameter g. For the combination of different parameter will affect the accuracy of the experiment, we use multiple parameters grid search method for SVM parameters selection. The multiple parameters grid search method divides the feasible range of parameter values into a series of small areas. That is,
3.1.3. Analysis of Changes in Gesture
The environment of using a smartphone in life is complex and various. However, our current smartphone cannot be clearly sensitive to user's environment or how this environment affects user's behaviors, which brings some challenges to the work of the smartphone authentication system. A user's keystroke gesture is one of the most common factors that environment affects. On the one hand, it is obvious that the same user's keystroke gestures might not be immutable in different environment; on the other hand, the collected data of a user's different gestures certainly exist deviation. In general, how they are being held or manipulated will result in different gestures, such as one or two hands, left or right hand, and the number of fingers. So it should pay close attention to different keystroke gestures for smartphone identity authentication system.
We will show some kinds of gestures empirically as follows: in a user's left hand and operated with left thumb; in a user's right hand and operated with right thumb; in a user's either hand and operated with either thumb; in a user's left hand and operated with right index finger; in a user's right hand and operated with left index finger.
We divide the screen into three columns, like left, middle, and right. We compare with each column's keystroke size of the same height to determine the keystroke gestures. In general, the size on the closer column will be smaller than the size on the farther column as thumbs touch screen. For example, for the case of “in a user's left hand and operated with left thumb,” the keystroke size will be increased from left column to right column and vice versa. Experimental results show that the difference of keystroke areas between adjacent columns is at least 25% [5, 28]. Therefore, if the difference of keystroke areas from left to right is more than 25%, then it is considered to be the first two gestures. And it is considered to be the first gesture if the size of the left column is the smallest one. Moreover, if the size of middle column is larger than the other columns and the difference is over 25%, we will bias the gesture as the third one. For operating with the index finger, however, keystroke area of the screen has little effect on the size. So, if the difference of keystroke size among three columns is smaller than 25%, it is considered to be the last two gestures.
Figure 3(a) shows the screen interface of smartphones. We divided the screen into twelve parts (4 × 3), and there are ten effective parts. Figures 3(b), 3(c), 3(d), and 3(e) show the keystroke size of the first four gestures, respectively. As shown, the value of keystroke size is between 0 and 1, value 1 represents fully touch. We use the gradient from black to white to represent the changes of keystroke size from 1 to 0. Figures 3(b)/3(c) correspond to the first/second gesture, and we can see from the screen color diagram that the color of the screen on the right/left side is deeper than the left/right side, changing gradually between adjacent columns. This means farther keystroke position has larger size; similarly, Figure 3(d) shows the third gesture, and its color on the middle column is deeper than the other sides, because the middle column is farther than the other sides for both thumbs; the keystroke size of middle column is larger than the other columns; Figure 3(e) shows the fourth gesture, and the distribution of color is not associated with keystroke position; it means that the position of screen has little effect on the keystroke size for either index finger. It can be easier to judge a user's keystroke gestures by the size, improving the accuracy of identity authentication system.
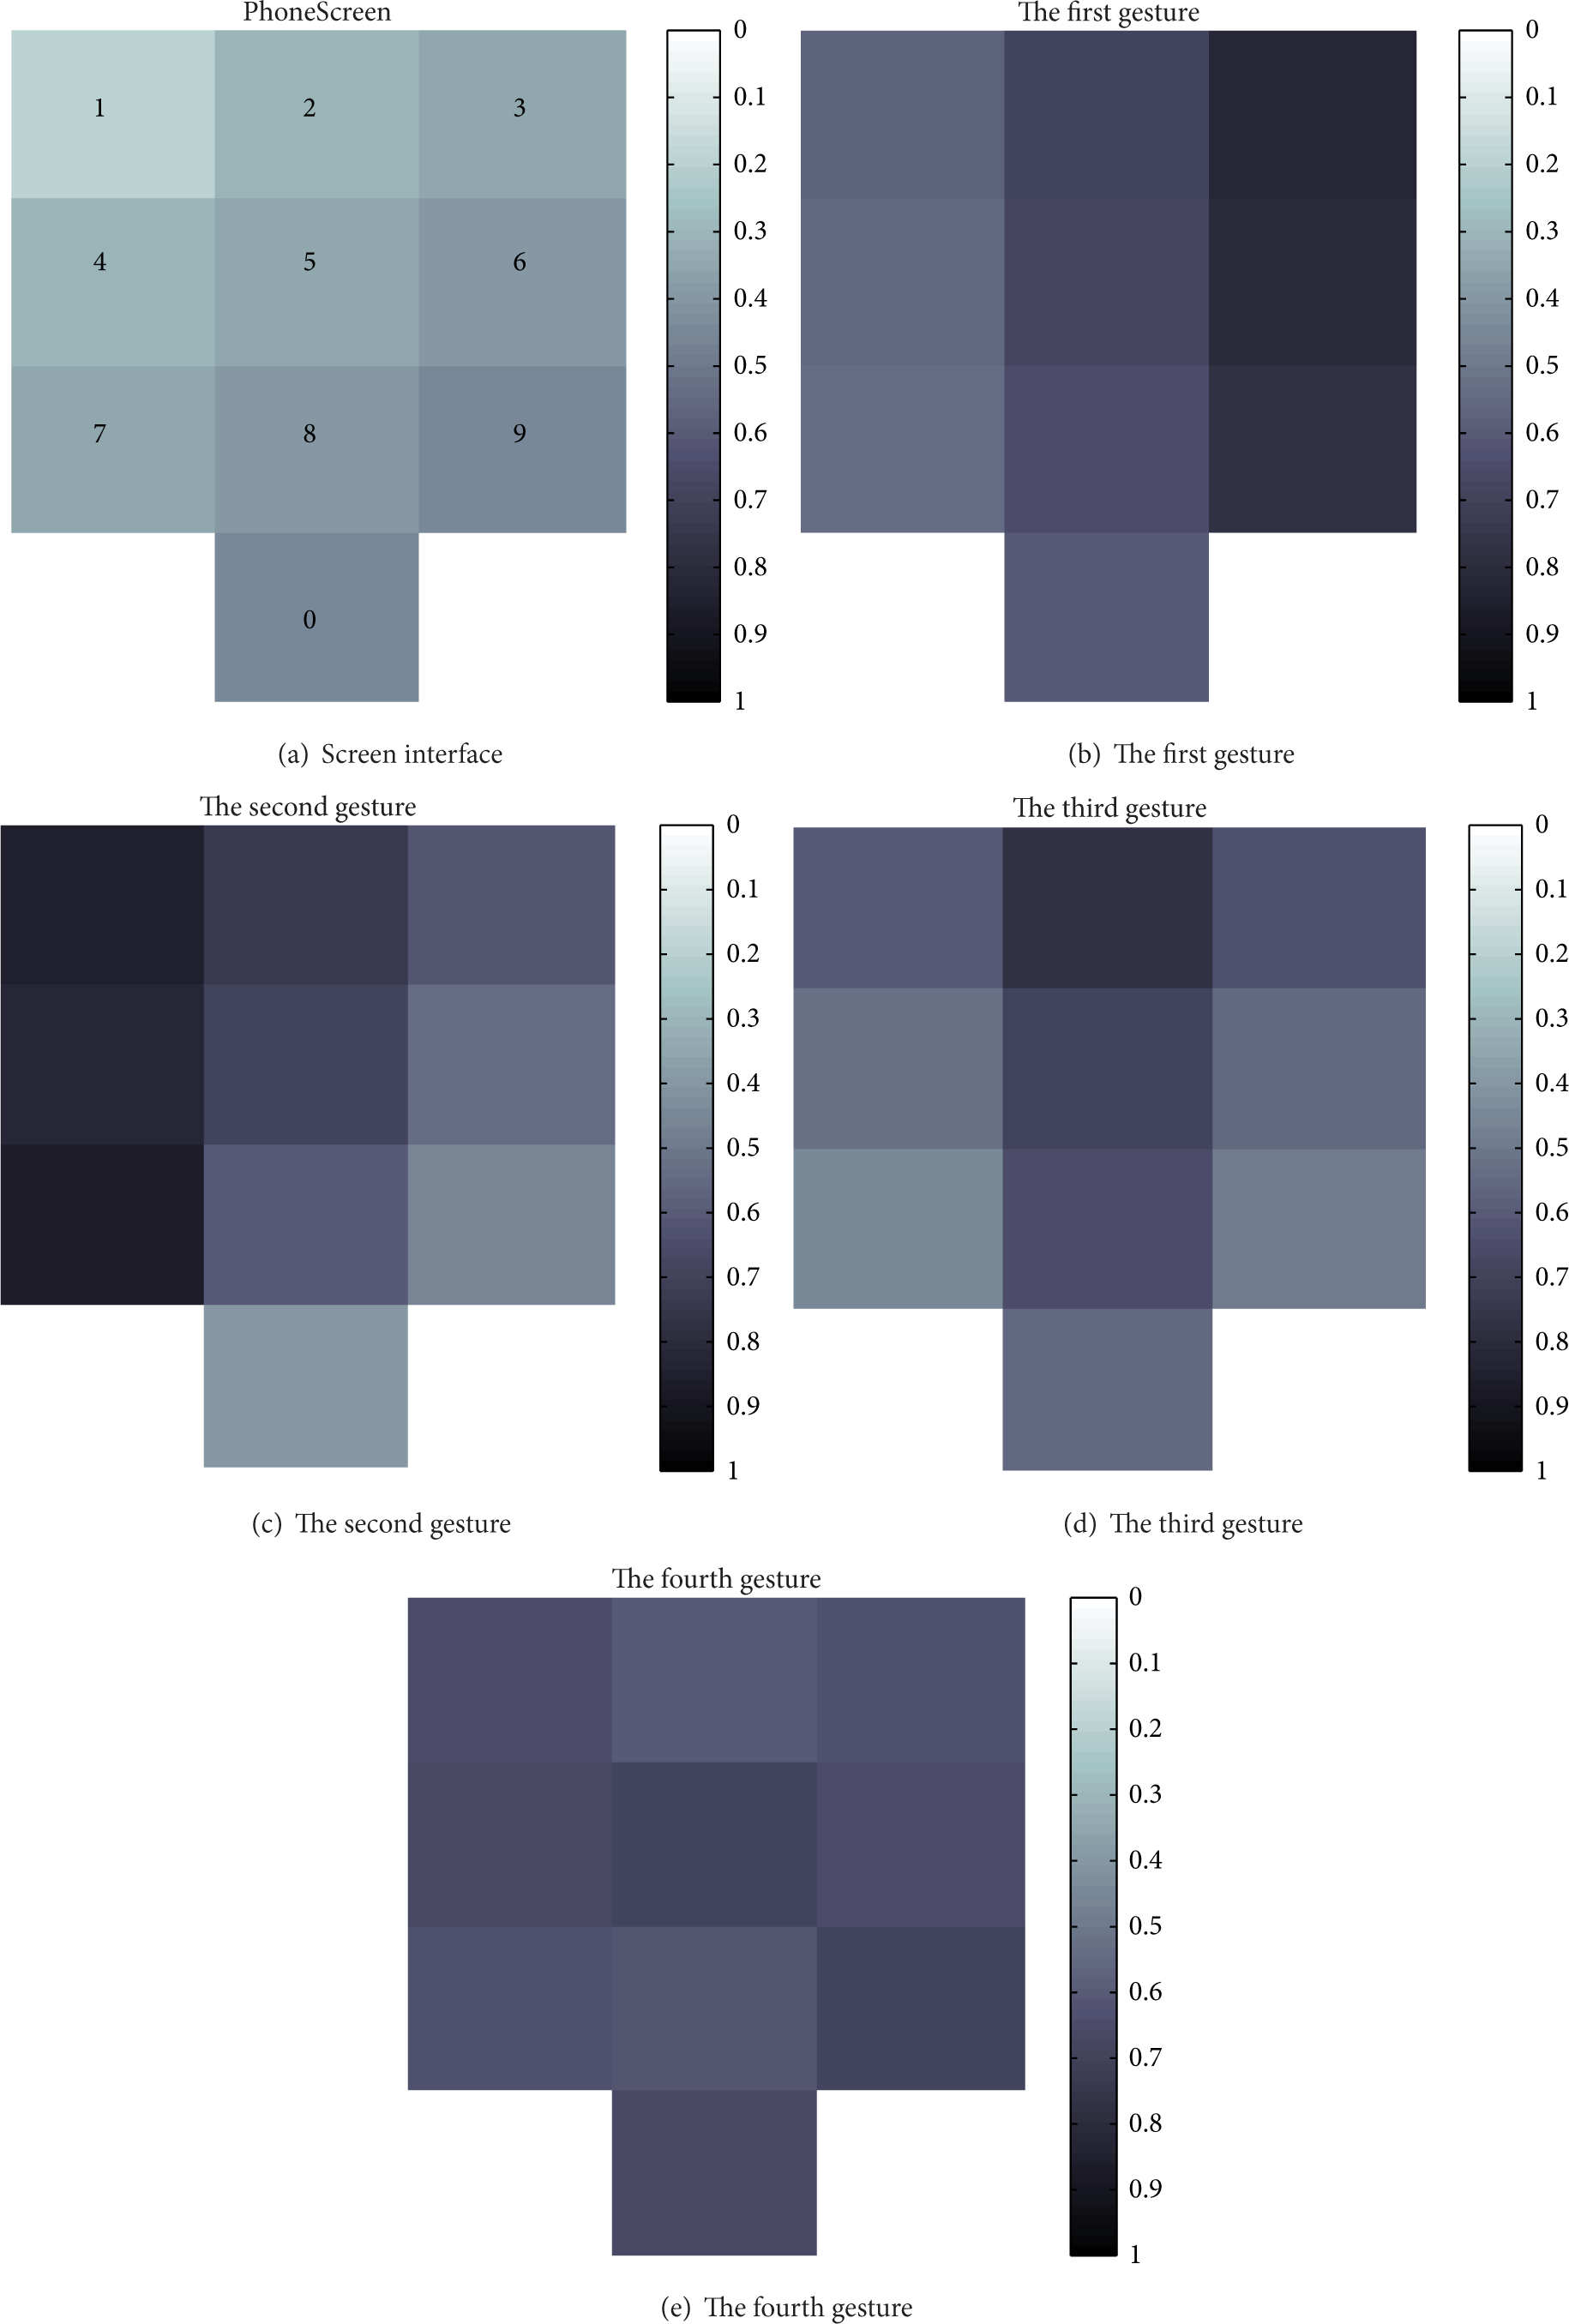
Keystroke size of four kinds of gestures.
3.2. Performance Measures
We evaluate the performance of the system through four indicators, namely, Equal Error Rate (EER), Receiver Operating Characteristic (ROC) curve, Area Under the Curve (AUC), and accuracy. It is necessary to introduce the concepts of these evaluation indicators, which are defined as follows.
(1) EER. Error rate is one of the most immediate evaluation indicators to measure the performance of the system. Our identity authentication system based on multisensor may occur two types of mistakes, one is to reject the samples of valid users, and the other is to accept the samples of impostors. Aiming at these two problems, we use False Rejection Rate (FRR) and False Acceptance Rate (FAR) to evaluate the performance of our system. FRR means that the probability of a valid user is wrongly identified as an impostor, while FAR refers to the probability that an impostor is wrongly identified as a valid user. Both the error rates are calculated as follows:

FRR and FAR are sensitive to system settings, and they are related to each other. In general, FRR curve and FAR curve will intersect, that is to say, FAR will decrease as FRR increases and vice versa. Because of the contradictory relation of these two error rates, our identity authentication system needs to minimize the risk of the system and find balance between them according to the actual requirement. The point where FRR and FAR are equal is defined as the Equal Error Rate (EER), and it is not affected by system settings. So EER is widely used to be an evaluation indicator of identity authentication system.
(2) ROC Curve and AUC. ROC curve can be used to evaluate performance of the identity authentication system. ROC curve can definitely present the probability of an impostor that is correctly rejected (True Positive Rate, TPR) versus the probability of a valid user that is rejected by mistake (False Positive Rate, FPR). The closer the curve gets to the left corner, the higher the accuracy of the system and the lower the error rate will be. We can also compare it by calculating the AUC, area under the ROC curve. In general,
(3) Accuracy. Accuracy is a kind of criterion to measure the overall correct rate of system, including the True Acceptance Rate and True Rejection Rate. Generally,

4. Experimental Analysis
We introduce the identity authentication system based on keystroke behaviors in the previous section. In this section, we will use the design system to perform identity authentication experiment and introduce the design of the application, experimental data collection and experimental performance evaluation in detail.
4.1. TouchRecorder
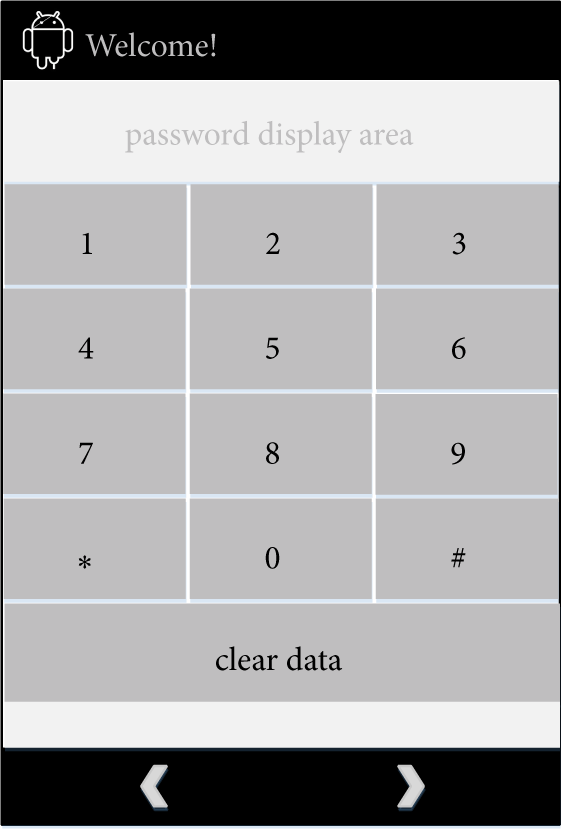
We simply need a virtual keyboard and some built-in sensors of the smartphone screen (such as pressure sensors, gyroscopes, and accelerometers), then we may collect and evaluate behavioral characteristic data without additional hardware supporting. In this paper, built-in sensors are able to read a user's behavioral characteristic data while the user is unlocking and authenticate whether it is a valid user by analyzing the date of the user's keystroke behaviors. To achieve this goal, we have developed an application based on the Android system called TouchRecorder to collect and handle sensor events. The TouchRecorder includes the following components: (1) a data acquisition module, to collect the behavioral characteristic data by built-in sensors in the background; (2) a data preprocessing module, to extract and normalized pre-process subfeatures; (3) a data storage module, to store the collected data in a specified memory address of smartphone. Once users install TouchRecorder and authorize the privilege of built-in sensors, it will monitor each user's motions. Figure 4 shows the layout of TouchRecorder.
Layout of TouchRecorder.
In our experiment, we run the TouchRecorder on a smartphone of Android 4.2 version, and its fastest sample rate on sensor readings is approximately 100 Hz. We use TouchRecorder to detect each characteristic data of three successive stages, including keystroke pressure, size, acceleration, time, and device orientation, and then several subfeatures can be extracted from them. Whenever the user inputs a set of 8-digital password, TouchRecorder will complete a record, which contains eight behavioral characteristic sets of keystroke behaviors.
4.2. Data Collection
100 participants distributed in all ages averagely are invited for our experimental data collection, and they have to be masters of smartphones with touchscreens, which ensures that they would naturally complete experimental unlocking operation. Table 1 lists participants’ age, gender, and gesture information. Before the experiment begins, participants must be familiar with the experimental process, which includes the password (1-6-8-4-3-7-5-2) and the usage of the application.
The data of 100 participants.

After mastering the experimental process, participants start the data collection phase. We select 20 volunteers among 100 participants as a smartphone's valid users who are asked to unlock with the same password 50 times as they usually do. They operate twice a day and each interval time of two consecutive operations is 30 minutes. After 25 days’ experiment, we gather 1000 sets of data from these 20 valid users (the same password). And we divide every valid user's data into two parts equally, the first part is used for training classifier, and the other part is used for testing phase. Similarly, we also collect samples data for the remaining 80 participants, who are regarded as impostors that they happen to know the password and try to interact with the smartphone. We also ask them to unlock with the same password repeatedly for about 50 times, so we collect 4000 sets of data from these 80 participants in this way (the same password). We also split these data into two fractions. It is different from the above procedure, the first fraction of the data comes from the first 40 impostors used for training classifier, and the second fraction comes from the remaining 40 impostors used for testing phase. Because in real life, we are unable to get the impostors’ samples in advance, so the training set and testing set of samples come from different impostors. Finally, the 100 participants unlock four groups of different digital passwords, respectively, so we can collect roughly 20000 samples data sequences in total.
4.3. Performance Evaluation
For identity authentication system, just designing a good classifier is not enough. Preliminary data processing is very essential and indispensable. In the following section, we present outlier removal process, uniformization process, and dimensionality reduction process in real time.
4.3.1. Data Preprocessing
(1) Outlier Removal Process. There are various “outliers” in reality data, and these outliers will cause the migration of entire data characteristics. We can define whether it is an outlier by boxplot's maximum and minimum observation point. As shown in Figure 5, boxplot is made up of five numerical point, which are the minimum (min), lower quartile (
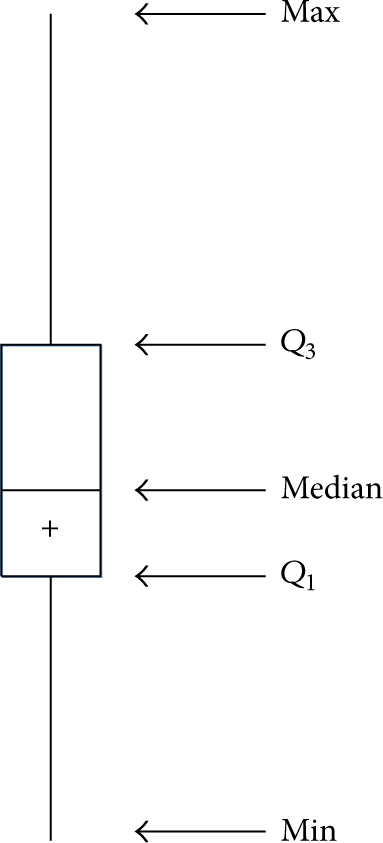
Structure diagram of boxplot.

The distribution of characteristic data.
(2) Uniformization Process. Uniformization process aims at unifying the data of different sources into the same reference system, so that it can not only make data processing more convenient, but also increase the convergence rate of program and avoid the representative characteristics of singular data covering up or being covered. Therefore, each dimensional data of the samples are uniformized. Figure 7 is the characteristic data comparison for x-axis acceleration, y-axis acceleration, and z-axis acceleration before and after the uniformization. Meanwhile, blue “∗” and black “∘” are on behalf of samples of owners and impostors, respectively. As can be seen that the data with uniformization processing is limited in

The characteristic data comparison for acceleration before and after the normalization.
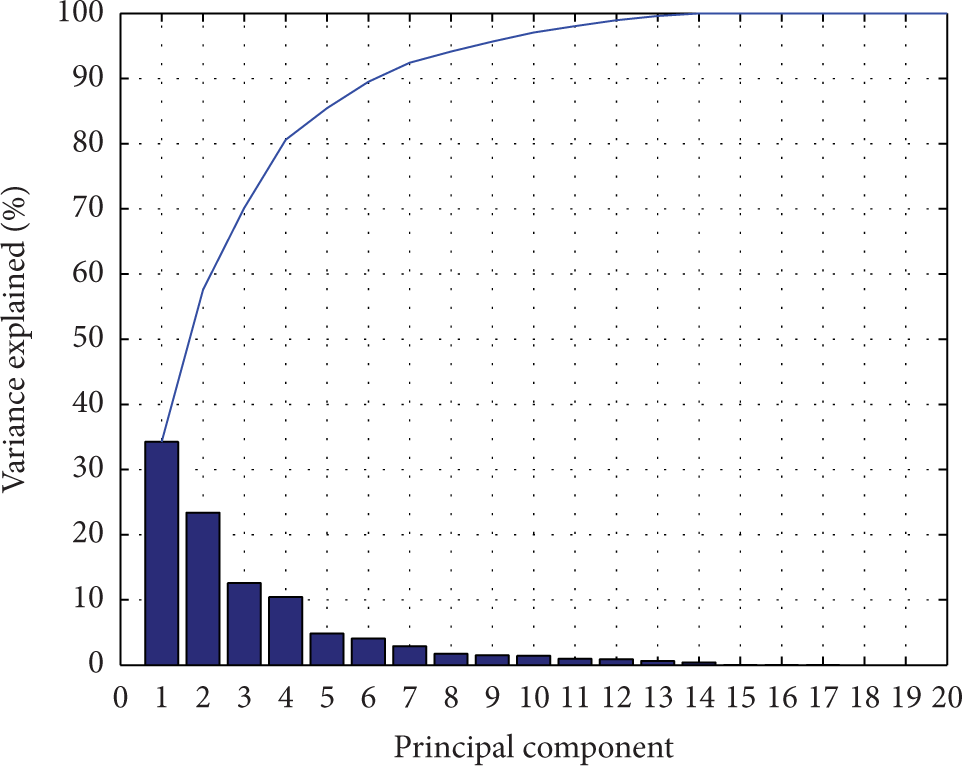
(3) Dimensionality Reduction Process. In order to avoid the free space of high dimension increasing the calculated amount of the program, we need to conduct the dimensionality reduction in accordance with the cumulative contribution rate of the data characteristics. The samples data is mapped into a low-dimensional space from the input space by a linear or nonlinear transformation, so as to obtain a new low-dimensional data. Figure 8 is the characteristics contribution rate and the cumulative contribution rate of each dimension feature. Characteristics contribution rate means the degree that the characteristic can express overall characteristic of the original data, while cumulative contribution rate means the degree that the characteristic and the previous characteristic set can express overall characteristic of the original data. In this graph, the heights of the bars, respectively, represent the characteristics contribution rate of 20-dimensional features, while the polyline represent the cumulative contribution rate, where these 20-dimensional features are ordered from large to small according to the proportion. However, the cumulative contribution rate of the first 14 has reached 100%; it indicates that the 14-dimensional features can fully express the characteristic of the original data. None of them can be dispensable. Then the 15th to the 20th ones are invalid, and it would not affect the classification effect to abandon this part. What can be seen from Figure 8 is the cumulative contribution rate of the first 9 that is more than 95%. If only 95% of the cumulative contribution rate is needed, we only need to extract the first 9 feature vectors as the input samples. Similarly, if only 90% of the cumulative contribution rate is needed, we only need to extract the first 7 features.
The characteristics contribution rate and the cumulative contribution rate of 20-dimensional features.
Dimensionality reduction can effectively reduce time complexity of the algorithm; however, dimensionality reduction will certainly have some influence on the accuracy of the classification results. For example, Figure 9 is the classification accuracy and program runtime corresponding to different cumulative contribution rates. We can figure out from the graph that with the increase of the cumulative contribution rate, the program runtime also shows an upward trend. The classification accuracy is the best when the cumulative contribution rate is from 90% to 92% and 100%. Thus, we need a tradeoff between dimensionality reduction and accuracy that the data will not be complex due to the multiple dimensions but can keep high classification accuracy. The figure shows that this system's best cumulative contribution rate is 91%, as the highest accuracy of the system and the lowest time complexity.

Accuracy and program runtime corresponding to the different cumulative contribution rates.
Figures 10(a) and 10(b) are both ROC curves, while (a) is for our identity authentication system and (b) is for a system without data preprocessing. What is more, the system's accuracy rate is up to 99.1329% after data preprocessing, and it is corresponding AUC is 0.9917, while the system's accuracy rate is only 87.8613% without data preprocessing. Therefore, the data preprocessing greatly improves the system performance.
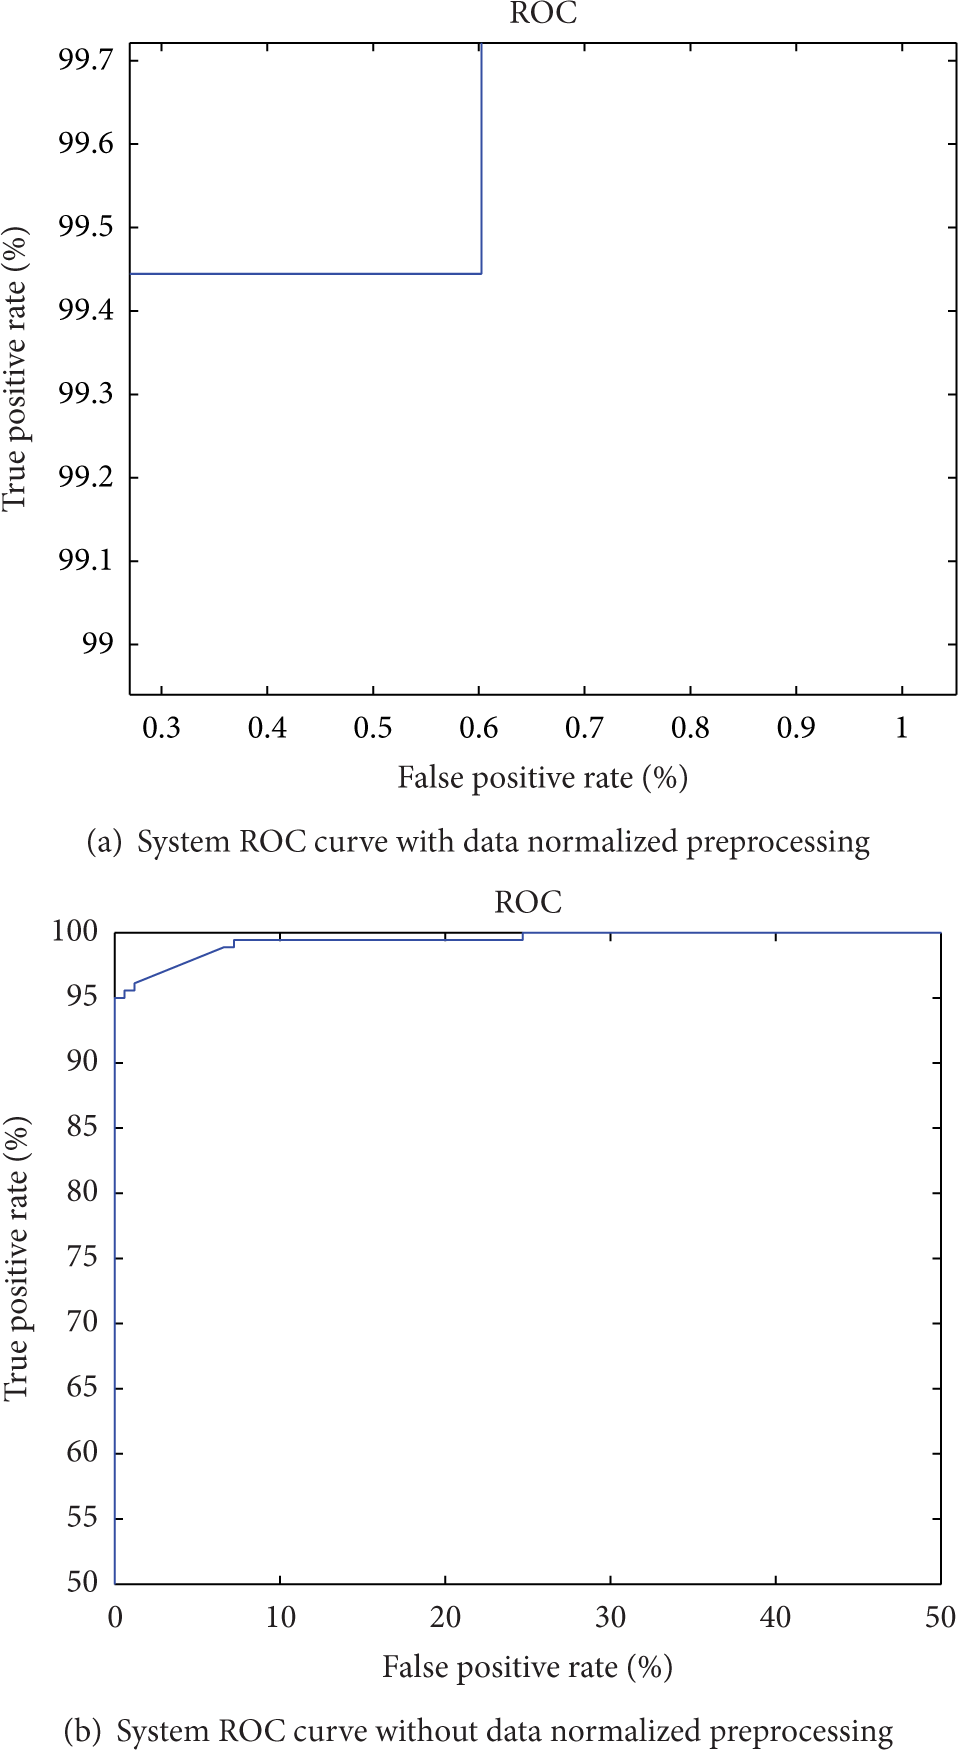
ROC curve of identity authentication system.
4.3.2. Consider the Impact of Changes in User's Gesture
Environment is complicated when a user is using a smartphone. A user's keystroke gesture is one of the most common factors that environment affects, because the same user using multitype keystroke gestures in different environment will directly affects the judgment of the authentication system. Figures 11(a) and 11(b) show the system's EER which considers and without consider the changes of a user's gesture, respectively, and the intersections of curves and diagonals are EER, namely, FRR = FAR. You can see from the figure, the system's EER of taking the gesture changes into account is 0.5556%, while the system's EER is 1.807% without considering it. This indicates that it can reduce the system's False Acceptance Rate and False Rejection Rate in the case of considering the changes of gesture and then reduce the EER to improve the whole system's performance.

EER curve of identity authentication system.
4.3.3. SVM Parameters Optimization
Since the penalty factor and kernel function parameter have a great influence to SVM, so we use multiparameter grid search method to find the optimal parameter values. The principle of multiparameter grid search method is dividing the feasible interval of parameter values into a series of small intervals and selecting the best pair as model parameters by traversing all the points in the grid. It is possible to find global optimal solution by means of this method within the optimum range. Figure 12 shows classification accuracy of different combinations of c and g. Experimental result shows that numerous combinations of c and g correspond to the highest classification accuracy, but in order to avoid excessive learning status, we use cross validation to find the highest accuracy pair of c and g; that is, the optimum value of c and g are 0.25 and 2.8284, respectively.

A 3D view of different combinations of c and g corresponding to the systematic classification accuracy.
5. Other Factors That Affect System Performance
We use a variety of experiments to assess the impact of other factors on the smartphone authentication system. We are going to discuss the experimental results via real-world experiments.
5.1. Password Repetitiveness
Click twice the same number consecutively that is defined as repetition, and the more the times of clicking consecutively on the same number, the higher the degree of repetition. We set up four different repetitiveness of 8-digital passwords: 1-1-1-1-1-1-1-1, 1-1-1-1-6-8-4-3, 1-1-6-8-8-4-3-7, and 1-6-8-4-3-7-5-2. The repetitiveness of these four passwords is getting lower according to the definition. All these four passwords present similarly, while the results of 1-1-1-1-1-1-1-1 is less accurate than 1-6-8-4-3-7-5-2. As you can see from Figure 13 that the overall accuracy values drop as the repetitiveness increases. It can obtain 99.1329% for collecting all features of the least repetitiveness password (i.e., 1-6-8-4-3-7-5-2), while gets 65.1274% for collecting all features of the highest repetitiveness password (i.e., 1-1-1-1-1-1-1-1). It seems that a password with higher repetitiveness will reduce the characteristic differences of users’ behaviors, which makes the characteristics of features more partial and leads to a higher FAR and FRR of identity authentication system. It can be concluded that a lower repetitiveness password can reduce system EER.

Four kinds of passwords’ classification accuracy with different features.
5.2. Effectiveness of Features
As mentioned earlier, this identity authentication system has extracted five kinds of features, that is, keystroke acceleration, pressure, size, time, and device orientation. Not all the characteristic have the same effect on the accuracy of the determination results. Therefore, in order to measure the contribution degree of the accuracy by each feature, we only extract sole behavioral feature to train the classifier in training phase when the user is unlocking, and identify users by each feature. Figure 13 shows the system's accuracy for the five individual feature sets and combination features with different passwords.
It can be seen from Figure 13 that the combination features always outperform individual feature sets, since it always with the highest accuracy for all different passwords. This is because the five behavioral features represent the five aspects of user's keystroke behaviors; a richer combination of features could more precisely target users. In addition, according to the lower repetitiveness passwords, device orientation feature corresponds to a relatively high accuracy, while the keystroke size obtains the lowest accuracy. Meanwhile, keystroke acceleration, pressure, and time perform similarly well and outperform size.
Figure 14 and Table 2 show system ROC curve and AUC, respectively. What can be visually seen is that the combination features and device orientation feature both achieve higher system performance, whose ROC curves are closer to the upper left of the coordinate axes, and their AUC values are close to 1; the ROC curve of keystroke size is closer to the diagonal, and its AUC is only 0.5869, indicating a lower classification capability; keystroke acceleration, pressure, and time perform similarly and their AUC are all closer to 0.7.
System AUC.


System ROC curve.
5.3. Size of the Training Set
Increasing the size of owners’ training set is an excellent way to decrease the classifier's EER, because it can describe the owners’ keystroke behaviors more precisely and fully. Figure 15 presents system's EER with different passwords in the case of increasing owners’ sample number. As can be seen from the figure, the system's EER decreases as owners’ sample number is increasing in training. Meanwhile, the EER remains on a similar level after 50 training samples. It shows that, as more training samples are included, there is a moderation in the pace of decline of EER. Therefore, it can decrease the training model's EER by increasing the owners’ sample number appropriately.

System's EER in the case of increasing owners’ sample number for different passwords.
6. Conclusion
This paper has suggested an identity authentication system based on keystroke behaviors which has taken the changes of users’ gesture into account. This system collects five features (i.e., keystroke acceleration, pressure, size, time, and device orientation) in an implicit way while a user is unlocking the smartphone. In addition, it takes a series of measures to improve the system's accuracy, such as subfeature derivation, data normalized preprocessing, and parameter optimization for SVM. And it is the first attempt to consider the changes of users’ gesture in identity authentication. We presented our work with an experimental study, and our experiments show that the system's EER of considering the changes of gesture is 1.2514% lower than the case of not considering. What is more, we use a variety of comparison tasks to assess the impact of other factors on the smartphone authentication system.
Although the system has a good performance in its accuracy, there is still a long way to go. Firstly, this kind of system only applies to unlock the touch screen, and it will lose a very important safeguard if a smartphone is in unlocked status. Therefore, it is significant to study the real-time identity authentication for smartphones, that is, whatever status the smartphone is, the identity authentication system will run in the background silently and identify the user continuously, and it will not consume too much battery power; secondly, not only the changes of gesture will cause some differences of authentication results, but also a user's state of motion will make the data different. For example, the keystroke operation is changeable or even has a big difference when the user is standstill and walking or sitting and lying. So, adding more environmental considerations or capturing some new behavioral features which are not affected by them requires further inquiry; finally, there are some other implementations of our identity authentication system, including how to obtain data samples conveniently for training phase and how to protect the system from being easily destroyed by invasion.
Footnotes
Conflict of Interests
The authors declare that there is no conflict of interests regarding the publication of this paper.
Acknowledgments
The authors would like to thank the editor and the anonymous referees for their valuable comments. This research was supported by National Natural Science Foundation of China (Grants no. 61202450 and no. U1405255), National Natural Science Foundation of China (61472083, 61402110), Fujian Normal University Innovative Research Team (IRTL1207), and Fuzhou Science and Technology Bureau (No. 2013-G-84).