
Abstract
The hull stress monitoring system is to measure and display the ship motions and real-time stresses by strain gauge and accelerometer sensor networks. The statistical parameters such as standard deviation of measurements through hull stress sensor network are important for analysis of hull structure status. Due to the large amount of measurement data, it is difficult to acquire the standard deviation directly. Nested array is a sparse sampling algorithm which can keep the statistical property of the original data. This paper presents an algorithm for standard deviation computed of hull stress data based on nested array. From the experimental results, it can be seen that the provided algorithm can achieve higher accurate distribution of standard deviation with much less samples. This proves that the nested array sampling could be used in statistical computing for hull stress data.
1. Introduction
The hull stress monitoring system is intended to accomplish the following goals: firstly, it is a system that measures and displays the ship motions and real-time stresses directly by strain gauge or indirectly by monitoring pressures sensor networks. And the mariners can determine the onset and severity of hull structural response to the sea to initiate ship handling changes to mitigate dangerous stress levels and other hazards. Secondly, the hull stress monitoring system can be extended by measuring, recording, and analyzing hull stresses in conjunction with other ship motions, navigation, and performance data. The extended benefits include fatigue assessment, decision rules, and guidance to assist the mariner in mitigating current dangers and quantifying design constraints for future ships [1–3].
In the extended goal of hull stress monitoring system, the following statistical parameters should be calculated for each of the selected sensor data: standard deviation, skewness, and kurtosis.
The statistical parameters are acquired based on thirty minutes or more continuously through hull stress monitoring networks. The data is big and the calculation of standard deviation, skewness, and kurtosis is tremendous. Furthermore, it is not conducive to acquire the statistical parameters in real time.
Stress sensors on the ship will collect a large amount of data; if processing the data one by one, it will produce great workload. This paper adopts a new method called nested sparse sampling, which can collect less data to obtain second-order statistical estimator.
Nested sparse sampling is a nonuniform sampling, which overcomes Nyquist sampling requirement, using two different samplers in each period. That is why we call it “sparse” sampling compared with traditional Nyquist sampling. Although the signal is sampled sparsely and nonuniformly; the samples in the time domain are arbitrarily sparse, which could keep the statistical property of the original signal; this sampling algorithms could be used to estimate second-order statistics to highly reduce the transmission cost of big data [4, 5].
This paper will use the nested array algorithm to achieve the second-order moment statistics estimation algorithm through the sparse sampling to analyze the statistical parameters acquired from hull stress monitoring system, and the structure of this paper is as follows: first, we introduce the principle of nested sparse sampling including theoretical analysis and formula derivation. In Section 2, we give a brief description of hull stress monitoring sensor networks. At last, we show the results of nested sparse sampling, analyze the data, and make a conclusion.
2. Statistical Parameters Acquired Algorithm Based on Nested Array
The concept of nesting is shown to be easily extensible to multiple stages and the structure of the optimally nested array is found analytically. Hence, it can resolve significantly more sources than the actual number of physical sensors. We will demonstrate that using only second-order statistics of the sensor data. The nested array is an effective approach to array processing with enhanced degrees of freedom [6, 7]. The time domain autocorrelation could also be obtained from sparse sampling with nested sampling structure [8]. And the autocorrelation of the samples can be computed, although the samples from this nested sparse sampling are sparse and nonuniform. The nested sampling structure is obtained by systematically nesting two or more uniform linear arrays; here we use the simplest form, two levels of sampling density, with level-1 samples at the

Nested sampling structure with
The sampling points are given by
The sampling points are in the following range:


The autocorrelation samples for all k could be estimated [5] by averaging the products


Consequently, the nested sparse array sampling can calculate second-order statistics moment and obtain the standard deviation for further research.
3. Hull Stress Monitoring Sensor Networks and Experiments Design
3.1. Hull Stress Monitoring Sensor Networks
Prolonging the ship lifetime and reducing maintenance costs with the hull stress monitoring sensor network, the monitoring system can provide real-time monitoring of the forces exerted on the ship's hull. It provides immediate feedback to the crew if hull stress or fatigue levels exceed SAFT thresholds and reduces maintenance costs by avoiding or reducing the risk of structural damage to the vessel. The standard components of a hull stress monitoring sensor network include four strain sensors to capture the global loading level and one bow accelerometer to capture slamming events. Figure 2 showed the schematic of hull stress monitoring sensor network. Statistical calculation of sensor response, such as standard deviation, skewness, and kurtosis, can assist the mariner to assess the current dangers and quantify design constraints for future ships.
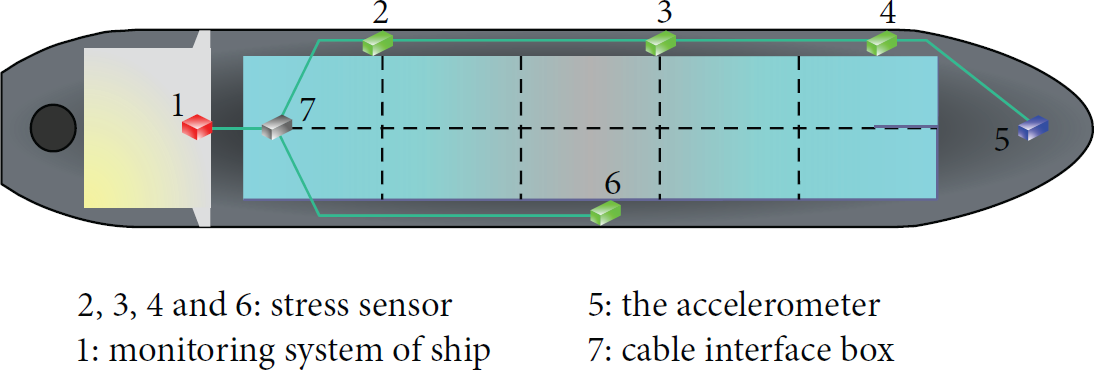
The schematic of hull stress monitoring sensor network.
3.2. Experimental Design
In this paper, according to the simulation of a stress sensor wave load response, we analyze the statistical standard deviation parameters based on sparse nested array sampling algorithm presented in this paper.
The distribution of the ship stress wave load usually should be subjected to the two parameters of Weibull distribution. The probability density function and distribution function of Weibull distribution are as follows:


Monte Carlo method is usually used to construct random numbers obeying a certain distribution. Following the principle of the method, let the random variable y be continuous distribution and the distribution function


This paper generated 960000 sampling-points signal of hull stress wave load by Monte Carlo method, which obey the Weibull distribution with the shape parameter

Waveform of 960000 sampling points.
3.3. Results and Analysis
This paper simulates the real-time sampling process with a single sampling data length of 2400. So it can obtain 400 standard deviations by calculating directly due to the total length of 96000. At the same time, it calculates the standard deviation with (5) based on the nested array algorithm, which selects

The histogram of standard deviations based on all algorithms.
According to Figure 4, we can see that the distribution of standard deviations based on all algorithms concentrated between 6 and 8. The interval of the histogram is just the uniform distribution of numbers. The vertical axis represents the number of numerical distribution in a certain interval.
In Table 1, it describes the two largest numbers of numerical distribution and its proportion.
The number distribution of variance.

According to Table 1, the proportion of the main standard deviation values is 99.75% which were computed directly with standard deviation formula. And the proportion is 78.75%, 74%, 72.75%, and 70% which were computed based on nested array samples with different
4. Conclusions
Nested array sparse sampling is a nonuniform sampling which overcomes Nyquist sampling requirement and could keep the statistical property of the original signal. The hull structure status could be learned through the statistical analysis of hull stress sensor network measurement data. This paper addressed a new algorithm to acquire the standard deviation through sensor network data based on nested array.
It demonstrated that it can achieve better statistical results with much less samples with the nested array sparse sampling. Furthermore, it can be studied that the third statistical moment of the sensor network data will be acquired based on the nested array.
Footnotes
Conflict of Interests
The authors declare that there is no conflict of interests regarding the publication of this paper.
Acknowledgments
This work was supported by National Natural Science Foundation of China (61271411). And it also was supported by The National Natural Science Foundation, international (regional) cooperation and exchanges Project (61411130159).