
Abstract
Recent years have witnessed a growing interest in using Wi-Fi received signal strength for indoor fingerprint-based positioning. However, previous study about this problem has primarily faced two main challenges. One is that positioning fingerprint feature using received signal strength is unstable due to heterogeneous devices and dynamic environment status, which will greatly degrade the positioning accuracy. Another is that some improved positioning fingerprint features will suffer the curse of dimensionality in online positioning. In this paper, we designed a novel positioning fingerprint feature using the segment similarity of Wi-Fi access points, considering both the received signal strength value and the Wi-Fi access point. Based on this designed fingerprint feature, we proposed a two-stage positioning algorithm for indoor fingerprint-based positioning. Experiment results indicate that our proposed positioning methodology can not only achieve better positioning performance but also consume less positioning time compared to three baseline methods.
1. Introduction
Indoor location-based services are attracting more and more attention with the increasing popularity of mobile devices [1, 2] and the rapid development of mobile marketing [3]. Location is essential context information for many indoor location-based services, such as mobile social network [4] and Lifemap [1]. Since the global positioning system signal cannot penetrate indoor buildings and the positioning accuracy of cellular-based method is too low [5], the main outdoor positioning methods are not suitable for indoor positioning. Recently, indoor positioning scheme based on WLAN technology has attracted extensive attention, because of the widespread deployment of WLAN infrastructures and most mobile devices (i.e., smart phone, tablet and PDA, etc.) being equipped with Wi-Fi interface.
Previous positioning methods using Wi-Fi technology are based on geometric properties of triangles [6, 7], which evaluated the location of unknown point with three known reference points. In general, the Wi-Fi network access points (APs) usually work as reference point and three methods can be used to evaluate the distance between unknown point and reference point, namely, received signal strength indicator (RSSI) [8, 9], angle of arrival [10], and time of arrival [11]. However, positioning methods using angle or time of arrival need special hardware to accurately measure the arrival time or angle, which is impractical for common devices. Since Wi-Fi RSSI is affected by many factors (e.g., interior layout, people walking, and weather conditions), the positioning accuracy is very low for triangulation-based positioning using RSSI [12].
Fortunately, fingerprint-based positioning scheme [13] using Wi-Fi RSSI has proved to have better performance and attracted extensive attention in recent years. Typically, this kind of positioning method includes two steps, namely, offline constructing positioning fingerprint map and online positioning. For constructing positioning fingerprint map, the indoor space will be firstly divided into several small cells; then some expert surveyors will collect the Wi-Fi RSSI of each cell as its positioning fingerprint. In online positioning, comparing the positioning fingerprint of unknown location with fingerprint map using specific matching algorithm, finally, the location with the best match will be chosen as the positioning result.
However, previous indoor fingerprint-based positioning scheme faces two major challenges. One is that constructing the fingerprint map is time-consuming and needs to be updated dynamically for maintaining positioning accuracy. Previous literature has proposed some effective solutions to address this challenge. For instance, Bayesian regression [14], compress sensing [15], spatial-temporal correlation model [16], and triangulation-based [17] positioning have been used to dynamically calibrated fingerprinting map. Another challenge is that the Wi-Fi RSSI is very unstable [18, 19], which will dramatically decrease the positioning accuracy. According to Zheng et al. [20], current solutions for this problem can be mainly divided into two categories; one is manual calibration approach based on device mapping and the other is calibration-free approach based on new positioning fingerprint. The manual calibration approach uses an additional learning phase to find the linear transformation between the survey device and the test device, which is impractical for increasing new devices. On the contrary, the calibration-free approach constructs a new positioning fingerprint to solve the RSSI variance, such as DIFF [21] and HLF [22].
As for a classification task [23], the keys to successful fingerprint-based positioning are (i) the design of suitable classifiers and (ii) appropriately designed positioning fingerprint feature. Since Wi-Fi RSSI is unstable and variable, positioning fingerprint based on raw Wi-Fi RSSI has become the bottleneck for further improving the positioning accuracy. For solving this problem, we firstly observed and analyzed some inherent characteristics of Wi-Fi RSSI. Based on the analysis, we designed a new positioning fingerprint feature using the segment similarity of Wi-Fi APs, which is more stable and robust than the raw RSSI. We also proposed a two-stage positioning algorithm based on the designed fingerprint feature. To evaluate the performance of our proposed method, we defined a case study in the Zhejiang University City College (ZUCC) and have done several experiments at several floors. Experimental results indicate that our proposed method can not only achieve better positioning performance but also be less time-consuming compared to three baseline methods.
The rest of this paper is organized as follows. Section 2 firstly introduces related work about Wi-Fi-based indoor positioning. Section 3 describes our designed positioning fingerprint feature in detail. Section 4 introduces the proposed two-stage positioning algorithm using our designed positioning feature. Section 5 reports and discusses our experimental results. Finally, we present our conclusions and future works in Section 6.
2. Related Work
In this section, we survey some studies that address indoor positioning using Wi-Fi RSSI. Since triangulation-based method using Wi-Fi RSSI typically has large positioning error (usually larger than 10 m [24]), which is unacceptable for many indoor location-based applications, therefore we focus on discussing fingerprint-based method and analyze how these studies differ from our work.
Fingerprinting-based method is proposed to improve the positioning accuracy by using statistical theory. In offline training phase, the received Wi-Fi RSSI from surround environment is selected as the classification feature. Then, online positioning usually uses a classification model for positioning, such as KNN [8], neural network [25], and Adaboost [26]. In addition, several methods have been proposed instead of traditional classification model for reducing computational burden [27, 28] or improving positioning accuracy [9].
However, the positioning accuracy of fingerprinting-based positioning method will degrade significantly [20, 29] due to Wi-Fi RSSI variation caused by many factors [19], such as indoor building layout, the mobility of people, and even the weather conditions. Existing techniques for solving this variation problem can be divided into three categories.
2.1. Construct Robust Positioning Fingerprint Feature
The basic idea of this technique is to design new robust positioning fingerprint feature instead of the raw Wi-Fi RSSI to reduce the impact of variation. Currently, the proposed feature can be divided into two categories.
2.1.1. Positioning Fingerprint Feature Using Wi-Fi RSSI
This kind of feature only used Wi-Fi RSSI information to extract positioning fingerprint feature. For instance, Dong et al. [30] utilized the RSSI differences between pairs of Wi-Fi APs instead of raw RSSI as fingerprinting feature. Kaemarungsi and Krishnamurthy [31] utilized the ratio of RSSI as fingerprint feature to overcome the variation challenge. Unfortunately, this kind of feature will suffer the curse of dimensionality [20] in online positioning. Moreover, this kind of feature may lose the discriminative information related to homogeneous devices, since it constructs new fingerprint instead of the raw RSSI.
2.1.2. Positioning Fingerprint Feature Using Multidimensional Information
This kind of feature constructs novel fingerprint feature based on Wi-Fi RSSI and other information, such as magnetic field [32, 33], Bluetooth [34, 35], UWB signaling [36], and inertial sensors [37]. Specifically, these features usually use particle filter [26, 36, 38] or Kalman filter [39] to fuse Wi-Fi RSSI and other information. However, this approach is unreliable due to being heavily affected by motion estimation errors and has strong restrictions on smart phone, such as fixed phone orientation.
2.2. Design Novel Online Positioning Method
This kind of technique aims to use an additional learning phase to reduce the RSSI variation among heterogeneous devices. Zou et al. [40] used online sequential extreme learning machine to address the RSSI variation caused by environmental dynamics. Chen et al. [41] proposed a fuzzy logic-based system to solve this problem. Suárez et al. [42] proposed a linear regression model to predict Wi-Fi RSSI with considering different situations (e.g., heterogeneous devices, drivers, and operating systems). Obviously, this approach is impractical for rapidly increasing new kinds of devices.
3. Fingerprint Learning for Indoor Positioning
Due to lack of standardization and normalization in hardware and software, Wi-Fi RSSI scanned at the same location may be significantly different for diverse devices.
3.1. Observation and Analysis of Wi-Fi RSS Characteristics
We can observe clearly the variation between three different devices (GT-I19308, MI 2S, and P6-T00) in Figure 1(a). Additionally, the environment status changes, such as when some Wi-Fi APs may become invalid or people walk around, can also lead the scanned RSSI to be inconsistent at offline phase and online phase, which is shown in Figure 1(b), and it can be seen clearly that the five records collected at different time in a fixed location are variable. Therefore, fingerprint-based method using raw RSSI will suffer a significant positioning error due to the variation.
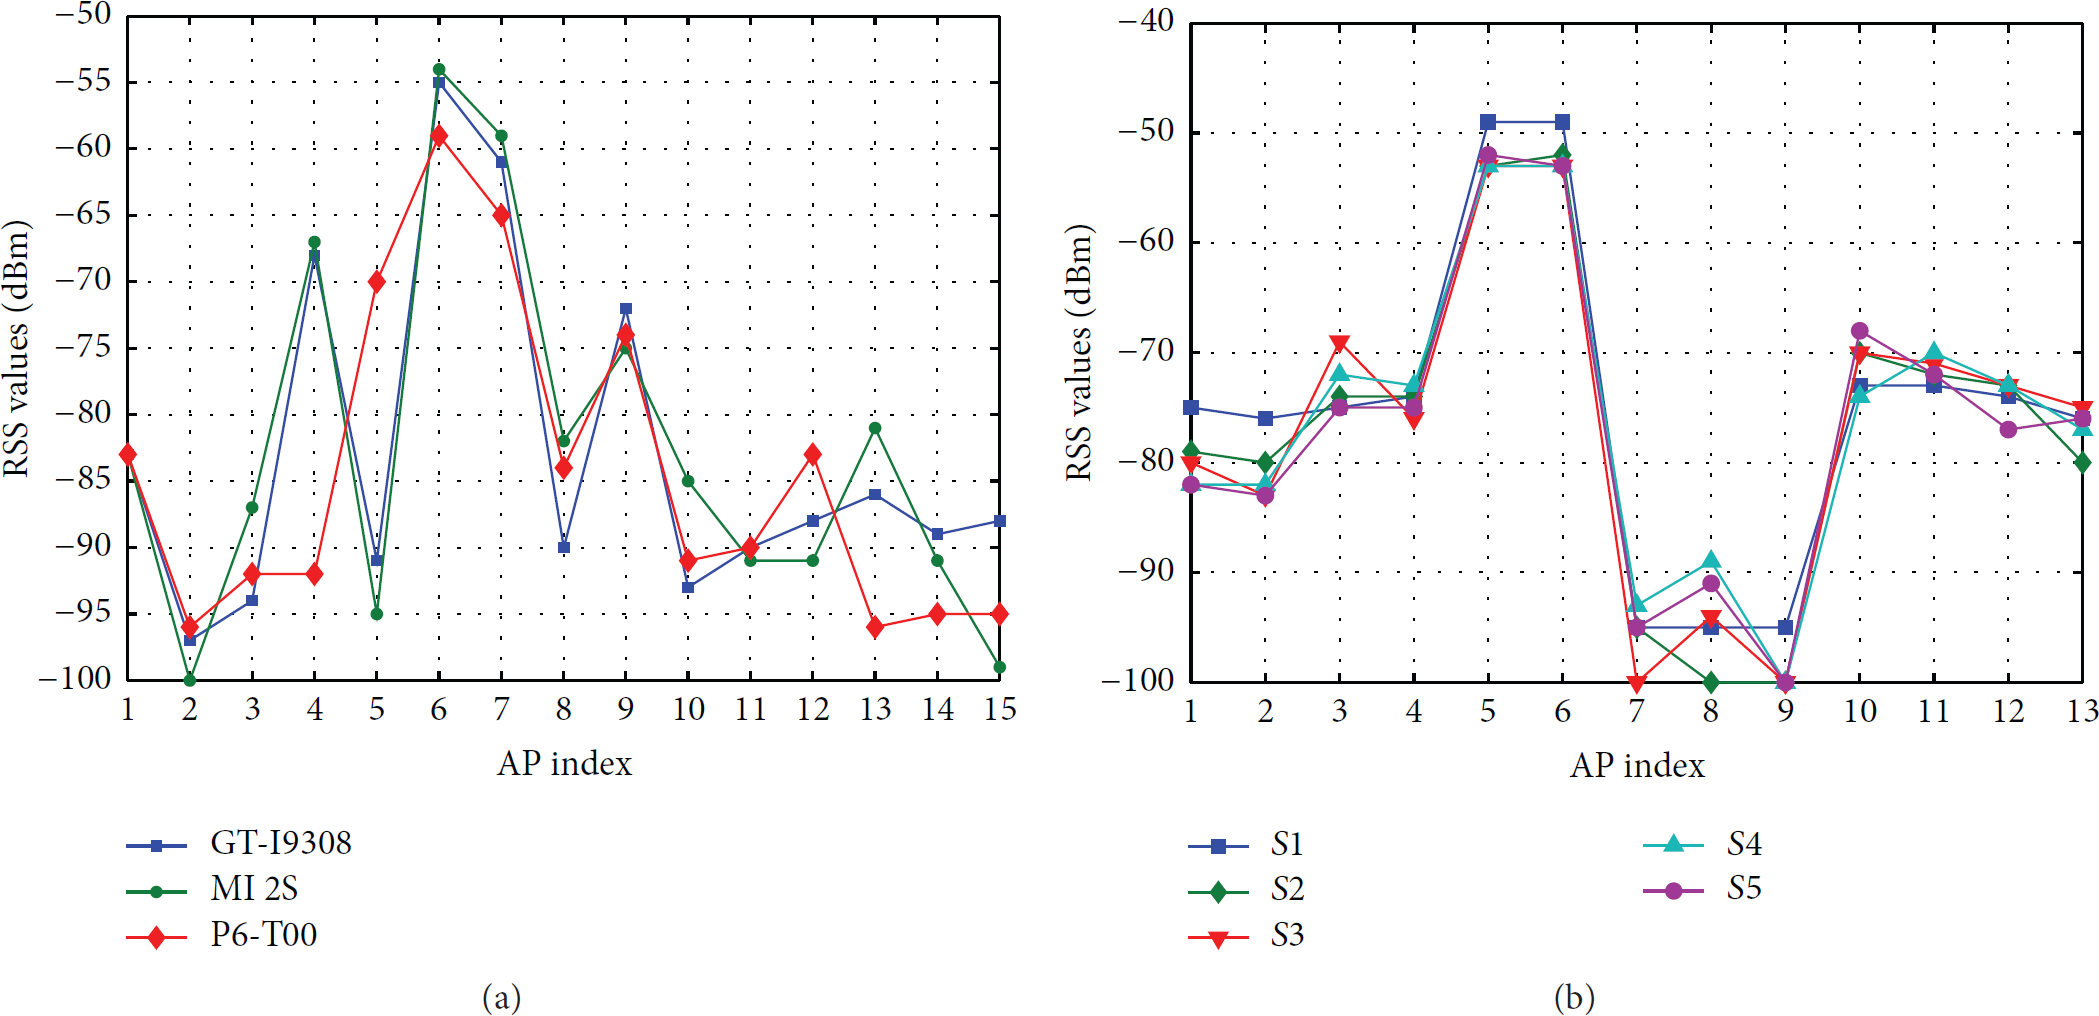
The RSS variance caused by diverse devices (a) and environment changes (b).
We observed that the Wi-Fi access points in different ranges in a fixed location are very consistent and stable, which we called the segmentation similarity of Wi-Fi access points (SSAP). For instance, the SSAP of Figures 1(a) and 1(b) are described in Tables 1 and 2, respectively. Table 1 shows that the three records scanned by different devices can be divided into three segments by the RSSI range; the Wi-Fi APs for each segment are the same; for example, the Wi-Fi APs in [−65, −54] are
The SSAP of Figure 1(a).

The SSAP of Figure 1(b).

To verify whether the SSAP is universal to different devices, we have evaluated our dataset using the similarity of RSSI histogram bins. Firstly, we grouped each sample using K-means for drawing the histogram bins. Secondly, we calculated the similarity distance of two histogram bins according to Bhattacharyya distance [43]. The calculation process includes two steps.
Step 1.
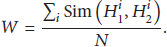
Calculate the bin similarity, as shown in (1). The bin similarity considers the Wi-Fi APs similarity using Jaccard distance:

Step 2.
Calculate the histogram similarity distance, as shown in

The evaluation dataset includes 1179 Wi-Fi RSSI samples for 393 locations in total, and each location includes 3 samples scanned by 3 different devices (GT-I9308, Huawei, and MI 2S). Then, we calculated the histogram bins similarity distance of RSSI according to (2). Figure 2 shows cumulative distribution function (CDF) of histogram bins distance with different devices. For the three devices, we can see that the histogram bins similarity distance less than 0.2 holds for more than 94.7% in total samples, which indicates that the SSAP is universal to heterogeneous devices.

The cumulative distribution function (CDF) for RSSI histogram bins distance.
3.2. Fingerprint Feature Design for Indoor Positioning
In view of the above analysis, this paper designed a new fingerprint feature based on the segmentation similarity of Wi-Fi access points according to the scanned Wi-Fi RSSI. Our designed feature does not require prearranged special Wi-Fi APs and instead only utilizes the scanned Wi-Fi information of surround environment. The fingerprint feature design is formally described as follows.
Definition 1 (location).
The physical space of an indoor building is divided into a set of small grids, which are represented as
Definition 2 (raw RSSI).
The scanned raw RSSI of location
Algorithm 1 describes the framework for designing the fingerprint feature SSAP; the basic idea is to group the Wi-Fi APs with similar RSSI together. Firstly, as showed in Lines (2)~(4) of Algorithm 1, we sorted descending raw RSSI
scanned Wi-Fi RSSI values at location (1) Initialize (2) (3) Obtain all the scanned AP mun m at location (4) Sort Descending (5) (6) Set (7) (8) Compute the absolute difference (9) Repeat Step (7) until (10) Set (11) Add S to (12) Set (13) (14) (15) Add (16)
From the above example, we can see that the designed fingerprint feature cluster Wi-Fi APs to similar RSSI. Therefore, it is more stable than the raw RSSI for small variance. Additionally, the dimension of our designed fingerprint feature is limited (usually less than 10). On the other hand, the designed fingerprint feature can utilize all the scanned Wi-Fi as information rather than just selecting a subset of Wi-Fi APs for positioning, which means that our method does not need prearranged Wi-Fi infrastructure for indoor positioning.
4. Positioning Algorithm Using SSAP Feature
Based on the designed fingerprint feature in Section 3.2, we proposed a two-stage positioning algorithm as described in Algorithm 2. The first stage of this positioning algorithm is to select a candidate set based on the similarity of SSAP fingerprint feature; thus the relatively close locations have more probability to be selected into the same candidate set. The second stage evaluates positioning result by the RSSI similarity for all elements in the candidate set. We will define clearly the similarity of the SSAP fingerprint feature and the raw RSSI positioning fingerprint as follows.
the SSAP Fingerprint (1) Initialize fragmentation threshold β, (2) (3) Set p ← the segments of (4) Set q ← the segments of (5) Set (6) Set (7) (8) Set (9) Set (10) (11) Compute Jacob Distance (12) (13) (14) (15) (16) (17) (18) (19) (20) (21) Initialize (22) (23) (24) (25) (26) (27) (28) (29)
Definition 3 (the similarity of SSAP fingerprint feature).
The similarity of two SSAP features 

Definition 4 (the similarity of raw RSSI fingerprints).
The similarity calculation of two raw RSSI features 
At stage one, the closest one or more matches in positioning fingerprint map are selected as candidate set according to the similarity of SSAP fingerprint feature, as shown in Lines (1)~(19) of Algorithm 2. Then, if there is more than one element in the candidate set, the final positioning result is obtained according to the similarity of raw RSSI, as depicted in (20)~(29) of Algorithm 2.
5. Experiment Evaluation
5.1. Experiment Setup
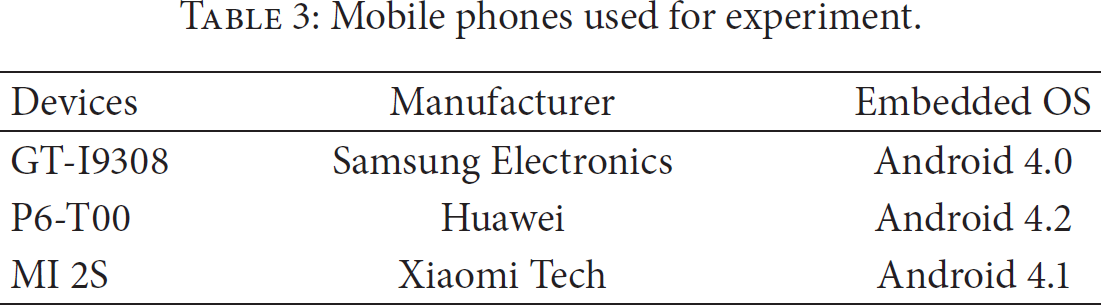
For evaluating the performance of the proposed methodology, we conducted several experiments in three floors (2nd floor, 4th floor, and 5th floor) of the science building at Zhengzhou University City College (ZUCCHINI). Each floor is divided into 131 grids and the mean distance between two grids is 1.5 meters, most of the grids are in the corridor and some are in classroom or laboratory, and the detailed layouts of these grids are shown in Figure 9. In our experiment, three different mobile phones are used to collect Wi-Fi RSSI and the device details are shown in Table 3. We further programmed a mobile APP to scan the surrounding Wi-Fi RSSI based on Android PI once every 0.2 seconds. Each collected record includes three fields of information: the mobile phone's MAC address, the MAC addresses and RSSI of all scanned Wi-Fi APs, and the collection time.
Mobile phones used for experiment.
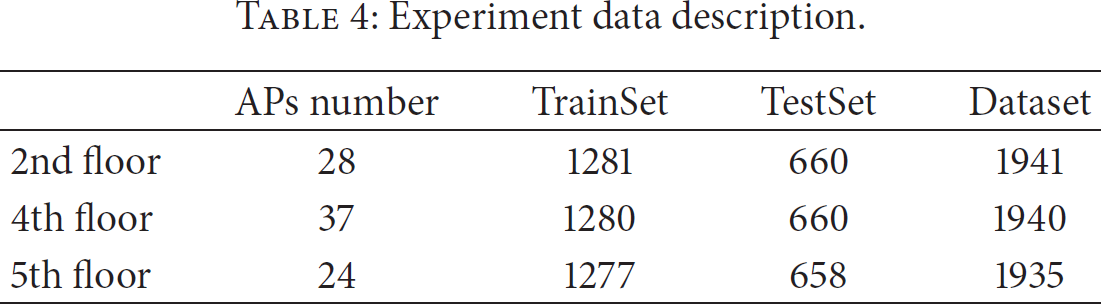
In the offline phase, we collected the experiment data for constructing positioning fingerprint map on each floor and the dataset is shown in Table 4. It can be seen that the number of scanned Wi-Fi APs is different for each floor and usually not all the Wi-Fi APs can be detected in each scan. For undetected AP, its RSS value is set to 100 (dBm). We used 66% collected records (TrainSet) for constructing the fingerprint map in offline phase and 34% collected records (TestSet) for evaluating performance in online positioning phase.
Experiment data description.
5.2. Experiment Results and Discussion
In these experiments, we compared our proposed positioning methodology with three baseline methods: (1) RAW-NN, which uses the raw RSSI as positioning fingerprint feature; (2) DIFF-NN [21], which uses the difference of RSSI between each pair of Wi-Fi APs as positioning fingerprint feature; and (3) HLF-NN [31], which uses the ratio of RSSI between each pair of Wi-Fi APs as positioning fingerprint feature. The evaluation metric includes positioning error and positioning time. The positioning error is defined as the Euclidean distance between the estimated location and the actual location, and the positioning time refers to the positioning time of online positioning phase.
5.2.1. Evaluation of Positioning Error
Figure 3 shows the cumulative distribution function (CDF) of positioning error for the second floor (2nd floor) by the three positioning methods, respectively. In this figure, we can see that the proposed two-stage positioning algorithm using SSAP fingerprint feature outperforms the other two methods. More exactly, our method achieved the best positioning performance and the second is DIFF-NN, while the worst performance is achieved by RAW-NN. For instance, the probability of error distance under 3 meters is 87% by our method, 76% by DIFF-NN, and 64% by RAW-NN. Figures 4 and 5 show the CDF of the fourth floor (4th floor) and fifth floor (5th floor), respectively. It can be seen that our method performs the best among the three algorithms in total. In Figure 4, the positioning performance for error distance more than 4.5 meters is quite close for SSAP-NN and DIFF-NN. In Figure 6, the curves of all methods are very close for the positioning error distance less than 3 meters.

The cumulative error distribution of 2nd floor.

The cumulative error distribution of 4th floor.

The cumulative error distribution of 5th floor.

The cumulative error distribution of all floors.
We combined the three datasets to evaluate the whole positioning performance and the different number of Wi-Fi APs for the combined dataset is 49. Similarly, we used 66% (3838 records) of data for training model and the remaining 34% (1978 records) of data for validating the performance. The CDF is shown in Figure 6; obviously, SSAP-NN achieved the best positioning performance. Consider the 80% probability of CDF as an example; the SSAP-NN algorithm has an error distance under 4 meters. In contrast, the error distances by DIFF-NN and RAW-NN are 4.5 meters and 5.5 meters for the same probability, respectively.
Figure 7 shows the mean positioning error distance by the four methods. It can be seen that our proposed method achieves minimum mean positioning error for all the experiment scenarios. Specifically, the mean positioning error distance by SSAP-NN for all experiment scenarios is 2.12 meters; the positioning performance increases more than 13% compared to DIFF-NN and HLF-NN and more than 21% compared to RAW-NN.

Mean positioning error distance.
From the above results, it is clearly indicated that SSAP fingerprint feature performs in more stable and robust way than the other three positioning fingerprints. The reason is that the positioning fingerprint of DIFF-NN, HLF-NN, and RAW-NN is based on the raw RSSI without considering the Wi-Fi APs, which are variable due to heterogeneous devices or dynamic environments. On the contrary, the SSAP fingerprint feature considers both the raw RAW values and the scanned Wi-Fi APs information, which is robust for Wi-Fi RSSI variance in a small range, and all the experiments show the superiority of SSAP-NN.
5.2.2. Evaluation of Positioning Time
In this experiment, we defined the positioning time as the average time in seconds required to obtain the precise location for one positioning fingerprint. Positioning time plays a vital role for a successful indoor positioning system, since less positioning time means less energy consumption for user's mobile device. We used the dataset of the second floor for evaluating the positioning time; one positioning fingerprint includes 28 attributes as described in Table 4. Figure 8 shows the positioning time comparison with different number of instances using the dataset; the running time is obtained after repeating the experiments 10 times on Intel's Core i5 based computer. From Figure 8, it can be seen that SSAP-NN and RSS-NN consume nearly the same positioning time at online positioning, while DIFF-NN and HLF-NN spend much more time for the same test instances. The mean running time for one positioning fingerprint is 18.1 ms (SSAP-NN), 28.1 ms (RSS-NN), 337.2 ms (DIFF-NN), and 393 ms (HLF-NN). That is because the fingerprint feature dimension of SSAP-NN is constant (usually less than 10), and RAW-NN is

Running time for the three positioning methods.

The indoor layout of the experimental environment.
6. Conclusion
In this paper, we observed that Wi-Fi APs in a small RSSI range at the same location are very consistent and stable, namely, segmentation similarity of Wi-Fi access points (SSAP). Moreover, we evaluated the fact that this SSAP is ubiquitous to different devices based on the similarity of RSSI histogram bins. Then, we firstly designed a novel fingerprint feature using SSAP and proposed a two-stage positioning algorithm for online positioning. The basic advantage of our method is that it is more robust and stable than raw RSSI, which can solve the RSSI variance with a calibration-free approach. In addition, the proposed fingerprint feature has much less dimension than fingerprint feature using the raw RSSI or using the difference of RSSI. Another important advantage of the proposed method is the ability to use all scanned Wi-Fi APs' information instead of only selecting a subset of Wi-Fi APs for indoor positioning. This makes our method suitable for large environment, such as airport or super shopping mall, where the different Wi-Fi APs usually are hundreds but the scanned APs at a location may only include several available APs. Experiments in three floors were conducted, and the results demonstrate that our proposed method performs better than three baseline methods, which not only achieved high positioning accuracy but also consumed less positioning time.
As future work, we plan to improve our indoor positioning system with built-in sensors of mobile devices. Firstly, we will leverage human motions based on built-in sensors to build positioning fingerprint map, which involves intensive costs on manpower and time before. Secondly, we will utilize human motions to calibrate obvious positioning error.
Footnotes
Conflict of Interests
The authors declare that there is no conflict of interests regarding the publication of this paper.
Acknowledgment
This work has been supported by Hangzhou Key Laboratory for IoT Technology & Application.