
Abstract
A wireless sensor network (WSN) with the potential to monitor and locate partial discharge (PD) in high-voltage electricity substations using only received signal strength (RSS) is proposed. The advantages of an RSS-based operating principle over more traditional methods (e.g., time-of-arrival and time-difference-of-arrival) are described. Laboratory measurements of PD that emulate the operation of a PD WSN are presented. The hardware architecture of a prototype PD WSN is described and the particular challenges of an RSS-based location approach in an environment with an unknown, and spatially varying, path-loss index are discussed. It is concluded that an RSS-based PD WSN is a plausible solution for the monitoring of insulation integrity in electricity substations.
1. Introduction
The integrity of electrical insulation in high-voltage (HV) electricity transmission and distribution networks is a crucial issue for equipment reliability. Insulation damage, which may be due to manufacturing defects, poor repair practices, or aging processes, typically results in partial discharge (PD). PD is a localised discharge that bridges only part of the space between the electrodes sustaining the electric field [1]. It comprises short-duration (typically 1 ns to 1 μs) current pulses that occur predominantly in the first and third quadrants of the power system cycle. The frequency spectrum of the pulses has measurable energy extending well into the gigahertz region and a significant fraction of this energy is radiated from the conductors close to the PD source. The frequency response of the radiating structure, however, results in a power spectrum with the majority of energy confined to frequencies below a few hundred megahertz. Observation of radiated PD energy using VHF/UHF “free-space” radiometers is an effective way of monitoring the condition of power systems insulation. A spatial array of such sensors distributed throughout a substation has the potential to not only identify that a source of PD exists but also localise this source, thereby allowing equipment with insulation defects to be identified and maintained or replaced before catastrophic (and costly) failure occurs [2].
In this paper, progress in the development of a radiometric wireless sensor network (WSN) to provide whole-substation insulation condition monitoring is presented. Such a WSN has significant benefits over wired counterparts including ease of installation and reconfiguration, lower installation costs, and scalability. A cost-effective radiometric detection system for the detection, localisation, and diagnosis of PD has the potential to be a key part of the future smart grid.
2. Radiated PD
PD does not cause immediate failure of HV equipment but, when present, may cause gradual degradation of the insulation until complete discharge (i.e., flashover) occurs. The most damaging form of PD typically starts in microscopic insulation voids. The permittivity of the void is lower than that of the surrounding insulation and the electric field strength in the void is therefore correspondingly higher. Furthermore the dielectric strength of material in the void is usually less than that of the surrounding insulation. This results in discharge occurring within the void at lower field strength than would be necessary for discharge to occur in the undamaged insulation. Figure 1(a) illustrates, schematically, PD in an insulator containing a void and Figure 1(b) shows an artificial source of void PD (referred to here as an internal PD emulator) that has been designed to generate PD in the laboratory [3]. The emulator is constructed by drilling a hole in a disc of dielectric material that has a permittivity close to that of the insulation being emulated. The disc is sandwiched between two other similar discs without holes. The three-disc composite is held between a pair of flat, parallel electrodes across which the HV signal is applied. The whole assembly is immersed in transformer oil to suppress corona discharge from the electrode edges.

(a) Schematic illustration of internal PD and (b) internal PD emulator.
PD may also occur when a usually earthed metallic component in an item of HV plant becomes disconnected from ground. The resulting discharge is referred to as floating-electrode PD. Figure 2(a) is a schematic illustration of floating-electrode PD and Figure 2(b) shows an emulator constructed to generate this class of PD in the laboratory.
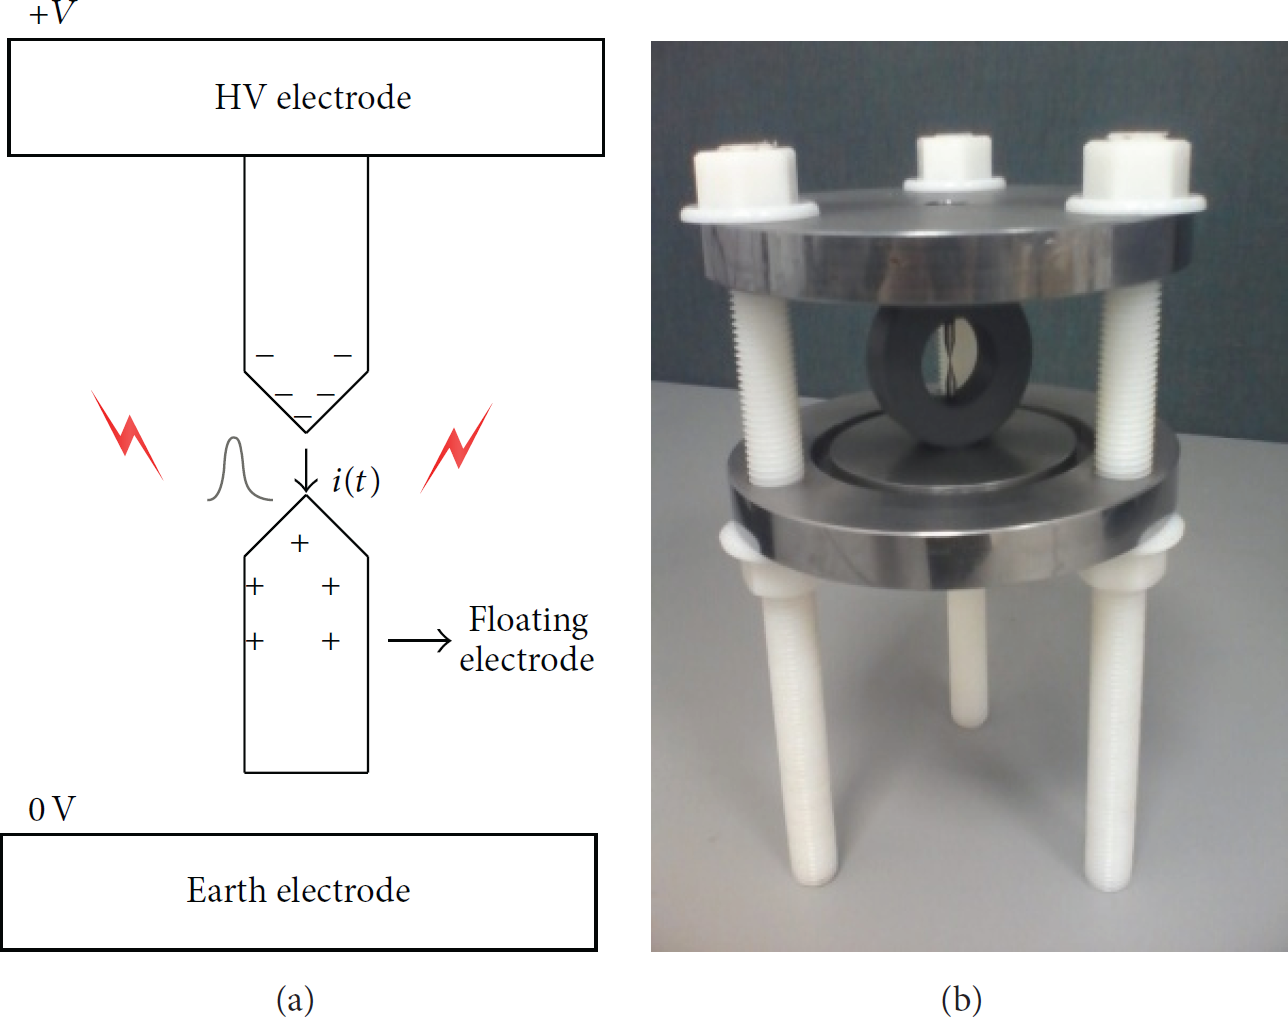
(a) Schematic illustration of floating-electrode PD and (b) floating-electrode PD emulator.
Figure 3(a) shows a typical PD current pulse. For large voids and gaps the rise time

(a) Typical PD current pulse and (b) typical signal arising from radiated PD energy.
PD intensity or strength is specified by the apparent charge transferred during the discharge event. It is typically measured in picocoulombs or nanocoulombs and is related to the time-integral of the current pulse. Strictly, the apparent charge is that charge which, if injected suddenly into the terminals of the device under investigation, would result in the same response of the measurement instrument as the PD event [4].
Classical PD measurements, as described in [1], use a galvanic connection to conduct the PD current pulse (or a voltage pulse that is proportional to the current pulse) via a cable to the measurement instrument. In this case the pulse is easily integrated to find the apparent charge. It is not easy, however, for measurements of radiated PD to quantify strength in this way since the RF signal at the terminals of a receiving antenna is generally related to a time-derivative of the PD current pulse rather than a time-integral. Furthermore there are numerous transmission losses that are generally unknown in the case of the radiometrically received PD including the radiation efficiency of the “transmitting” structure and the propagation losses.
Figure 4 shows a typical frequency spectrum in an outdoor substation measured in the presence, and absence, of PD using a commercial instrument designed for substation PD surveys.
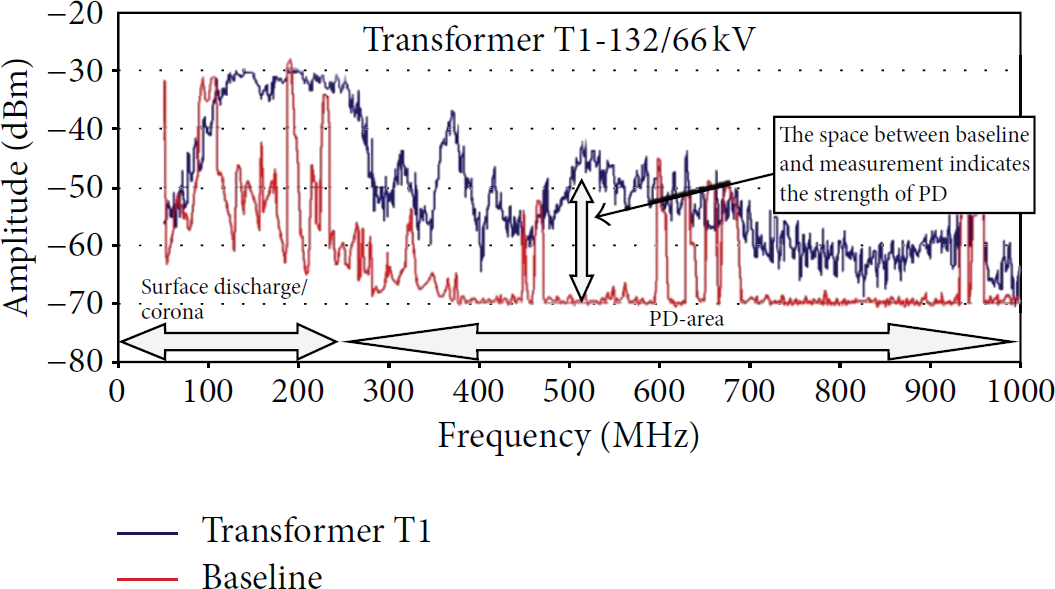
Frequency spectrum of PD signals: lower trace is a reference in the absence of PD (after [5]).
3. PD Wireless Sensor Network
A PD wireless sensor network (PD WSN) comprises a network of PD radiometer sensors, each interfaced to a WSN node. Two electromagnetic compatibility issues in such a WSN need to be considered in particular. These are (i) possible interference of PD signals with the communications signals of the WSN leading to poor WSN performance and (ii) augmentation of the measured radiometric PD power by the WSN signals leading to an overestimate of PD intensity. The primary means of mitigating both is an appropriate choice of sensor measurement frequency band and WSN operating band. The majority of radiated PD energy typically resides at frequencies below 800 MHz and the frequency band proposed for the PD WSN is the 2.45 GHz ISM band. In respect of (i) an assessment has been made of the impact of impulsive processes in the substation environment on ZigBee WSN technology using the ISM frequency band [6]. The result of this assessment suggests that the substation electromagnetic environment has no significant adverse impact on WSN performance. In respect of (ii) appropriate filtering at the front-end of the PD radiometer will ensure that the presence of WSN communications signals does not appreciably affect the PD intensity measurement.
3.1. Substation Electromagnetic Environment
The operation of switching devices which make and break power system currents results in electromagnetic emissions which represent potential sources of broadband interference to a network of PD sensors. Such emissions are infrequent, however, and of limited duration and will not, therefore, be mistaken for genuine PD.
Narrowband communication signals in the PD measurement band (e.g., originating from TV and radio broadcast transmitters) are also potential sources of interference. This narrowband interference is mitigated by the fact that such signals will almost always originate from a distant transmitter and thus equally “bias” the radiometric measurements of all sensors within a given substation. Since the PD signals being monitored originate, by definition, from inside the substation compound, differences in the radiometric temperatures of the sensors will primarily reflect the spatial distribution of PD. It is thus the spatial (and temporal) derivatives, rather than the absolute levels, of PD activity recorded by the PD WSN that will be the primary metrics indicative of compromised insulation.
3.2. Choice of WSN Technology
WSNs are a technological solution for implementing low-cost, self-organising, flexible, robust, and reliable systems for monitoring and control applications. The proposed radiometric WSN integrates RF monitoring technology with a WSN to provide continuous real-time insulation condition monitoring across an entire substation. This concept is illustrated in Figure 5.
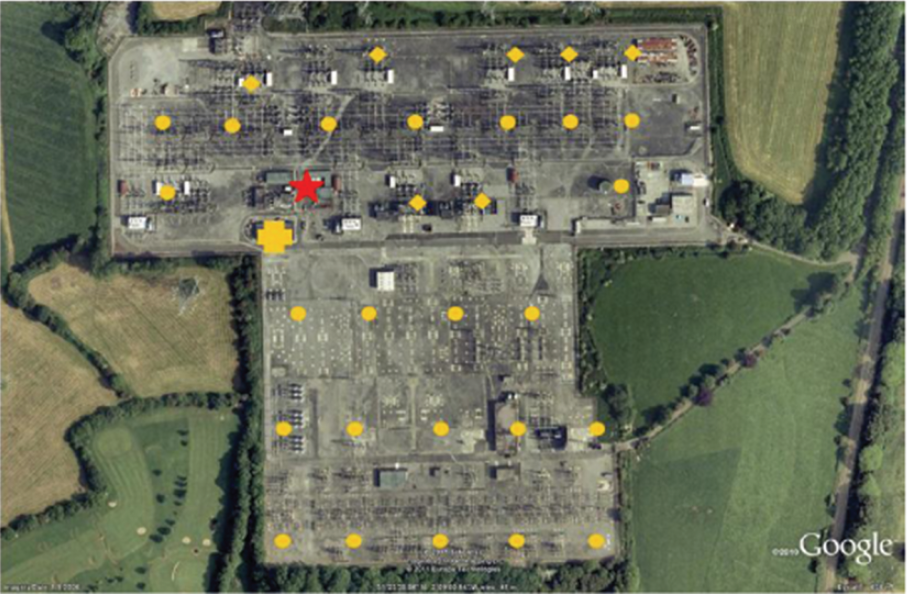
Hypothetical PD WSN deployment: star denotes PD source, circles denote wireless sensor nodes, and cross denotes WSN management node/gateway.
A variety of WSN standards exist. The IEEE 802.15.4 protocol has been developed to provide reliable, power-efficient, communication capabilities for low-power, low data-rate WSNs. The typical sensitivity for an IEEE 802.15.4 2.45 GHz receiver is −85 dBm providing a typical communication range of 100 m.
There are three key standards available for industrial automation based on IEEE 802.15.4, namely, ZigBee, WirelessHART, and ISA100.11a. ZigBee supports contention-based access within a time division multiple access (TDMA) system. It does not utilise frequency hopping which makes it susceptible to interference. Persistent interference can therefore halt communications. ZigBee does not provide any guarantee of end-to-end wireless communication delay.
WirelessHART [7] and ISA100.11a [8] are better suited to harsh electromagnetic environments than ZigBee. They both use TDMA with frequency hopping for channel access and they both employ self-configuring, self-healing, multihop, mesh networks. Both are well-suited to the challenging environment of electricity substations and permit reliable end-to-end packet delivery with quality-of-service guarantees.
The particular issue of coexistence between the WSN technologies and other ISM band technologies such as WiFi has not been specifically addressed in this study but has been the subject of research. A review of work in this area is given in [9]. The frequency hopping TDMA capability of WirelessHART and ISA100.11a is attractive in that it seems likely this will improve robustness to interference from IEEE 802.11 and similar devices.
WirelessHART is a wireless extension of the wired HART field-communication protocol. It is a mature technology and already has significant industrial presence. It is supported by a number of leading suppliers including Emerson, ABB, and Endress + Hauser and Pepperl + Fuchs. ISA100.11a is supported by Honeywell and Yokogawa and is a more generic wireless standard that will allow the encapsulation and transportation of other protocols (including HART) through its tunnelling protocols. Implementation of this tunnelling facility is not currently available however. The maturity of HART, the convenience of its deployment, and its widespread adoption by industry have been strong motivating factors in the selection of WirelessHART for the development of the prototype PD WSN.
4. Sensor Nodes
The PD WSN is a collection of broadband radiometer sensors that measure PD activity interfaced to WirelessHART modules. The WirelessHART modules relay the PD activity data to an access point via wireless links. The access point is interfaced to a network and security manager and may also be interfaced to network gateway.
Each radiometer sensor comprises an RF front-end, a four-channel filter bank, a signal conditioning unit, and a microcontroller, Figure 6.

Sensor node interfaced to WirelessHART module.
The RF front-end comprises an ultra-wideband (UWB) low noise amplifier (LNA), a roofing filter, and a four-channel power splitter. One of the four channels (channel 1) is primarily designed for PD location whilst the other three are primarily designed for PD diagnosis.
The signal conditioning unit also has four channels, one for the PD location channel and one for each of the three diagnostic channels. Each signal conditioning channel (SCC) contains an RF power detector, a noninverting amplifier, a high-speed analogue switch, a transistor-reset integrator, two precision comparators, and a monostable multivibrator. The location SCC, Figure 7, has an additional monostable multivibrator (following the first comparator) that provides count pulses for each PD event. The SCC reduces the PD signal bandwidth using the RF power detector and integrator. When a PD signal is received the comparator triggers the monostable multivibrator and the resulting pulses are fed to the microcontroller for counting. This count provides the number of detected PD pulses per power system cycle which is one of the two principal metrics of PD activity. The comparator simultaneously closes the analogue switch for the duration of the PD pulse and the (quasi-DC) integrator output voltage is increased (approximately stepwise) by an amount proportional to the area under the detected pulse, Figure 8. The purpose of the analogue switch is to prevent a drift in the integrator output due to noise and narrowband interference in the (relatively long) intervals between PD pulses.

Functional block of one signal conditioning channel.

(a) Signal at integrator output for a train of received PD pulses and (b) signal for a single PD pulse at antenna output (lower trace, 0.1 V/division, 400 ns/division) and integrator output (upper trace, 1 V/division, 400 ns/division).
When the integrator output voltage reaches a predetermined threshold a second comparator is triggered and the integrator output is reset to zero. Each integrator reset event triggers a monostable multivibrator and the resulting pulses are counted by the microcontroller. The mean reset frequency of the integrator is thus a measure of aggregated PD strength which is the second principal metric of PD activity. Channel 1 measures PD intensity within the entire 50–800 MHz measurement band. Channels 2, 3, and 4 measure PD intensity in the 50–290 MHz, 290–490 MHz, and 490–800 MHz subbands, respectively. The relative powers in the subbands contain potential diagnostic information about the source of PD. Corona, for example, (which is less damaging than internal PD) typically has a spectrum with a greater proportion of energy concentrated at lower frequencies. Figure 8(a) shows the integrator output of channel 1 in response to PD at the radiometer input. Figure 8(b) illustrates the relationship between the RF PD signal pulse at the radiometer input and the integrator output on an expanded time-base. The time offset between the RF signal and signal at the integrator output is due to the frequency response, slew-rate, and finite bandwidth of the RF detector, integrator, and operational amplifiers.
The PD event count pulse triggers the microcontroller to sample the integrator outputs of each measurement channel. This, and all other, data now in the microcontroller is passed to the WirelessHART module via a UART port. The WirelessHART module then transmits the data to the WirelessHART manager via the access node where it is logged by a PC for archiving and analysis. Each WirelessHART module may receive data from adjacent devices for relaying to the access node. The RF front-end, signal conditioning unit, microcontroller, and WirelessHART module are shown in Figure 9.

(a) RF front-end, (b) signal conditioning board (both sides), (c) microcontroller, and (d) WirelessHART module.
5. PD Localisation
An important function of the PD WSN is the localisation of PD. The traditional location methods of time-of-arrival (TOA), time-difference-of-arrival (TDOA), and angle-of-arrival (AOA) have drawn considerable recent research attention [10–12]. The advantage of an RSS approach, however, is that it requires neither accurate (submillisecond) time-synchronisation between nodes nor the use of an antenna array [13].
The classical propagation model used for RSS-based location can be written as


Proof-of-principle measurements, to determine the plausibility of an RSS-based PD WSN, have been made in the laboratory. Figure 10 shows the measurement space.

(a) Measurement space and (b) measurement space plan.
The PD emulator shown in Figure 2 was used to generate the PD signal. A radiometric sensor was moved sequentially between locations to gather the data that would be collected by an ensemble of sensors. There was no change in the laboratory environment between measurements. In both cases the energies of 100 received PD pulses were calculated at each emulated sensor node position. The mean value of the energy at each location was then used to estimate the location of the PD source.
Figure 11 shows the estimated PD source locations (crosses) corresponding to a range of values of path-loss index between
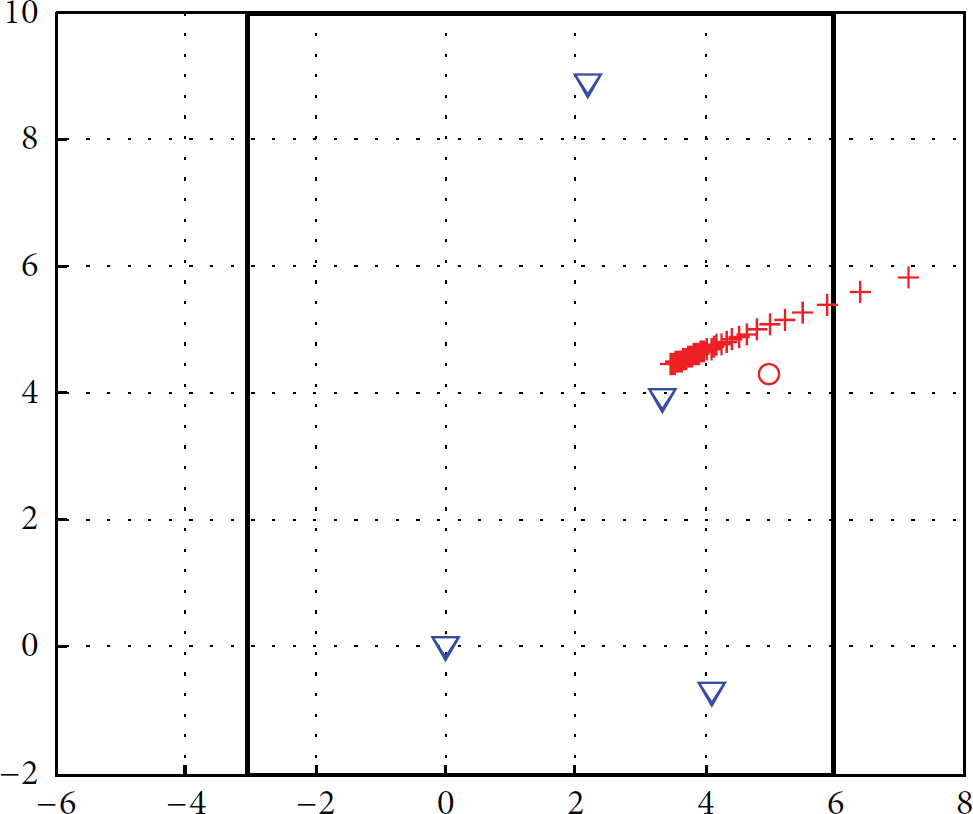
Location estimates: circle denotes actual PD source location, triangles denote emulated measurement node locations, and crosses denote PD source location estimates (axis scales in metres).
The accuracy achieved (and perhaps the accuracy achievable) is undoubtedly less than that which could be realised using TOA or TDOA. The simplicity of RSS measurements, the scalability advantage realised by not requiring time-synchronisation between receiving nodes, and the fact that an accuracy of 1 m is sufficient to identify a PD source with an item of electrical plant in a substation are, however, encouraging.
The proof-of-principle measurements represented by Figure 11 demonstrate the importance of knowing the path-loss index n. This can be measured by installing a transmitter that periodically radiates an artificial PD signal of known power during a known timeslot. A complication, however, is that in the complex scattering environment of a substation n may vary with location of both source and sensor. To address this, an estimate of n can be made using a calibration process in which the artificial PD source is sequentially located at a grid of points within the measurement area. (The grid points could be chosen to be colocated with the sensors, each receiving sensor becoming a transmitter during a short, fixed timeslot.) This allows values of n to be calculated for every combination of artificial PD source location and sensor location. The values can be mapped to a source coordinate
6. Conclusions and Further Work
The presence of PD is a reliable indicator of compromised insulation in HV transmission and distribution equipment. Such PD comprises narrow pulses which have spectra extending into the gigahertz region. Radiated signals from PD sources have lower bandwidth, however, largely constrained to frequencies below a few hundred megahertz. A WSN based on VHF/UHF radiometers can be used to detect PD. The spatial distribution of PD can be used to locate its likely source and the time evolution of PD can be used to infer the risk of imminent insulation failure. Radiometric PD monitoring does not require disconnection of plant from the network for installation and can therefore be deployed whilst plant remains in service. The measurement of PD signal-amplitude only is likely to result in degraded location accuracy compared with conventional time-difference-of-arrival measurements but there are compensatory advantages in terms of simplicity, cost, and scalability. Proof-of-principle amplitude-only measurements suggest that PD source location accuracy of the order of 1 m may be achievable. Degradation of WSN performance due to interference from PD signals and PD intensity measurement error due to reception of WSN communications signals can both be mitigated by the selection of a WSN technology with operating frequency well above the PD measurement band and the incorporation of an appropriate RF roofing filter in the radiometer sensor. The use of incoherent detection followed by integration reduces bandwidth dramatically resulting in a low mean sampling rate (equal to the mean PD pulse rate). Removing the need for fast ADCs decreases memory requirements, decreases the data transmission rates, and decreases sensor node energy requirements. If path-loss index is sufficiently independent of sensor and source location then conventional location algorithms using ratios of measured PD intensity at sensor node pairs can be applied. If path-loss index is location dependent, however, calibration processes to characterise the spatial variation of path-loss index can be used with iterative algorithms to estimate location.
Field trials of the prototype PD WSN described above are scheduled to commence in a 400 kV UK electricity substation before the end of 2015.
Footnotes
Conflict of Interests
The authors declare that there is no conflict of interests regarding the publication of this paper.
Acknowledgment
This work was supported by the U.K. Engineering & Physical Sciences Research Council under Grant EP/J015873.