
Abstract
In wireless sensor network, data loss is inevitable due to its inherent characteristics. This phenomenon is even serious in some situation which brings a big challenge to the applications of sensor data. However, the traditional data estimation methods can not be directly used in wireless sensor network and existing estimation algorithms fail to provide a satisfactory accuracy or have high complexity. To address this problem, Temporal and Spatial Correlation Algorithm (TSCA) is proposed to estimate missing data as accurately as possible in this paper. Firstly, it saves all the data sensed at the same time as a time series, and the most relevant series are selected as the analysis sample, which improves efficiency and accuracy of the algorithm significantly. Secondly, it estimates missing values from temporal and spatial dimensions. Different weights are assigned to these two dimensions. Thirdly, there are two strategies to deal with severe data loss, which improves the applicability of the algorithm. Simulation results on different sensor datasets verify that the proposed approach outperforms existing solutions in terms of estimation accuracy.
1. Introduction
In recent years, with the development of sensing technology, wireless communication, and computing technology, wireless sensor network (WSN) [1] has been a focus of research and attracts strong attention from military, industry, and academia. In many applications of WSN, data loss [2, 3] is common due to limited resources of sensor nodes [4], interference of noise, and influence of environment. Even in some special situation, this phenomenon is very serious [5] which brings a big challenge for a variety of sensor data processing. If these missing values cannot be filled in accurately, the existing analysis tools cannot be applied. If the missing data are directly deleted, a large amount of raw data will be lost which will reduce the accuracy and reliability of analysis results and cause a great waste of energy. Data estimation algorithms can effectively solve this problem, and they provide strong support for query [6], aggregation, transmission, and warning [7]. So missing data estimation is particularly important for various applications of WSN.
However, the traditional data estimation methods [8] cannot be directly used in WSN. Sensor data estimation methods should consider the characteristics of the application system and sensor data. While many studies on sensor data estimation have been conducted and some achievements have been made, there are still some issues unresolved such as underutilization of sensor data's properties, high computational complexity, and low estimation accuracy.
We present a Temporal and Spatial Correlation Algorithm (TSCA) to estimate missing data in this paper. There are four main innovations of this algorithm. Firstly, it saves all the data sensed at the same time as a time series, and the most relevant series are selected as the analysis sample, which improves efficiency and accuracy of the algorithm significantly. Secondly, it selects the most data-relevant sensor nodes and gets spatial estimation based on comprehensive instantaneous rate of change. In the time dimension, it differentiates the order of past frames to estimate the missing rate which highlights the timeliness of sensor data. Thirdly, different weights are assigned to temporal and spatial dimensions to get the final result. Finally, there are two strategies to deal with severe data loss, which improves the applicability of the algorithm.
The rest of this paper is organized as follows. Section 2 presents the classic estimation algorithms of missing sensor data. Section 3 presents the framework of the algorithm proposed in this paper. Section 4 describes specific design of our algorithm and extends to severe loss scenes. Section 5 evaluates the proposed approach through simulation experiment. Section 6 concludes this paper.
2. Related Work
The estimation algorithms of missing data have been extensively researched in statistics, for example, Mean Substitution, Imputation by Regression, Expectation Maximization, Maximum Likelihood, Multiple Imputations, Bayesian Estimation, and Hot/Cold Deck Imputation [9]. However, none of these algorithms can be used in WSN, because they require the data miss at random and their efficiency is low.
To solve sensor data missing problem, Tiny DB [10] which is a mainstream sensor database system uses the mean of data sensed by other nodes directly as the estimated value. However, when the relationship among the sensor nodes is weak, the estimation result is not precise. MASTER-M algorithm [11] computes the similarity between sensor nodes and sorts them. It selects nodes which have high missing rate as seeds and clusters the whole network into several groups. MARSTER-tree is used to estimate missing data in each cluster. However, the relationship between the sensor nodes is not transitive; for example,
The above algorithms only consider the temporal or spatial correlation and few algorithms take both of them into account. Environmental Space Time Improved Compressive Sensing (ESTI-CS) algorithm [16] is based on compressed sensing. This algorithm uses L1 norm optimization method for solving the reconstructed signal and it requires iteration which causes high complexity. Reference [17] proposes Trend Regression Expanding Cluster Interpolation (TRECI) algorithm which considers the change of sensor data over the time. Sensor nodes are divided into several groups dynamically and time interpolation assessments are conducted within each group. It only analyzes similarity rather than predicting the loss in the spatial dimension. Data Estimation using Statistical Model (DESM) [18] algorithm estimates the missing data based on the propagation characteristics of physical quantities in the time dimension; for example, according to the fact that light intensity is inversely proportional to the square of the distance, the light intensity can be estimated in certain region. In the spatial dimension, it estimates missing data based on the correlation between the estimated node and its surrounding nodes. The disadvantage of this algorithm is that it is only appropriate for attributes which have explicit physical models. Besides, the estimation in the spatial dimension is rough. Reference [19] proposes Mining Autonomously Spatial-Temporal Environmental Rules (MASTER) algorithm. It mines association of sensor data in temporal and spatial dimensions. A big drawback of this algorithm is that when the relationship among sensor data is weak, the prediction is very inaccurate.
3. Framework of Proposed Algorithm
Sensor data collected by a node
From the comparison of difference between two consecutive intervals and difference between neighbors [16], we can see that most of measured data in real world always change stably; that is, there is little mutation on environmental value between adjacent time slots. In addition, environments are often smooth in a small area; that is, over a period of time, environmental values are similar among some nodes. Thus, we can use spatiotemporal correlations to estimate the missing data.
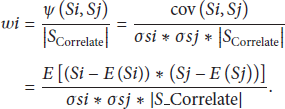
Considering that the existing missing data estimation algorithms have not made full use of features of sensor data and they have high computational complexity as well as low accuracy, this paper proposes a missing data estimation algorithm based on temporal and spatial correlations as shown in Figure 1. The evaluation result of this algorithm is Estimate which can be computed by the following formula:


Framework of the algorithm in this paper.
This algorithm consists of three parts:
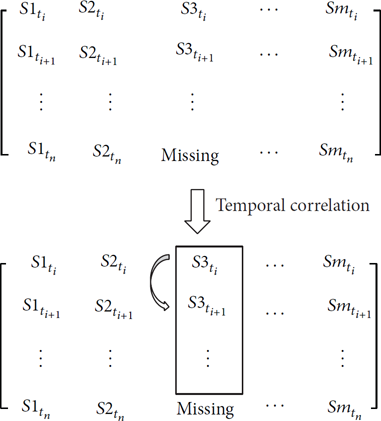
Firstly, the algorithm needs to determine the sample data used in the process of analysis. Because sensor data is time-sensitive, using a different number of sensor data for analysis will get different results. Relationship between the sensor nodes in different periods is not the same, so selecting appropriate data used for analysis is important. Sensor nodes sense data periodically. The algorithm in this paper saves data sensed by all the nodes at the same time as a series. Continuous period produces continuous time series. For example, sensed data at Secondly, correlation analyses are conducted in the spatial dimension. The distance between sensor nodes is defined according to the requirement of estimation. The most relevant sensor nodes are selected based on the distance function through analyzing the aforementioned sample data. Those relevant nodes are used to get spatial estimation. The weight of each relevant node Thirdly, in the time dimension, estimation is based on the sample data sensed by the estimated node. In order to give full play to the timeliness of data, past frames are distinguished chronologically during the process of analysis, so the contribution of newer data is greater. The weight of temporal estimation is
4. Detailed Design of TSCA
4.1. Select Sample Data
The relationship between the sensor nodes in WSN will change over time, so analyzing different sample data will generate different relationship, and we get different assessment values. In addition, the size of sample data will have a great impact on the assessment results. Due to the interference of environmental noise, too little sample data cannot reflect the spatiotemporal correlation of sensor data fully, while excessive sample data reflect the average value over an extended period of time rather than the instantaneous correlation which will reduce the accuracy of the assessment. Therefore, the values and the size of sample data should be determined as accurately as possible.
Considering the fact that the spatiotemporal correlation of sensor data approximately remains constant in a short period of time, when we assess the missing data at
In WSN, sensor nodes are deployed in the given area. All the sensor nodes can be listed as
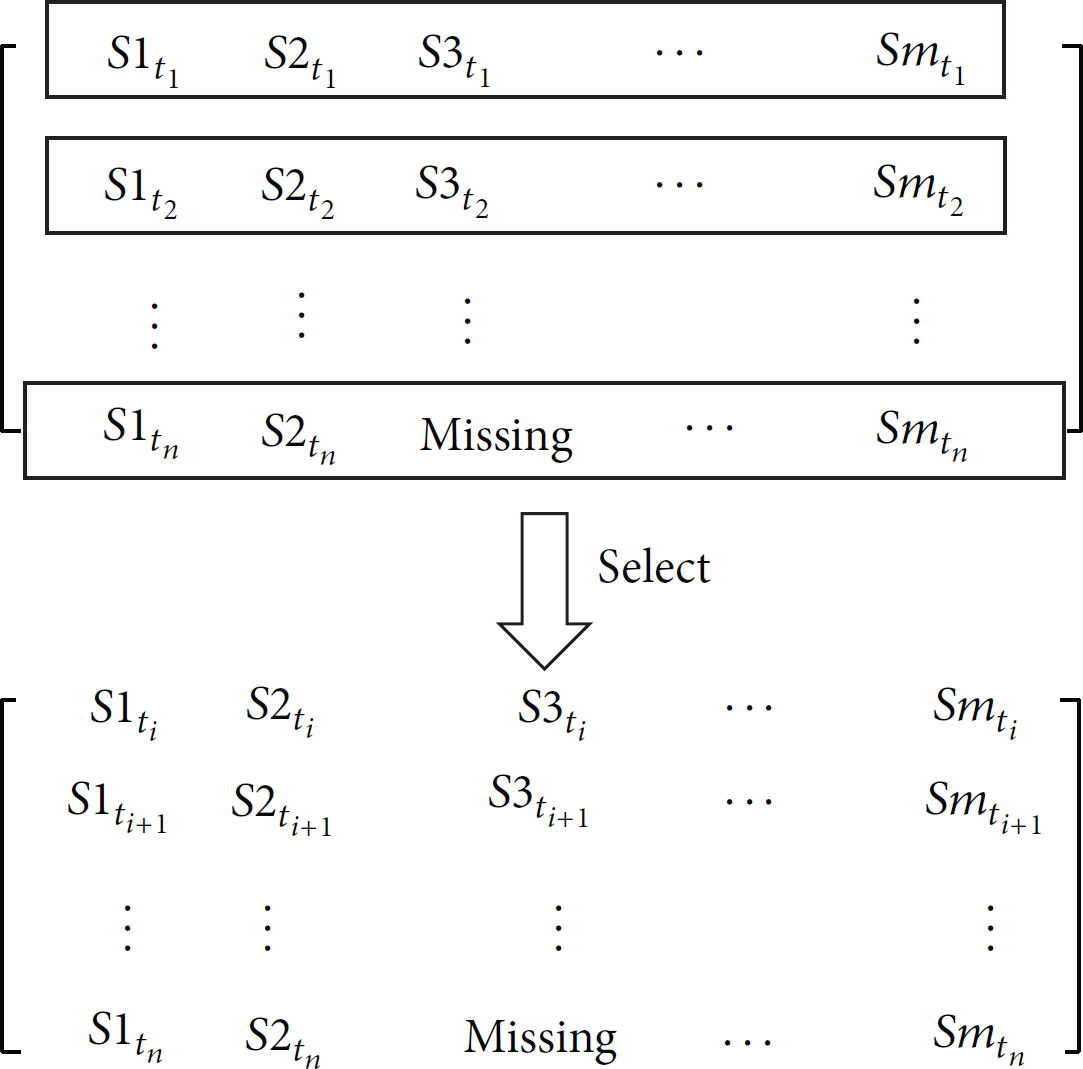
Select sample data.
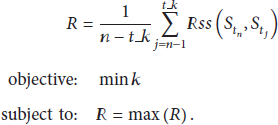
As validated by practical data, the correlation of time series is basically stable in a short period of time and then follows a decreasing trend. So we can get the most relevant sample data

The pseudocode of selecting process is described as in Algorithm 1.
(1) (2) (3) for (4) (5) (6) (7) (8) if (9) return i; (10) end for
4.2. Spatial Correlation
Definition 1.
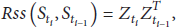
If the sample datasets (data sensed between
Definition 2.
The distance between sensor nodes

If
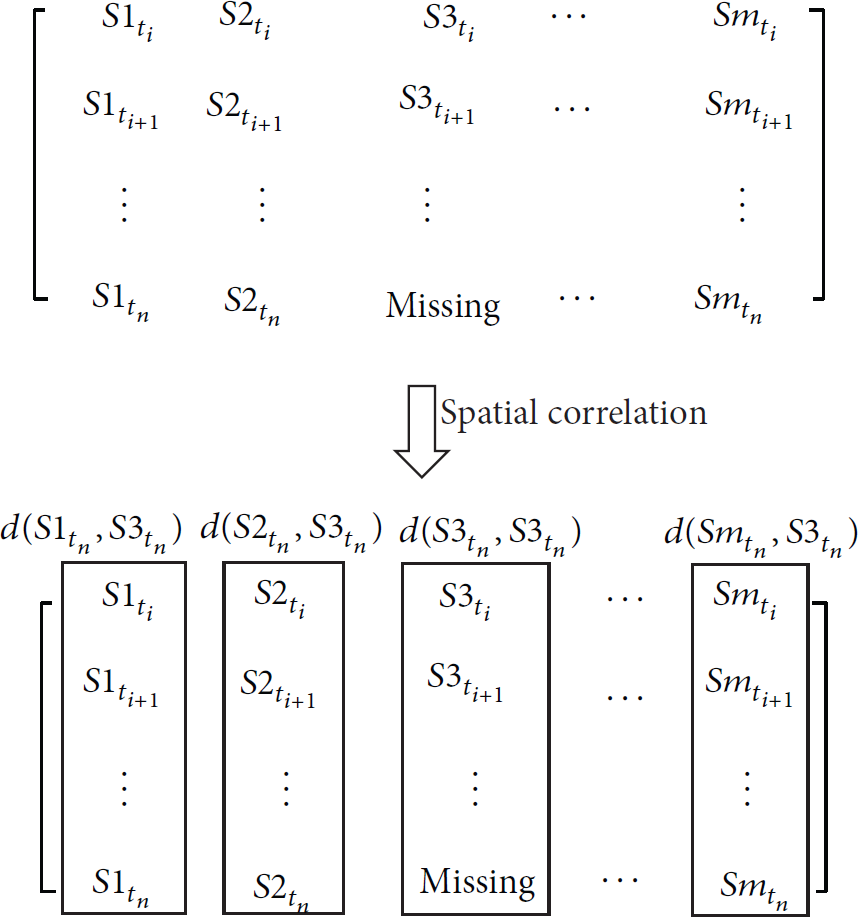
Spatial correlation.
As shown in Figure 3, in order to estimate missing data of sensor node
Each node in

The pseudocode of analysis in spatial correlation is described as in Algorithm 2.
V: threshold of distance
(1) (2) for (3) (4) if (5) (6) end if (7) end for (8) for each (9) (10) (11) (12) end for
4.3. Temporal Correlation
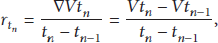
As shown in Figure 4, we estimate the missing data based on historical sample data of the estimated node. Evaluated result is obtained by a comprehensive measure on the variation of sample data. Change rate of data is defined as
Temporal correlation.
Change rates of all sample data are computed, and different weights

Based on the weighted rate of change and value of the estimated node at

The way to calculate the weighted rate of change is listed in Table 1, where
Weighted rate of change.

V_Temple: estimation value in temporal dimension
(1) for (2) (3) (4) end for (5) (6)
4.4. Discussion
Unlike traditional missing data [20], sensor data have five typical patterns of missing [16] which are Element Random Loss, Block Random Loss, Element Frequent Loss in Row, Successive Elements Loss in Row, and Combinational Loss, as shown in Figure 5. The algorithm in this paper uses Combinational Loss mode, that is, any combination of the first four modes. In order to improve the applicability of our algorithm, we take a certain strategy to make the algorithm suitable for some serious loss situations. This algorithm estimates missing values from the spatiotemporal aspects, so severe loss mainly shows up as rows or columns missing continuously.

Data loss patterns in WSN (the black cells represent missing data).
As for severe data loss in time series, if data missing rate of a time series exceeds a certain threshold (the default is 40% in this paper), this time series will be ignored and we move forward to select sample data. As shown in Figure 6(a), the loss of time series at
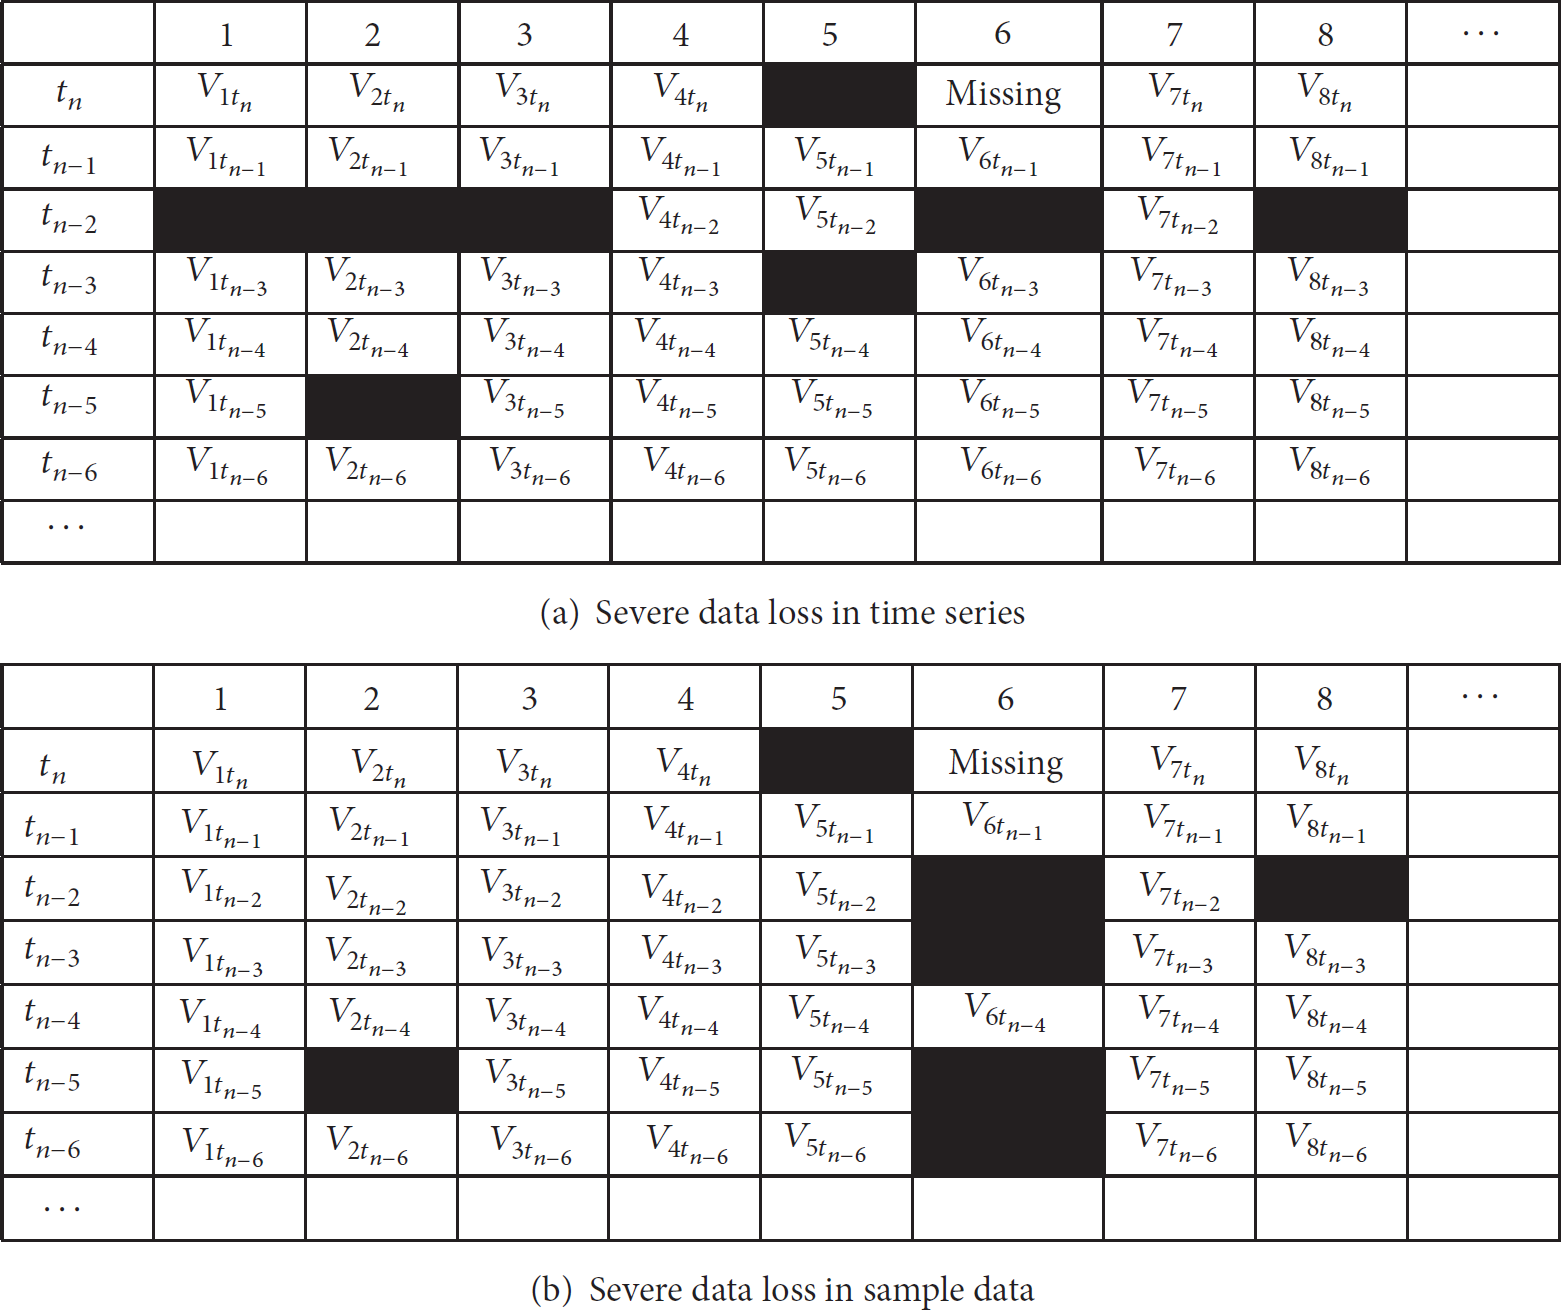
Severe data loss patterns in this paper (the black cells represent missing data).
If data missing rate of the estimated sensor node does not exceed the threshold (the default is 50% in this paper), missing data will be ignored and the algorithm described before will be used to estimate the missing data directly. If the missing rate of sample data exceeds the threshold, the algorithm will obtain the final result through iteration. As shown in Figure 6(b), node 6 has a serious lack of sample data. Compute the values of node 6 at
5. Performance Evaluation
The algorithm proposed in this paper is evaluated over real-world data, namely, Intel-lab dataset [21]. This dataset is a trace of readings from 54 sensor nodes deployed in the Intel Research Berkeley Lab. These sensor nodes collected light, humidity, temperature, and other information once every 30 s from February 28 to April 5, 2004.
Since the original dataset contains missing values, in order to evaluate the performance of the algorithm, we select the relatively complete part of the test data through deleting sensor nodes which contain serious data loss. For example, when the sampling interval is set to five minutes, there is a serious lack of sensor data in nodes 5 and 15 (with 90% of data lost). So data of these two sensor nodes will not be selected as sample. In this paper, we use the accuracy of the estimation as the evaluation criteria. Specifically, we use Root Mean Square Error (RMSE):

To verify the effectiveness of the algorithm proposed in this paper, we compare it against other algorithms—AMR [12], TRECI [17], DESM [18], and MASTER [19].
5.1. Convergence
Loss rate of raw data is about 5%. We verify the validity of the first step in this algorithm on the original temperature dataset where the sampling interval is set to 5 min. By calculating the average correlation, it can be known that the size of the sample data is 13. We choose a different number of data, and accuracy comparison of results is shown in Figure 7. It shows that a small or too large amount of data will cause an increase in the error rate. So we choose the smallest advisable size to ensure the accuracy while reducing the complexity of the algorithm. In Figure 8, we compare different algorithms against the size of required sample converging to the optimal solution. It can be seen that TSCA converges fast and has the best performance.
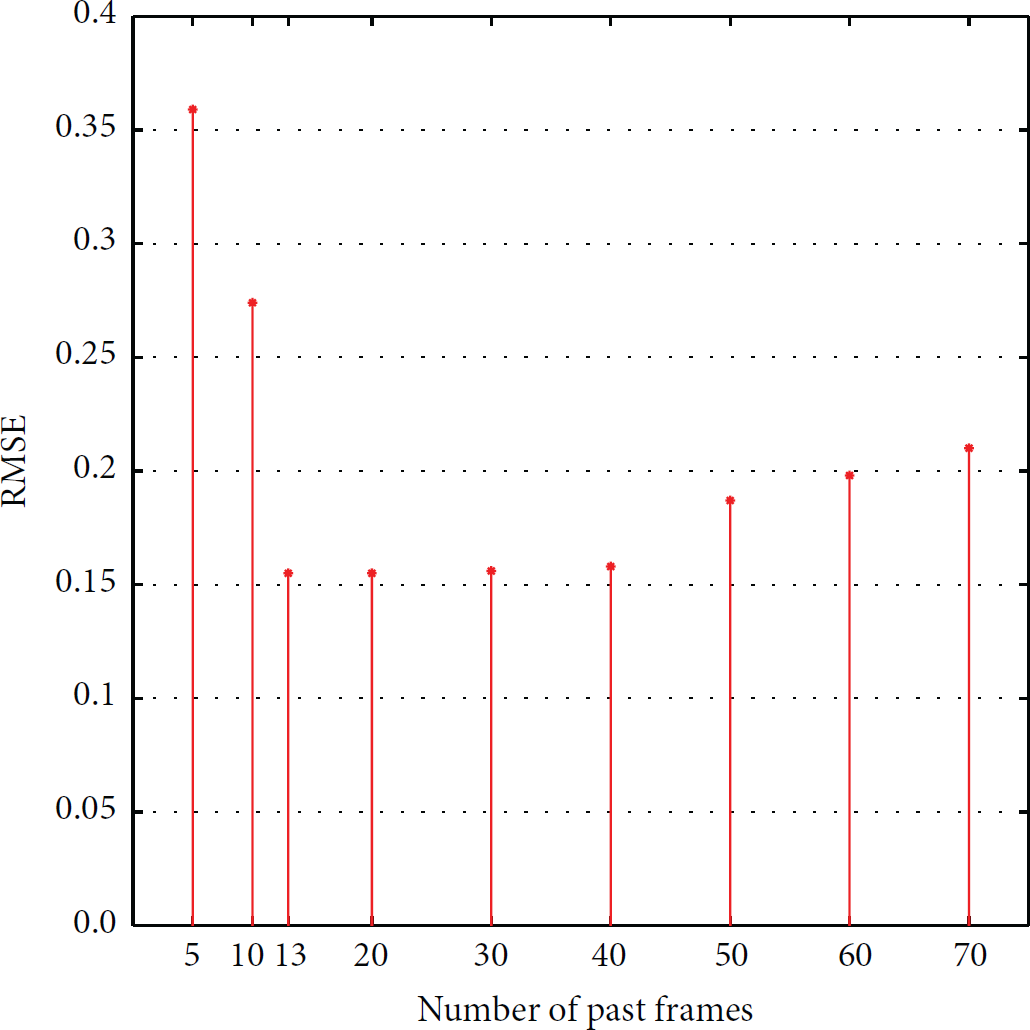
RMSE versus the size of sample data.

Convergence.
5.2. Estimation on Temperature
Error rate is compared among different algorithms on the original dataset where different sampling intervals are set, as shown in Figure 9. The spatiotemporal correlation of temperature is strong, so MASTER can obtain accurate relationships based on mining correlation rules. But a few of sensor nodes which are not associated with others will increase the estimation error, so its error is slightly larger than TSCA. As the sampling interval increases, temporal correlation of the sensor data weakens. TRECI and DESM use temporal correlation, so estimation error increases. However, the increase of DESM is slight because it also considers spatial correlation. The spatial correlation of the indoor sensor node in a short period of time remains substantially constant, so the sampling interval has little effect on AMR which only considers the spatial correlation. Particularly, TSCA takes the temporal and spatial correlation into account and assigns different weights according to the time series of data which makes newer data playing a more important role in the evaluation, so the size of the sampling interval has less effect on the results.
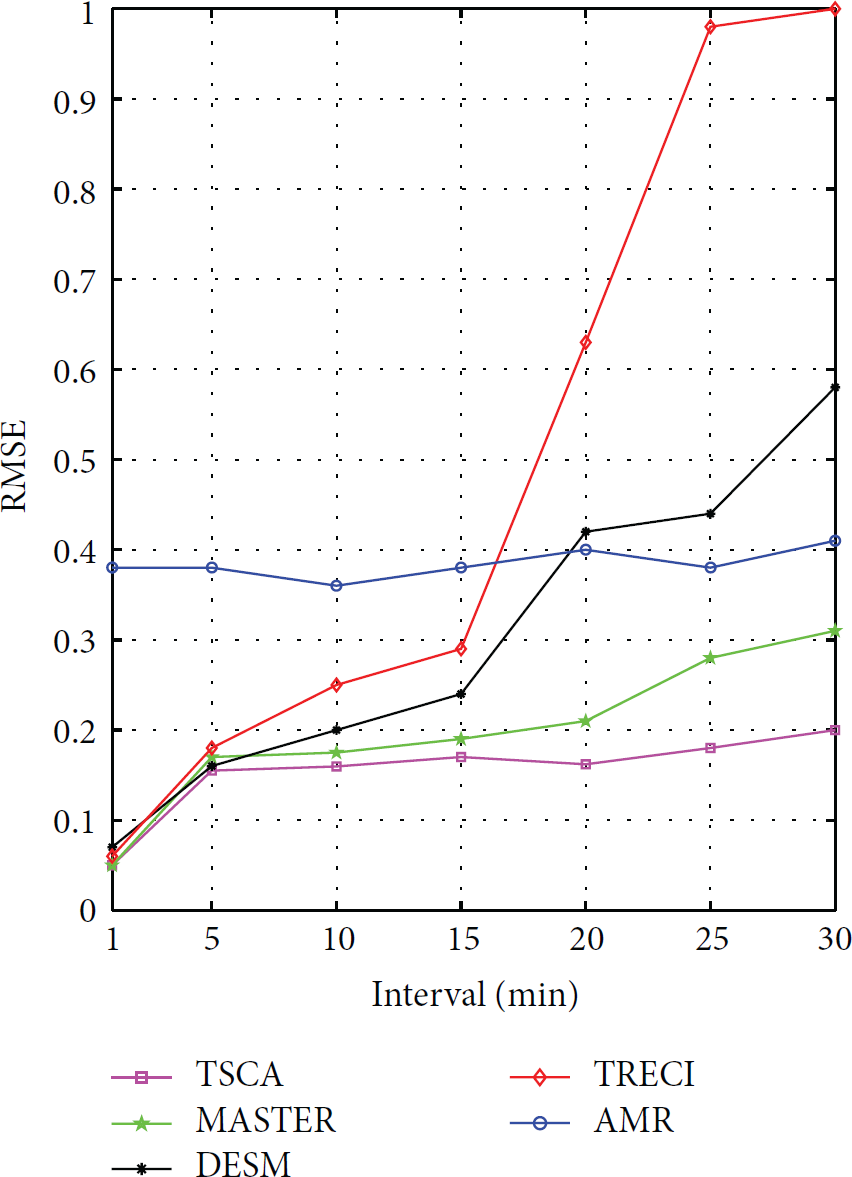
RMSE versus sampling interval on temperature.
According to [16], 23% of data are lost among 84,600 time slots (one month) of Intel Indoor dataset. Therefore, we conduct the error comparison among different algorithms where data missing rate is set as 5%–35% and the sampling interval is set as 5 min. Figure 10 shows that error of all the algorithms increases with the missing rate. This is because spatiotemporal correlation of sensor data will become weaker as missing rate increases. However, TSCA takes corresponding strategies based on the patterns of data loss as described in Section 4 which reduces errors greatly.
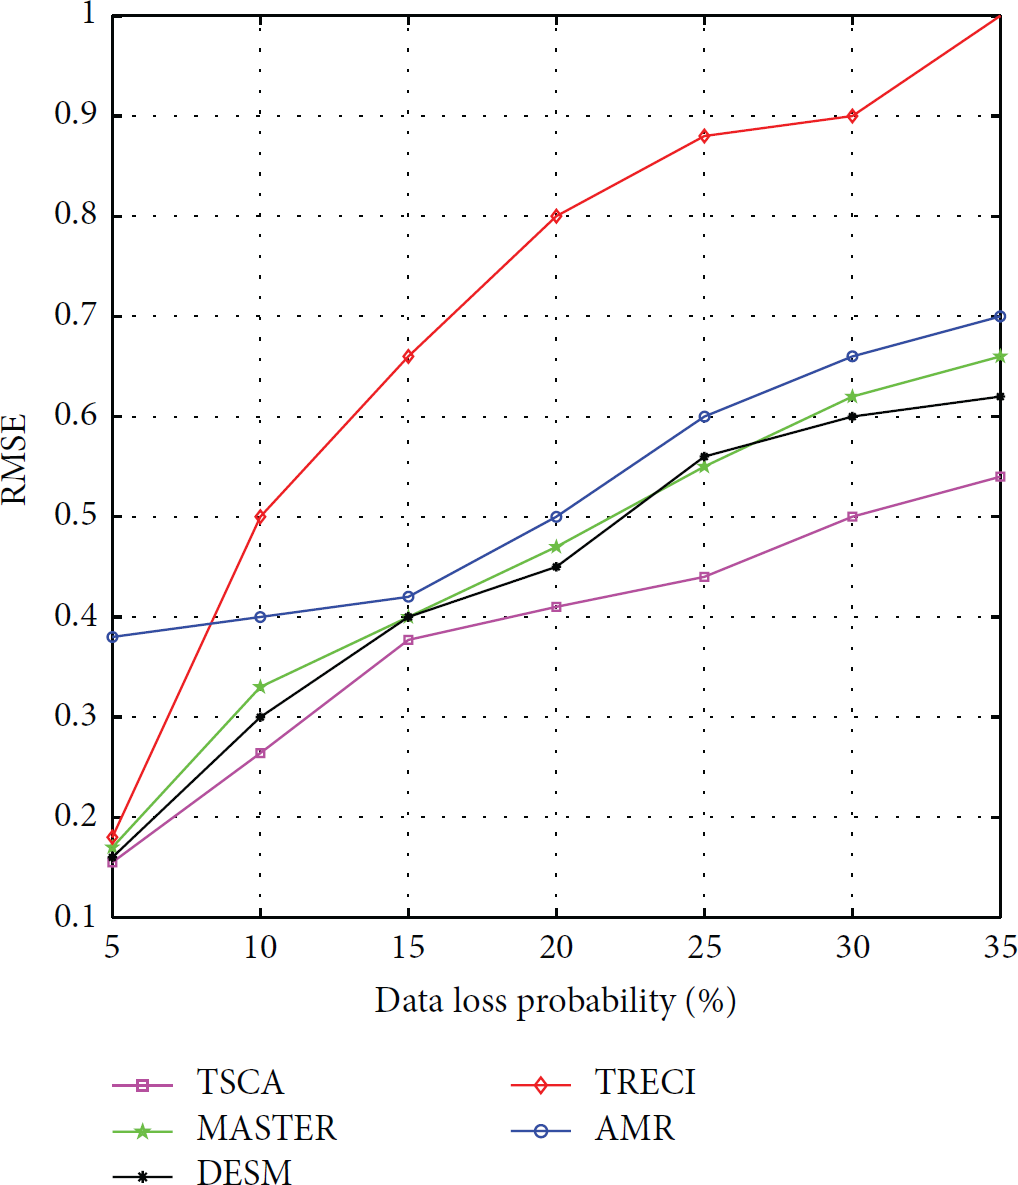
RMSE versus data loss on temperature.
5.3. Estimation on Humidity
Error of humidity estimation is compared among different algorithms on the original dataset where the sampling intervals are set as 1–30 min, as shown in Figure 11. Compared with temperature, spatiotemporal correlations of humidity are weaker, and the spatial correlation is much weaker than the temporal one. AMR is only based on the spatial correlation, so its error is maximal. Like temperature, temporal correlation of the sensor data weakens with the sampling interval increasing. TRECI is mainly based on temporal correlation so its error increases remarkably. When the sampling interval reaches 30 min, error of TRECI exceeds AMR algorithm's. Results of the other three algorithms are similar, but the error of TSCA is still the smallest.
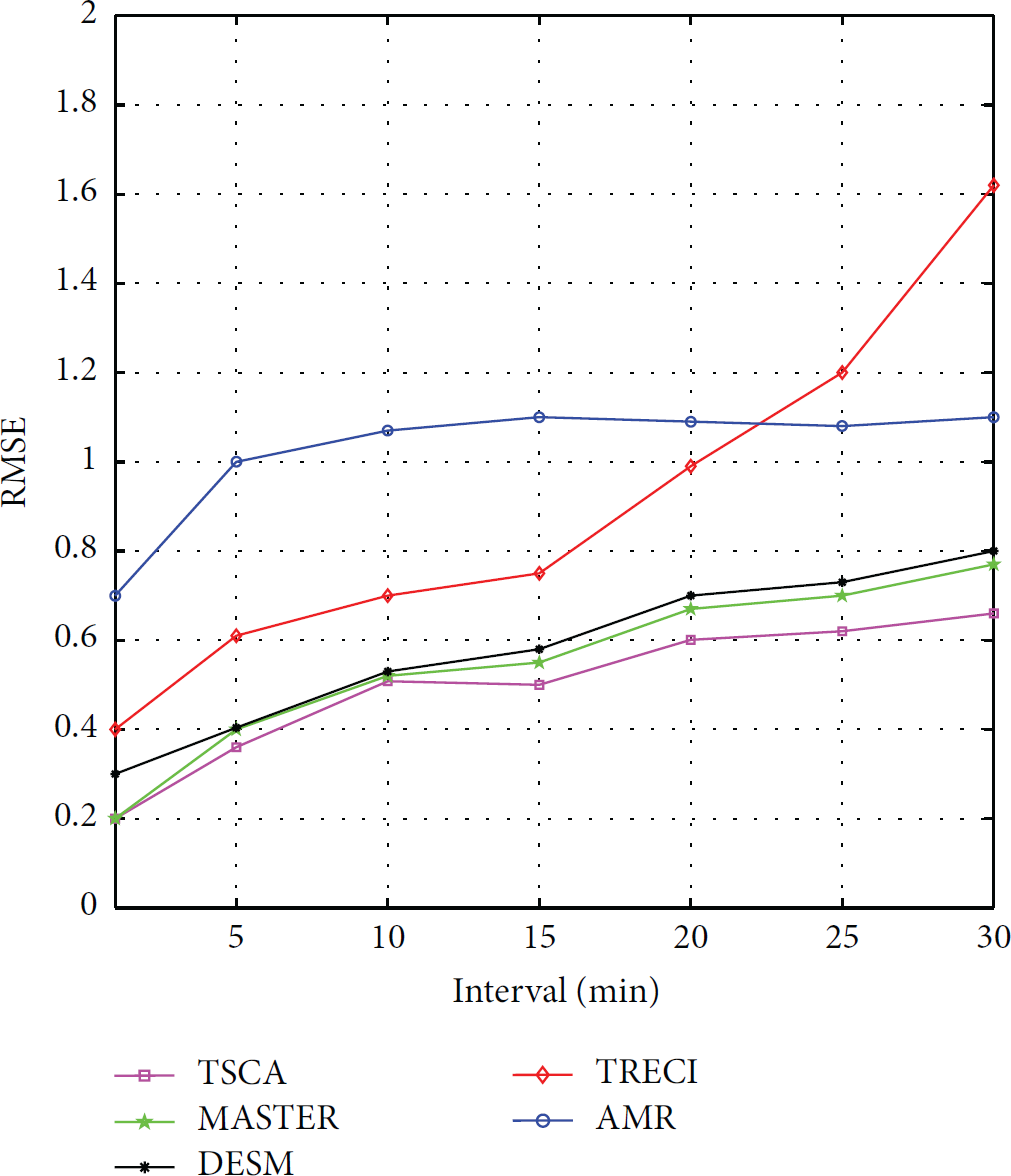
RMSE versus sampling interval on humidity.
Figure 12 shows error rate in the situation of different data loss probability. When loss rate is more than 20%, spatial and temporal correlations of humidity are severely affected and error rate of DESM, TRECI, and AMR surges. Loss rate has a greater impact on the temporal correlation, so error rate of TRECI increases more significantly. TSCA is mainly based on the latest data and the missing data in the sample have been processed, so its performance remains relatively stable.
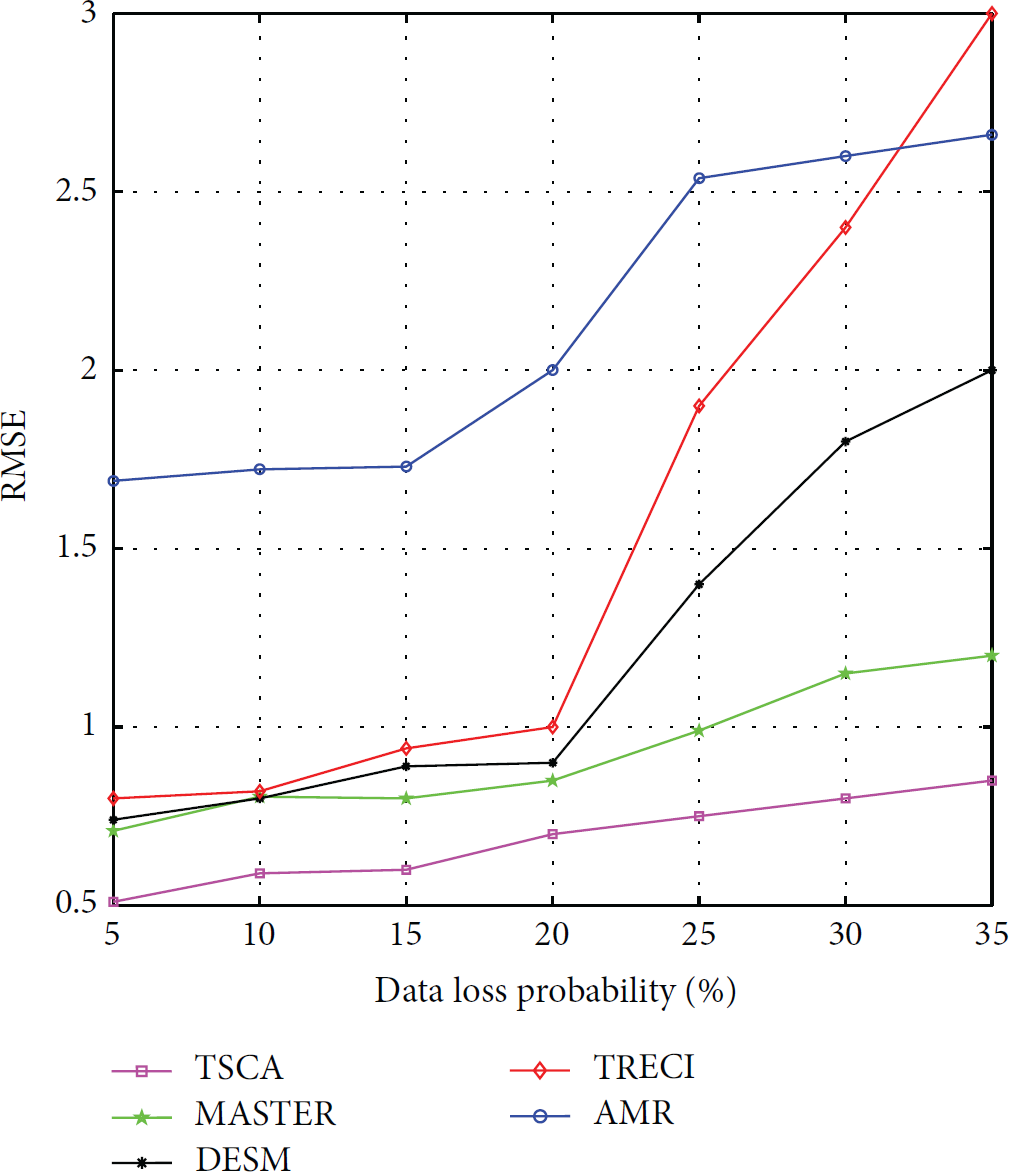
RMSE versus data loss on humidity.
6. Conclusion
Considering the deficiencies of the existing algorithms for missing data assessment, TSCA is proposed in this paper based on spatiotemporal correlation of sensor data. This algorithm selects the most relevant data as the analysis sample which ensures that there are no redundant sample data and the sample has the strongest correlation with the missing data. Thus, the efficiency and accuracy of this algorithm are significantly improved. What is more, a comprehensive analysis of the time and space is conducted to get estimation for missing data. Experimental results show that, no matter what the cases, TSCA always performs the best compared with other algorithms.
In the future, we can exploit the correlations between different attributes to further improve the accuracy of estimation; for example, light has an impact on temperature in many scenarios.
Footnotes
Conflict of Interests
The authors declare that there is no conflict of interests regarding the publication of this paper.
Acknowledgments
This paper is partly supported by the National Natural Science Foundation of China (61272515, 61121061), Beijing Higher Education Young Elite Teacher Project (YETP0474), and National Science & Technology Pillar Program (2015BAH03F02).