
Abstract
This paper offers a hybrid technique combined by artificial neural networks (ANN) and self-organizing map (SOM) as a way to explore factor knowledge. ANN and SOM are two kinds of pattern classification techniques based on supervised and unsupervised mechanisms, respectively. This paper proposes a new aspect to combine ANN and SOM as NNSOM process in order to delve into factor knowledge other than pattern classification. The experimental material is conducted by the investigation of street night market in Taiwan. NNSOM process can yield two results about factor knowledge: first, which factor is the most important factor for the development of street night market; second, what value of this factor is most positive to the development of street night market. NNSOM process can combine the advantages of supervised and unsupervised mechanisms and be applied to different disciplines.
1. Introduction
Since the technology of geographic information system (GIS) has been more popular and improved recently, how to apply suitable artificial intelligence (AI) algorithms with GIS that can assist researchers in solving their environmental problems is an important trend in urban-related domains nowadays [1–5]. There are two kinds of AI algorithm mainly discussed and applied in this paper: artificial neural networks (ANN) and self-organizing map (SOM).
ANN is a kind of AI technique based on the theory of neural science with useful advantages, such as the endurance of data noise, optimization and approximation, and great prediction ability [6, 7]. Because of these advantages, ANN has been applied to lots of comprehensive applications like land use changes [1, 2], regional labor market [8], traffic management [9], and regional economic activities [10], even though ANN has already been developed for quite a long time. Basically, ANN is a pattern classification technique based on supervised learning mechanism operated by statistic mathematics [7, 11]. Therefore, most of the ANN applications emphasized pattern classification performance. The discussion about the input factor analysis is still lacking because of the inherent limitation of ANN. The combination of SOM can bring out a new way for the issue of factor analyzing.
SOM also known as Kohonen map is another neural network technique based on unsupervised learning mechanism [12]. SOM is a kind of clustering technique which operated in dimensional space. The development of SOM is later than ANN but still has been widely applied in many research tasks like clustering data, monitoring process, and identifying particular pattern [13–16]. There are two important features of SOM: abstraction and visualization, which can make SOM unique clustering technique out of others [12, 17]. Depending on these two advantages, SOM not only can do clustering task but also can display the complicated distribution of data on limited dimensional space established by the assigned input factors. From this point of view, SOM can be seen as a kind of analyzing technique operated by specific input factors.
Overall, SOM can demonstrate data distribution through the assigned input factors with limited dimensional space, and then we can observe the density of data in order to learn where sectors of the limited dimensional space could be more sensitive to the assigned input factors after clustering process. However, because of the essence of unsupervised mechanism, there is no information about target pattern along the way of SOM procedure. Therefore, we do not have enough information to clarify these sensitive sectors which related to the assigned input factors that are positive or negative for particular pattern. On the other hand, the outcome value of ANN calculated by the process of supervised mechanism can indicate the tendency of target pattern in order to do pattern classification performance. But there is no such operation in ANN procedure that can assist us in displaying the detailed distribution of data by the assigned input factors and help us answer question like the following: what values of the assigned input factors could be more sensitive with target pattern? Hence, ANN and SOM are both lacking the ability to delve into detailed factor knowledge between the assigned input factors and target pattern traditionally. But the interesting thing is that the lack of ability of each one can be found out from the other one. That is the main motivation of this paper for combining ANN and SOM.
The main purpose of this paper is to combine the advantages of ANN and SOM in order to conquer the problems mentioned above. This paper offers an idea: look at ANN outcome as one particular input factor which can indicate the impact of target pattern and then use this ANN factor with other input factors to conduct SOM procedure. By doing so, we can perform the clustering process with the information of target pattern, and then deeply analyzing the correlations between the assigned input factors and target pattern can be possible.
As the notion mentioned above, this paper presents a combination technique of ANN and SOM named NNSOM as a specific factor analyzing process. In order to demonstrate the abilities of NNSOM, we practice an experiment related to urban space study. The experimental material is a kind of commercial development on the streets, Taiwanese street night market. The application of NNSOM can solve two questions after the experiment: first, which factor is the most important factor for target pattern; second, what value of this factor is most positive to target pattern. NNSOM process can combine the advantages of supervised and unsupervised mechanisms and be applied to different disciplines for exploring factor knowledge.
2. Methodologies and Techniques
2.1. Artificial Neural Networks (ANN)
ANN are well known as perceptron logic which derived from the imitation of human perception. The mechanism of ANN is like the function of our brain which can receive outside stimulation by neurons and then produce the best reaction by comprehensive consideration. For research application, the set of input factors is like the recipient part which can define and receive lots of information, then through a series of neural process to produce ANN outcome or pattern classification result [7, 11].
Normal ANN consists of three components. As Figure 1 shows, those are “input layer,” “hidden layer,” and “output layer.” Hidden layer is particularly a sensitive part among those components. Linear ANN refers to no hidden layer that has clearest correlation between target pattern and input factors, even though this model might not have well ANN performance. In contrast, nonlinear ANN refers to at least one hidden layer existing that can easily get higher ANN performance but lose crucial information between target pattern and input factors and that is the reason for why multilayer ANN is criticized as a kind of “black box” technique [18–20]. This paper emphasized delving into the detailed information between target pattern and input factors. Therefore we implement linear ANN as the reason for simplification in order to emphasize the abilities of NNSOM process.

The structure of ANN consists of input layer, hidden layer, and output layer.
Through supervised learning process, ANN can do pattern classification according to reality record. The reality record is so-called target pattern which is the standard for ANN output. Minimizing the deviation between ANN output and target pattern is the goal of ANN training iterations. The ANN outcome can be calculated by (1) after ANN training iteration:
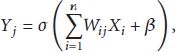
Normal ANN result is the performance of pattern classification transferred by the ANN outcome. Therefore ANN outcome can be seen as an indicator which can reveal the tendency of target pattern. By this aspect, we can do special factor analysis as we combine the ANN outcome into SOM.
2.2. Self-Organizing Map (SOM)
SOM or Kohonen map is based on unsupervised mechanism. The operation of SOM is conducted in dimensional feature space to process the distribution of data [12]. Normal SOM consists of two kinds of dimensional space; those are “the dimensional space of samples” which contains all samples recorded by their feature vectors and “the dimensional space of neurons” which contains all neurons with regular distribution. In addition, “the dimensional space of neurons” consists of two kinds of SOM vector layer; those are “SOM feature vector layer” and “SOM projection vector layer.” The number of dimensions in “SOM feature vector layer” is the same as “the dimensional space of samples.” But the number of dimensions in “SOM projection vector layer” can be any (normally using two dimensions for planar display). Figure 2 is the illustration for the concept and structure of SOM.

The samples recorded in the dimensional feature space of three dimensions for depicting the concept and structure of SOM.
SOM can do clustering task by competitive learning process. There are two kinds of neurons that can gain momentum to get closer to the objective sample in order to perform clustering result: BMU neuron and the neurons affected by “neighborhood effect” of BMU neuron [14, 16, 21]. For one neuron where the distance between itself and the objective sample is shorter than the other neurons, this neuron is the best matching unit (BMU). Besides BMU neuron, some other neurons whose positions are near to BMU neuron can be affected by “neighborhood effect.” We set a fixed radius centered by BMU neuron for the reason of simplification, if some other neurons within this radius can be affected by fixed “neighborhood effect.” BMU neuron and the neurons affected by “neighborhood effect” can change their positions for approaching the objective sample by the calculation of


Once finishing SOM procedure, the latest positions of neurons in “SOM feature vector layer” can be projected onto “SOM projection vector layer” for abstracting and visualizing the complicated distribution of samples. The demonstration of “SOM projection vector layer” can reveal which sectors have high density of samples by the assigned features. If we combine the ANN outcome into SOM as one kind of feature vector, then extracting the information from “SOM projection vector layer” with the information of target pattern can be possible. That is a unique concept of this paper compared to other applications of the combination of ANN and SOM.
2.3. The Unique Concept for Combining ANN and SOM as NNSOM
Some researchers have tried to combine the techniques of SOM and ANN for application research [22, 23], but this paper has different concept to combine both techniques. Most applications are applying SOM as a preliminary step of pattern classification. They often implement the clustering process of SOM to find out potential patterns first and then use these potential patterns as target patterns to conduct ANN for improving pattern classification performance. Thus, pattern classification is the main purpose of this sort of applications. In contrast, the main purpose of this paper is the application of factor analyzing by SOM mechanism; ANN is applied as a referential factor to indicate the impact of target pattern. Therefore, the operational steps in this paper are ANN procedure first and then SOM procedure in sequence. Because of the different motivation, this paper offers a unique concept to combine ANN and SOM as NNSOM process.
The features of SOM are clustering and abstracting the complicated distribution of data [12, 17]. The demonstration of “SOM projection vector layer” can extract detailed information with the assigned input factors. On the other hand, the ANN outcome can be seen as an indicator which can reveal each sample's tendency of target pattern. The concept of NNSOM is that if we use the ANN outcome as one kind of dimensional feature and operate with SOM in competitive learning process, then hire the ANN outcome and one objective factor as two feature dimensions to establish and demonstrate “SOM projection vector layer.” By doing so, we can deeply reveal detailed correlation between the ANN outcome and the objective factor. That means NNSOM process can explore detailed information between target pattern and the objective factor. Therefore, NNSOM can have the efficiency to delve into the detailed factor knowledge. For demonstrating the abilities of NNSOM, we practice an experiment in the following content.
3. Experimental Material and Operation Settings
The experimental material is Feng Chia night market, Taichung, Taiwan, which is a kind of Taiwanese night market developed along the streets around Feng Chia University. This kind of urban commercial phenomenon has some features like complexity, uncertainty, and being flexible and dynamic [24, 25]. The experiment is to investigate what environmental factors can affect a number of locations on the streets being occupied by informally commercial activities. The definition of informally commercial activities is various commercial activities or vendors occupying the locations of arcade, sidewalk, or road. These locations cannot be allowed to do any kinds of businesses by Taiwanese regulations, and this phenomenon is criticized as “out of place” generally [26].
The experimental area is set on the streets of Feng Chia night market, and the target pattern is the locations on the streets occupied by informally commercial activities. In order to define and record each location exactly, all the street areas have been transformed into lattice formation with GIS platform, as Figure 3 shows. Each lattice represents one grid-sample.

The distribution of target pattern recorded from reality; blue lattices are the grid-samples occupied by informally commercial activities, and they are the target pattern.
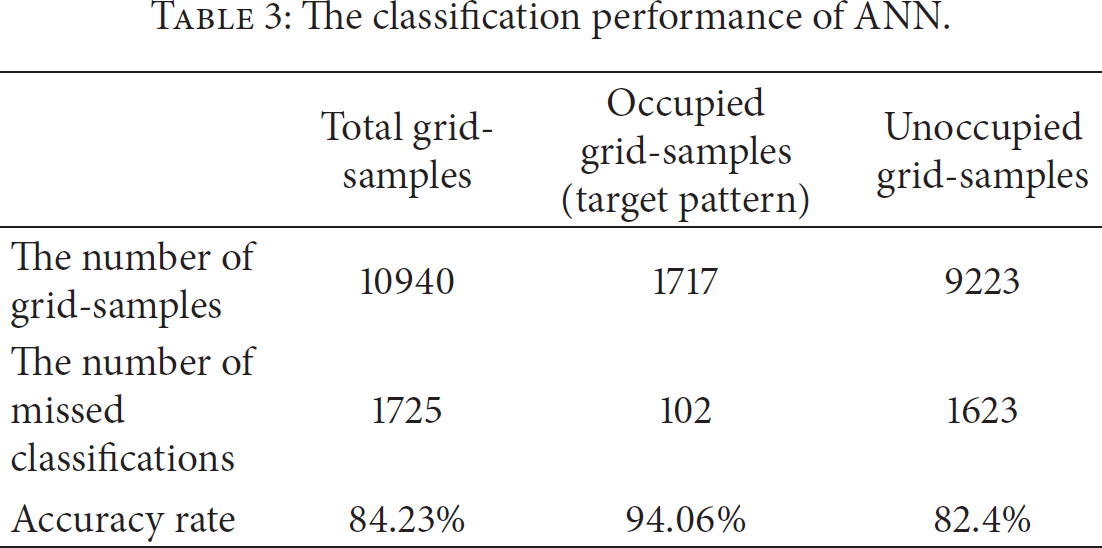
The number of grid-samples is 10940, and that contains 1717 occupied grid-samples (the target pattern) and 9223 unoccupied grid-samples. Each grid-sample is described by several environmental factors which derived from related literatures [26–29]. The descriptions of each factor are listed in Table 1, and all the factors have been dealt with through normalization by scaling of the range 0~1.
The descriptions of environmental factors.

The experiment consists of two experimental phases. The first experimental phase is ANN operation. In order to simplify the operation and focus on the purpose of factor analyzing, single-layer ANN is hired in this experimental phase. There are two results needed to be done in this experimental phase. The first result is to acquire the ANN outcome of each grid-sample, and this result can be calculated by (1). The second result is to find out which factor mentioned in Table 1 is the most important factor to affect the target pattern, and the second result can be done by analyzing the ANN weight values. All ANN experimental results in this experimental phase are then handing over to the second experimental phase.
The second experimental phase is NNSOM operation, which is mainly operated by SOM procedure and is including previous experimental results of ANN. There are eight features defined by the environmental factors of Table 1 and the ANN outcome for establishing the dimensional space of SOM. “SOM projection vector layer” is constructed by two-dimensional features which are the ANN outcome and the most important factor both derived from previous ANN operation. The formation of “SOM projection vector layer” is set by 35 × 35 grid formation; the vertical axis refers to the value of ANN outcome, and the horizontal axis refers to the value of the most important factor. Each SOM iteration is calculated by (2)~(4), and several SOM parameter settings are listed in Table 2. The next chapter is the results and discussions of NNSOM experiment.
Parameter settings of SOM.

4. Experimental Results and Discussions
4.1. The Results of ANN
The pattern classification performance of ANN is demonstrated in Table 3. Total accuracy is 84.23%. ANN procedure can derive the ANN outcome of each grid-sample as Figure 4 shows; dotted line is the classifying boundary; this boundary line is acquired by the average of 300 times of ANN performances. Any grid-samples where the ANN outcomes are above this boundary can be assigned as the target pattern.
The classification performance of ANN.

The result of ANN outcome.
We can observe the result of ANN weight values to evaluate which factor is the most important one for ANN conducting pattern classification. The ANN weight values of all factors are demonstrated in Table 4; checking this result in absolute value can figure out which factor is the most important one. If one factor has higher ANN weight value, this factor is more important for pattern classification [6, 7]. As Table 4 shows, the highest ANN weight value is “GL”; that means “GL” is the most important factor to assist ANN in judging some grid-samples as the target pattern. The next experimental phase of NNSOM can derive more detailed information between “GL” and the target pattern.
The ANN weight values of each factor.

4.2. The Result of NNSOM
According to the previous result of ANN, we can then do advanced factor analyzing by NNSOM process. Because the most important factor is “GL,” “SOM projection vector layer” has to be established by the ANN outcome and “GL” in order to dig out detailed factor information. The final result of “SOM projection vector layer” is demonstrated in Figure 5(a); the crosses are the latest positions of neurons, and the additive circles are the marks for denoting specific neurons that are surrounded by at least 1000 grid-samples within the radius of

The demonstration of detailed factor analysis by NNSOM.
There is a graphically statistic figure bar chart hired in NNOSM phase for analyzing detailed information between “GL” and the target pattern, as Figure 5 shows. The dotted line in Figure 5(a) is the ANN classifying boundary which is the same as the previous description of Figure 4. There are two bar charts: “bar chart 1” demonstrates the correlation between the “GL” value and the number of cluster centers below the ANN boundary line and “bar chart 2” demonstrates the correlation between the “GL” value and the number of cluster centers above the ANN boundary line. Particularly for “bar chart 2,” this figure can determine what value of “GL” can be most positive to the target pattern with the distribution of cluster centers upon the ANN classifying boundary. As Figure 5 shows, the result of bar chart 2 can reveal that the most positive value of “GL” for the target pattern is 0.58. That means if one grid-sample's “GL” value is closer to 0.58, this grid-sample should have higher tendency to become the target pattern.
“GL” factor refers to different grid-sample locations on the streets having different levels of informally commercial attraction. The setting of “GL” values and descriptions is listed in Table 5, and 0.58 is close to the sixth “GL” level. This analyzing result can reveal that this kind of street location should have higher attraction for informally commercial activities than other “GL” conditions. This result can give researcher detailed implication for better understanding of this specific phenomenon. The analyzing process of NNSOM can apply to analyze other environmental factors as well for deeply exploring the detailed factor knowledge.
The description of GL factor setting.

5. Conclusion
Computational modeling can assist researchers in simulating the research objective in order to learn the possible trend with deductive logic. ANN and SOM are two kinds of computational modeling techniques that have different concept to do pattern simulation. How to get higher simulating accuracy when applying these two computational techniques is always the important issue; but factor analysis is still lacking to discuss even though there is a lot of potential information hidden in factor assumption that can be revealed by efficient way of factor analyzing. Offering a combination of ANN and SOM for the application of factor analysis is the main purpose of this paper.
ANN belongs to supervised mechanism, and the main feature of ANN is the orientation of target pattern. SOM belongs to unsupervised mechanism, and the main feature of SOM is abstraction and visualization of data distribution by the assigned input factors. This paper offers a unique concept to combine ANN into SOM as NNSOM process; that is using the ANN outcome as one of the SOM input factors which can indicate the impact of target pattern and then doing SOM competitive learning process. The result of NNSOM can display clustering result with one objective factor and the ANN outcome, and then analyzing sectors with high density of data distribution can deeply reveal detailed correlation between the objective factor and the ANN outcome. Therefore, the application of NNSOM can solve two questions related to factor knowledge: first, which factor is the most important factor for target pattern; second, what value of this factor is most positive to target pattern. Because of the unique concept to combine ANN and SOM, NNSOM can implement factor analysis for extracting potential information other than pattern classification.
This paper practices an experiment for demonstrating the abilities of NNSOM. The experimental material is the phenomenon of street night market, and the target is to analyze a number of locations on the streets occupied by informally commercial activities. The experiment contains two experimental phases: the first one is ANN operation, and the second one is NNSOM operation. The first experimental phase can derive two experimental results: the ANN outcome of each sample is the first result; and the second result is that “GL” is the most important factor for the development of informally commercial activities along the streets. Through the analysis of “SOM projection vector layer” established by the ANN outcome and “GL” with bar chart in the second experimental phase, the most positive value of “GL” for the development of informally commercial activities along the streets is 0.58. This result can reveal detailed information about which kinds of locations on the streets can have highest attraction for informally commercial activities gathering. As the experimental demonstration, NNSOM can exactly extract detailed factor knowledge for better understanding of research objective.
Footnotes
Conflict of Interests
The authors declare that there is no conflict of interests regarding the publication of this paper.
Acknowledgments
This research is funded by “The Fund of Scientific Research Projects for Introduction Talents, Huaqiao University” (Project no. Z14Y0009), and The Education Department of Fujian Province (Project no. JA15031).