
Abstract
Radio Frequency Identification (RFID) is a solution for automated inventory and object detection applications. However, if RFID tags are attached to metal objects, detection errors may occur due to Foucault currents and interferences caused by multiple simultaneous reflections. Errors may increase if metal objects are moving. The paper presents a novel algorithm using RFID low-level reader variables, such as RSSI (Received Signal Strength Indicator), phase angle, and Doppler shift, to detect and trace metal objects. The algorithm was designed to identify if a tag is static or moving and, in the latter case, to compute its speed and direction. The algorithm differs from previous approaches since it uses a simple setup with one commercial portal reader coupled with one single element antenna. Experiments employed one tag located on one metal moving object and 12 static interferer tags, in both outdoor and indoor locations. Results show that the algorithm identifies static tags with no errors. For moving tags, the algorithm shows a maximum 12% error. The algorithm correctly estimates direction and computes object speed. Test conditions emulate fork lift speeds when carrying objects in an industrial warehouse.
1. Introduction
Passive RFID systems employ Ultra High Frequency (UHF) band, between 860 MHz and 960 MHz. They allow object identification in a cover area without requiring direct line of sight. However, UHF RFID system performance may be affected by propagation environment, by RFID reader parameters, and mainly by tag characteristics [1]. Performance may also decrease when tags are located over moving metal objects [2] in areas with high density of static tags. The latter situation degrades antenna gain and impedance match between the RFID Chip and the antenna [1].
When using UHF, metals reflect radio energy transmitted by the RFID reader obstructing the detection process [3]. Additionally, electromagnetic waves induce Foucault currents in conducting surfaces, with opposite fields to the transmitter. The situation attenuates and may cancel the electromagnetic field required for reader-tag communication [2].
If an industry uses RFID to complete an inventory, the system should be able to determine whether the shipment is entering or leaving a gate, or if tags are moving or static. Without this information, the system may compromise reliability of the inventory process. Therefore, addressing this issue is a must for industrial productive processes based on RFID technology.
On the other hand, when the target object is moving, time required to identify it is limited. The object may abandon the cover area without identification, due to interference of static neighbor tags [4, 5]. The phenomenon, where other RFID tags are detected but the target is not, occurs also with static tags, and it is known as “the hidden tag problem” [6]. All these circumstances are relevant for industries that store, transport, and ship metal objects and require automating inventories.
Although an object with an RFID tag moving towards the reader should ideally have increasing RSSI values, in most cases the task of classifying moving and static tags is not that easy [7]. In fact, RSSI data collection of gathering cycles demonstrates how difficult it is to identify moving tags, especially due to random variations, up to 22 dB [7]. Given this fact, RSSI by itself does not allow adequate estimation of speed and distance.
This paper presents a new algorithm based on an experimental method, for detecting a moving metal object, estimating its direction and speed. The algorithm also traces the object: that is, it estimates the object distance from a reader at different times. The algorithm employs multiple radiofrequency variables. The main contributions of this paper are as follows:
Unlike other solutions implemented with nonsingle element antennas [8], the proposed algorithm uses a simple hardware setup with only one directive, circular polarization antenna. To the best of our knowledge, this is the first multivariable algorithm employed for detection, tracing, and speed estimation of different metal objects (cylinders and sheets) moving through one portal. The algorithm was tested in both indoor and outdoor scenarios.
The rest of the paper is organized as follows. Section 2 presents related work in RFID over metal and detection algorithms. Section 3 describes the experimental algorithm employed for analyzing radiofrequency variables and determining appropriate thresholds. Section 4 describes test and results. Section 5 concludes the paper.
2. Related Work
The literature presents different techniques for distance or motion estimation using RFID. Examples include three-side approach [9], Direction of Arrival (DOA) [10–12], propagation variables such as RSSI levels [10], and measurements of phase angles [13, 14]. Nevertheless, these works employ more than one single element antenna, and they do not include moving metal objects.
One example study employs lab experiments and simulations with one UHF passive RFID system. The research estimated speed and position of one tag going “In” and “Out” of the cover area. However, the model only includes interference from the indoor test area. Additionally, the study uses two antennas for movement characterization of nonmetal objects [15].
Research has employed other variables such as RSSI, phase angle rotation, and Doppler frequency shift to estimate tag speed in a bidirectional flow of objects in a warehouse. Tests used indoor and outdoor scenarios. Nonetheless, the study employs a four-antenna array located on the warehouse roof. Additionally, the paper does not include traceability of metal moving objects [8].
The study in [7] describes a system that tracks pallets leaving and entering an RFID portal as part of a warehouse management system. The main focus of this research was the control of false positive RFID tag reads, that is, tags unintentionally read but not interesting to the system. As a consequence, false positives make it difficult to distinguish pallets intentionally loaded onto the trucks and tags that appear in the reading field by accident. However, in the scenario described in [7] the use of RFID tags on shipments transporting metal objects was not discussed. Moreover, the study exclusively uses RSSI information.
Another study performs a time analysis of recorded readings to differentiate between static and moving tags. The study developed a method using RSSI, phase angle, and Doppler frequency. The method detects if a tag is static or moving by using the average value of Doppler frequency. Nevertheless, the study does not compute position of moving tags in an indoor scenario. Additionally, the work does not include metal surfaces [16].
Regarding RFID over metal surfaces, different studies show that UHF passive RFID tags require a dielectric separation from conductive materials for proper operation [4, 5]. The work in [17] recommends a distance greater than or equal to 2 centimeters (cm) for any transmission power.
Another research analyzes changes in properties and electrical parameters of an UHF passive RFID tag when moving closer to a metal surface [18]. The research proposes special antenna designs for RFID applications over conducting objects. The study in [19] shows similar results.
One example application of UHF passive RFID system in metal objects is used in [20] to identify pharmaceutical products packed in metal, glass, and plastic. Products move in a conveyor belt with programmable speeds between 0 m/s and 0.66 m/s. However, the system employs two reading antennas, one at each side of the belt.
3. Materials and Methods
The proposed algorithm was developed by using an experimental method, performing intensive tests with one Impinj Speedway Revolution R420 portal reader [21], one LAIRD Technologies circular polarization antenna [22], and ShortDipole passive RFID tags [23] located over metal objects. The system works in the 902–928 MHz band [24]. The reader used 30 dBm transmission power. Tests employed different environments and two types of metal objects: cylinders (30 cm diameter, 1 m length) and galvanized sheets (1 m length, 0.7 meters wide). The main goal is to determine if the object is moving, its direction, and speed. The algorithm defines one out of two possible directions: towards the portal (“In”) or away from the portal (“Out”).
Figure 1 shows the algorithm. This section details each one of the steps.

Detection algorithm.
3.1. RFID Tag Detection and Variable Measurement
The algorithm includes a procedure similar to an inventory, where the reader is transmitting signals and registering the retransmitted signals from the tags during a specific time.
The algorithm obtains three radiofrequency variables by using LLRP (Low-Level Reader Protocol) [25]. The three variables are Received Signal Strength Indicator (RSSI), phase angle rotation, and Doppler frequency shift. Since RFID passive systems use Frequency Hopping, the algorithm obtains all variables for each channel at the end of the inventory. The system uses 50 channels with 500 kHz each [21]. Since every frequency hop takes 300 milliseconds, the system finishes one sweep in 15 seconds.
3.2. Variable Processing
Figure 2 shows the initial process of each variable. The algorithm registers significant phase or RSSI changes with counters. The counters help to determine if a tag is static or moving.

Variable processing.
The first variable is phase change,

Since it is not possible to know all values in (1), the research performed indoor and outdoor experiments for detecting metal objects in portals with ranges up to three meters. Using results and phase analysis, the research found empirical thresholds for determining whether an object is moving or not.
Figure 3(a) shows behavior of phase angle of static tags for indoor environments. Phase variation in Figure 3(a) is due to the system employing Frequency Hopping. As a consequence, each reading is detected through a different channel. Temporal analysis of the data is complex; thus, the research computed instant phase variation by using information in two consecutive detections. Figure 3(b) shows these results.

Consecutive detections in static tags.
Figure 3(b) shows that average values of phase differences gather around 0 radians. Even though most values are between
To determine the proportion of values outside [
Tests computed the number of times a large variation occurs, given by φ_cnt in Figure 2, out of the total number of detections. Figure 4 shows average values for the 10 repetitions with 95% confidence intervals for each distance.

Average proportion of large variations with 95% confidence intervals, static tag, and indoor environment.
Figure 4 illustrates that, at 30 dBm power, the proportion of large variations is below 30% regardless of distance between reader and static tag. The research tested movement and found that proportion of large variations is always above 30%, regardless of speed. This value may be significant in identifying a static and a moving tag. Hence, the research tested the same two metal objects moving at different speeds and measured the proportion of large variations with 10 repetitions. Figure 5 shows average values with 95% confidence intervals, for In and Out directions in the indoor scenario.

Average proportion of large variations in phase, indoor scenario.
Figure 5 shows that all values for moving objects are above 30%. As a consequence, the algorithm established 30% as the threshold for proportion of large variations. If a tag is below 30%, it is defined as static. Otherwise, it is a moving tag.
The second variable presented in Figure 2 is RSSI. Initially, the algorithm computes the RSSI range as the absolute value of the difference between the maximum and minimum RSSI values,
In order to estimate this threshold, the research evaluated RSSI results from the previous test with moving metal objects. Figure 6 shows the RSSI range values with 95% confidence intervals.
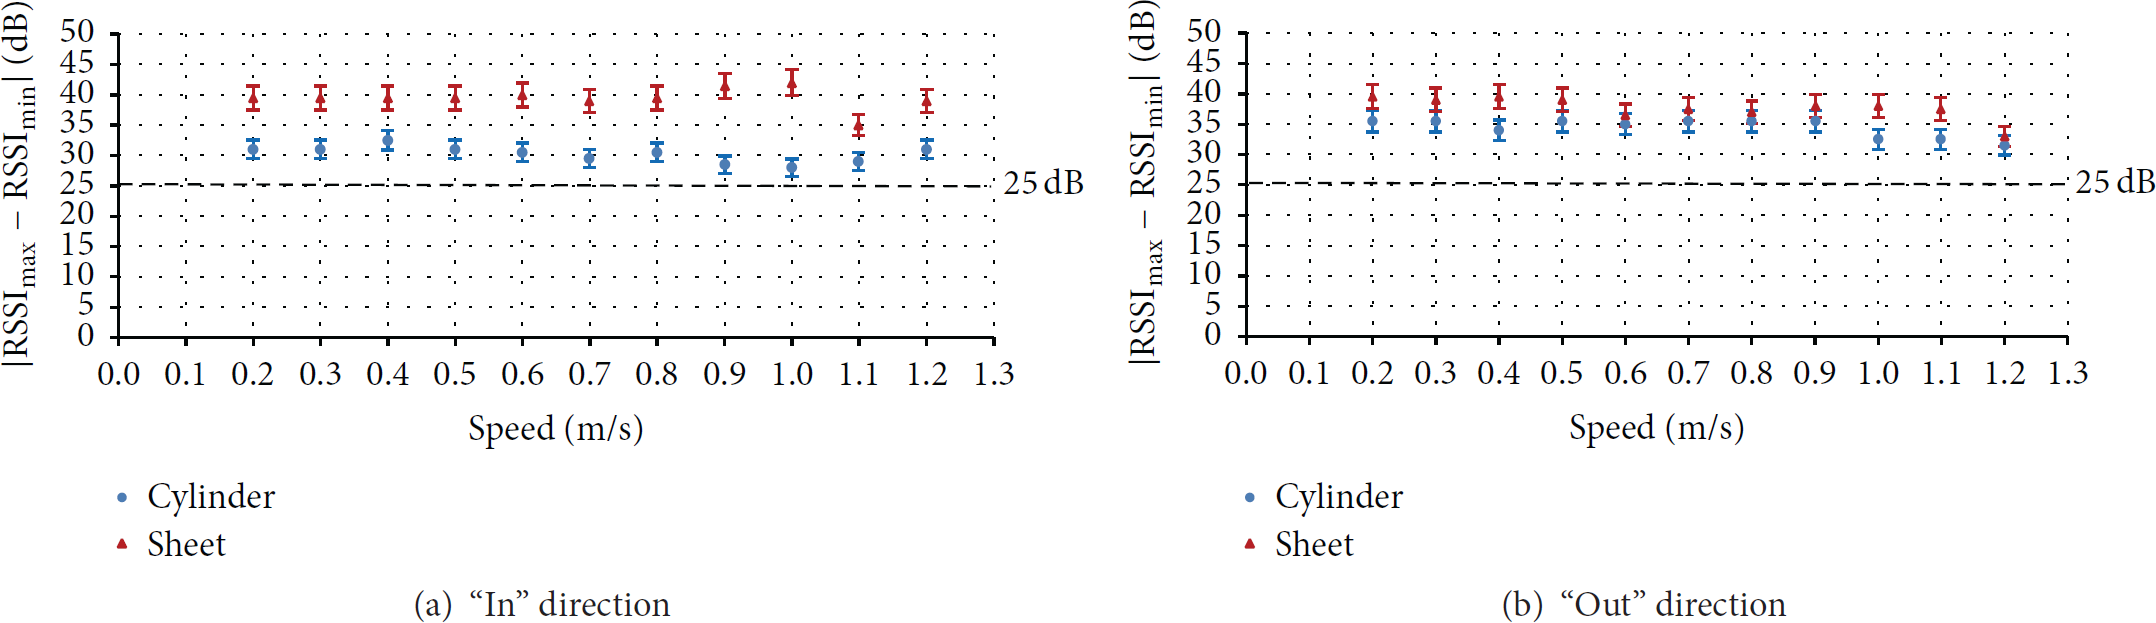
RSSI range values.
According to Figure 6, all RSSI ranges are above 25 dB. Therefore, the algorithm establishes moving tags as those with RSSI ranges above 25 dB.
The algorithm performs another step with RSSI: counting the number of changes in consecutive RSSI measurements for the same label. Impinj R420 reader measures RSSI with 0.5 dBm resolution [21]. Therefore, the algorithm counts one change if the difference in RSSI is greater than 0.5 dBm. The percentage of RSSI changes is computed as the ratio of the total number of changes, given by RSSI_cnt in Figure 2, to the total number of RSSI values measured. Figures 7(a) and 7(b) show results of percentage RSSI changes for the two different metal objects with 95% confidence intervals, in indoor scenario.

Percentage RSSI changes.
Figures 7(a) and 7(b) show that all values are above 50%. Therefore, the algorithm sets 50% as a threshold for distinguishing a moving tag from a static tag (below 50%).
3.3. Voting System
This step in Figure 2 compares the values of the three variables to each one of the thresholds. The first comparison verifies if percentage of RSSI changes is greater than or equal to 50% (Thr1). The second comparison determines if the RSSI range is greater than or equal to 25 dB (Thr2). The last comparison establishes if percentage of large variations in phase angle is greater than or equal to 30% (Thr3). If two out of three of these comparisons are true, the algorithm defines that the metal object is moving and proceeds to estimate speed and direction.
3.4. Direction of Movement
Recall that RSSI may provide an idea of movement direction, but values are highly random. Thus, the algorithm improves decisions by employing Doppler frequency. The algorithm computes instant speed

Finally, the algorithm traces the object by computing the difference

4. Results and Discussion
4.1. Algorithm Execution Example
This subsection illustrates algorithm behavior with a preliminary experiment using a metal object moving at certain speed and then stopping during an observation window of 15 seconds. The algorithm must classify one tag in either “static” or “moving” and the tag direction as “In” or “Out.” All results in Section 4 were similar for indoor, outdoor, metal cylinders, and sheets.
Figure 8 shows results in the case of a metal sheet moving at 0.2 m/s in an outdoor environment, towards the sensor (In).
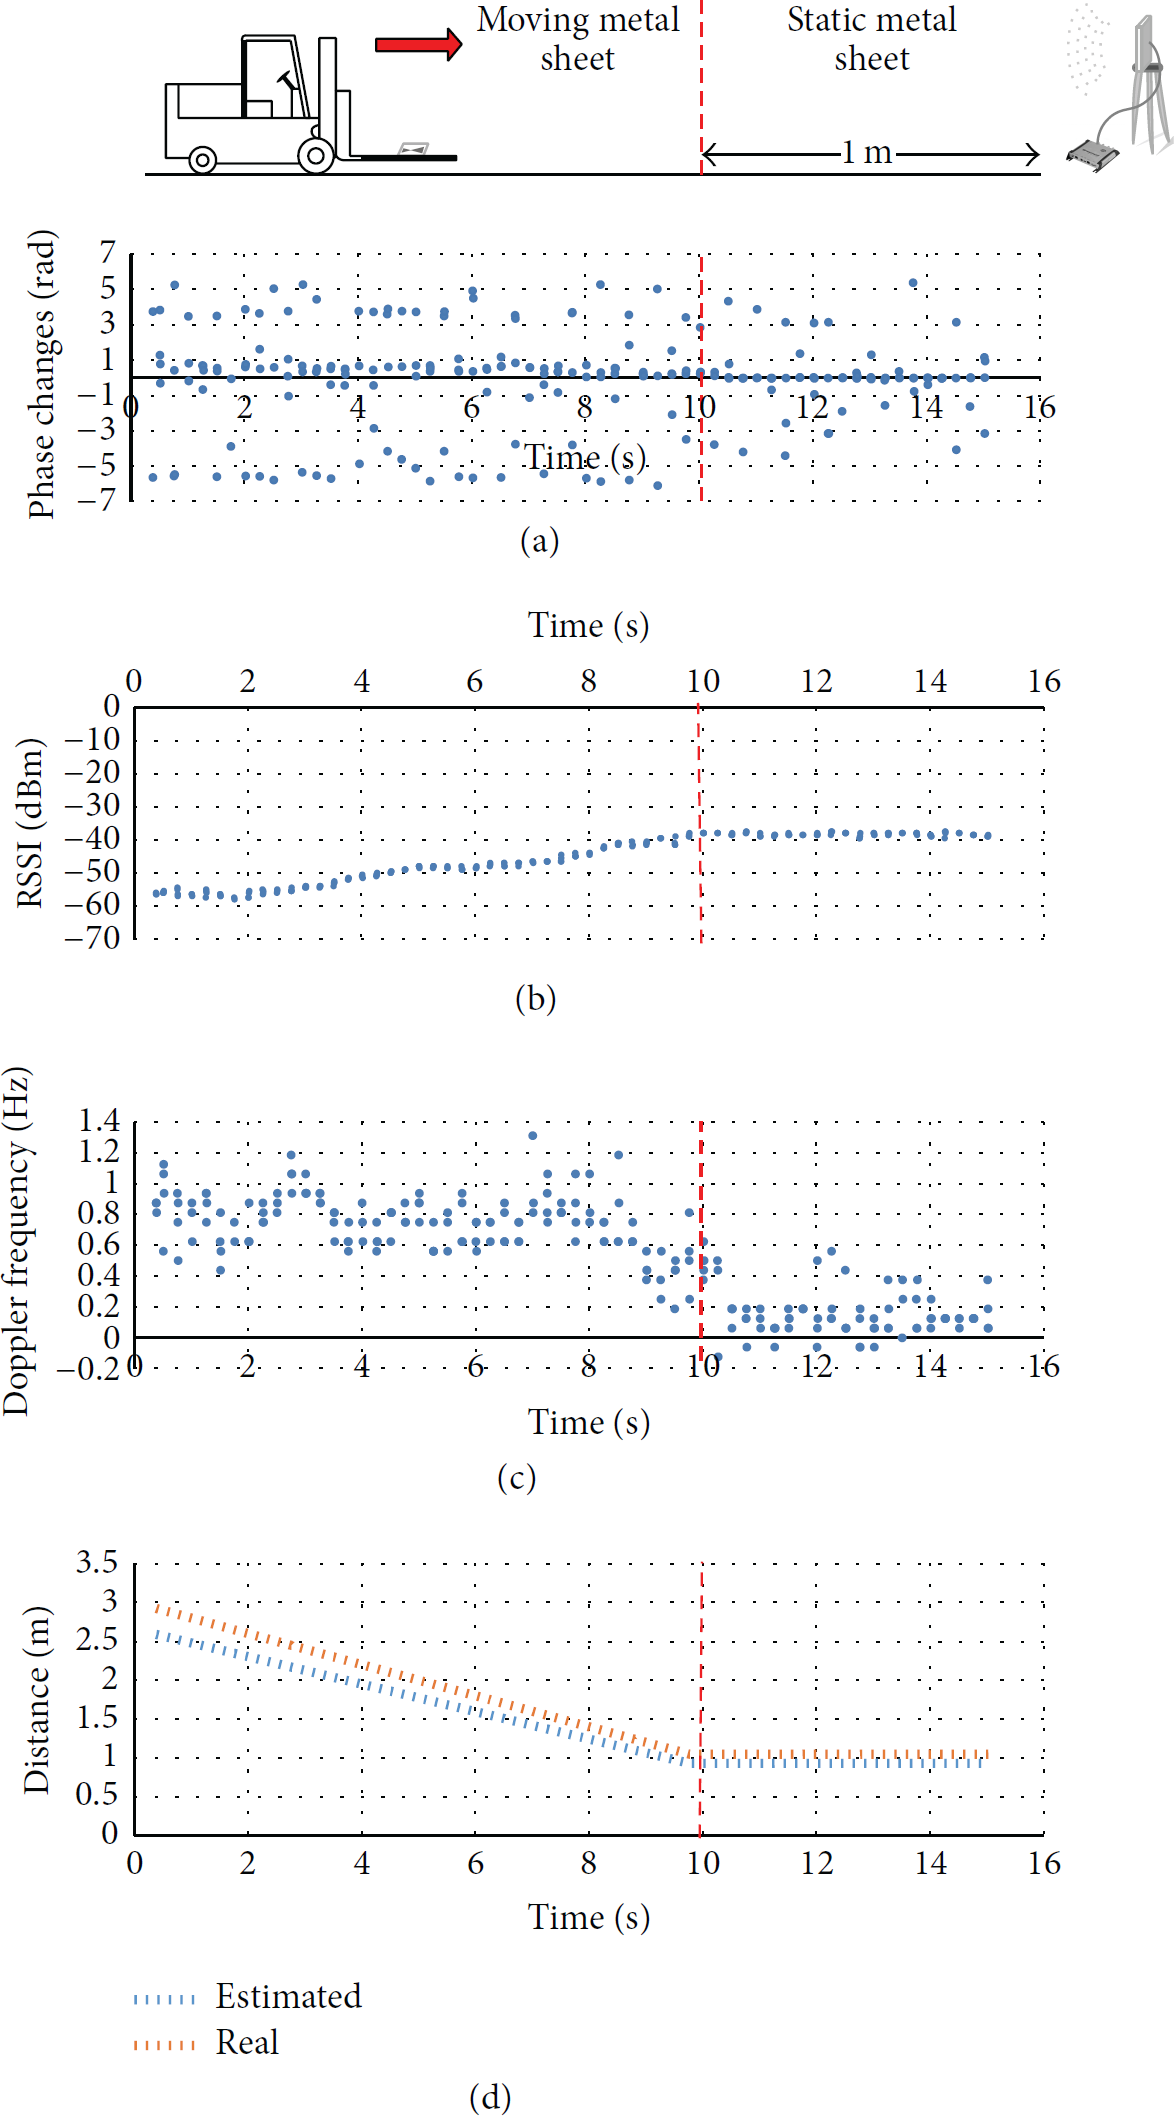
Variable behavior during algorithm execution. (a) Phase changes over time, (b) RSSI values, (c) Doppler frequency values over time, and (d) real and estimated distance.
Figure 8(a) shows phase changes over time. Figures 8(b) and 8(c) show RSSI levels and Doppler frequency levels, respectively.
Figure 9 shows threshold values, obtained from the decision variables calculated in the earlier steps. During this test, the percentage of RSSI changes went from 68.2% at time
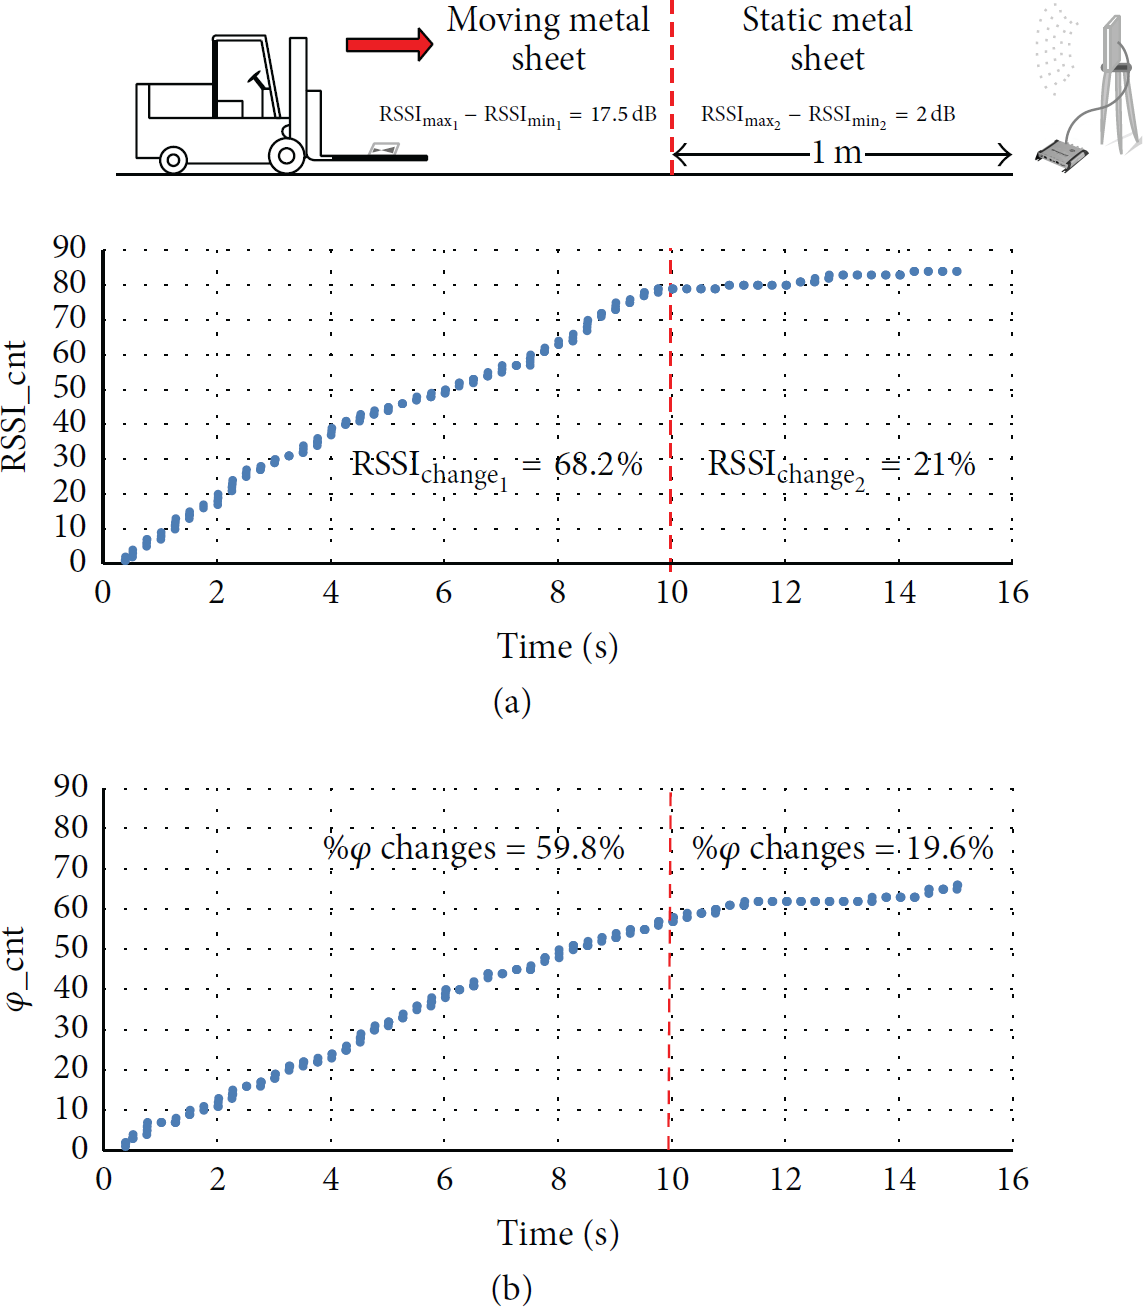
Variable counters behavior during the algorithm execution. (a) Percentage of RSSI changes and (b) percentage of large variations in phase angle.
However, Figure 9 shows that RSSI ranges are 17.5 dB before 10 seconds and 2 dB after this time value. Both values are below the 25 dB decision threshold and this could mean that during the period of time from 0 s to 10.002 s the RFID tag remained static when in fact it was not.
The algorithm resolves this conjuncture with a Voting System which requires fulfilling a minimum of two out of the three conditions to decide that the tag is moving. Therefore, the algorithm recognizes the percentage of RSSI changes and the proportion of large phase angle variations as sufficient information to determine that the object is in motion.
The vertical red dotted line in Figures 8 and 9 represents the moment when the RFID tag changed from moving to static. The RFID tag stopped at 1 m distance from the reader antenna.
On the other hand, in order to determine whether the metal object direction is In or Out, the algorithm uses Doppler frequency. In this particular experiment, as it is shown in Figure 8(c), Doppler frequency values remain concentrated around 0.768 Hz for the first 10.002 seconds. From that moment on, frequency values vary around 0.15 Hz. Therefore, the algorithm determines that the object direction is “In.” Based on this information, the speed of the metal sheet and its position are estimated using (2) and (3). Figure 8(d) shows the final result of traceability estimation.
4.2. Results
Tests employed one tag located on a mobile metal object. Test environment included three static metal sheets with four tags on each one. Therefore, there is one target (mobile) tag and 12 interferer (static) tags. Figure 10 shows an upper view diagram of the test scenario.
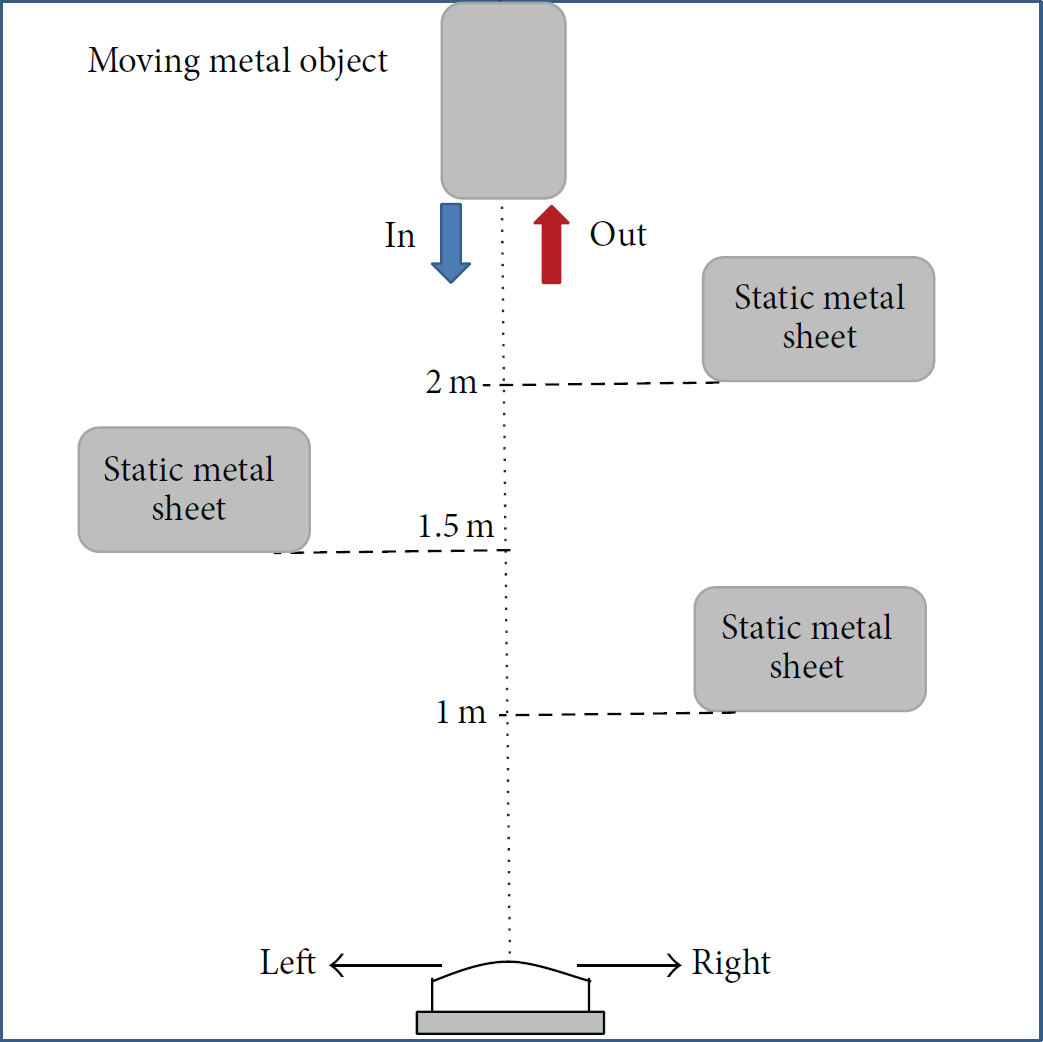
Upper view of the test scenario. Distances are in meters.
Tests used three metrics:
percentage of correct readings: moving tags detected as moving tags, percentage of false positives: static tags detected as moving tags, percentage of false negatives: moving tags detected as static tags.
Experiments employed five speeds between 0.2 m/s (meter per second) and 1 m/s, in 0.2 m/s steps. The speeds correspond to a fork lift moving objects in an industrial warehouse.
The mobile sheet was tested in both directions “In” and “Out,” in two environments: indoor and outdoor. Test employed 10 repetitions for each case. Percentage of false positives was 0% in all cases. Maximum percentage of false negatives was 12%.
According to Figure 11, correct detections show no statistical difference at 90% confidence levels when comparing different movement directions, excepting 0.8 m/s speed. Therefore, the algorithm works essentially in the same way, regardless of movement direction for indoor conditions.

Percentage average correct detections for indoor environments with 90% confidence intervals.
Figure 12 shows Mobile Tag Detection in outdoor environment. Percentage of false positives was 0% in all cases. Maximum percentage of false negatives was 11%. Same as in the indoor case, Figure 12 shows no statistical differences at 90% confidence levels when comparing In and Out directions.

Percentage average correct detections for outdoor environments with 90% confidence intervals.
Since percentage of false positives was 0 in all cases, the proposed algorithm correctly identifies static tags in metal sheets located in the cover area, up to 2 meters.
Correct detections are always above 88% for both environments. The result guarantees proper detection in industrial warehouse applications where fork lifts move metal objects.
Additionally, tests verified speed results from the algorithm in the experiments. Table 1 shows results for indoor environment.
Comparison of speed results computed by the algorithm.

Table 1 shows the algorithm correctly detected direction of movement in all tests, as shown by the positive and negative signs in speed computations. Error seems to increase with speed. However, speeds smaller than 1 m/s present maximum 28% error, providing an adequate estimate for the same application mentioned above.
Regarding traceability, the algorithm employs (3), in order to estimate object distance in time. Figure 13 shows results for 1 m/s speed and “Out” direction. Error increases with distance maybe due to difficult tag reading conditions for larger distances.

Estimated object distance in time.
5. Conclusions
The paper presented a novel multivariable algorithm for detection of mobile metal objects employing RFID. The algorithm uses a simple hardware setup consisting of one commercial portal reader coupled with a single element antenna. The configuration allows detecting and tracing an object, computing object speed, and determining one of two directions: In and Out.
Unlike other alternatives presented in the literature, the algorithm uses just three variables, namely, RSSI range defined as the difference between maximum and minimum RSSI values; percentage of RSSI changes, and percentage of variations in phase angles. The procedure compares these variables to specific thresholds. If two out of the three variables are above these values, a voting system decides the tag is moving. In this case, the algorithm also computes tag speed and direction. If more than one variable is below the threshold, the voting system identifies the tag as static.
The algorithm was tested in both indoor and outdoor scenarios, with one tag in a mobile metal object and 12 static interferer tags. All experiments used the maximum transmitter power of the RFID reader (30 dBm).
Results show the algorithm detected direction of movement and identified tags as “static” or “moving” with no errors for speeds smaller than or equal to 0.4 m/s. Detection errors (false negatives) increased with speedup to a maximum of 12% with a metal object moving at 1 m/s.
Regarding direction, the algorithm correctly identifies “In” and “Out” tags with all speeds. The process also computes speed values and object distance. All results show that error increases when speed increases. However, the maximum error value is 28%, found when computing speed. Additionally, results show no evidence of the hidden tag problem, since the target tag was detected all the time, despite the presence of interferer tags.
This work is, to the best of our knowledge, the first one to synergistically integrate in one algorithm the use of one simple setup and several low-level reader variables to increase the reliability of a decision system for warehouse inventories. This algorithm decides not only whether the tag is moving or not, but also in which direction it is moving and estimating its speed and relative position.
Future work should improve the speed estimation method, in order to decrease errors. Additional studies should include different moving directions (such as “Right” and “Left”) and different passive tags located over metal objects.
Footnotes
Conflict of Interests
There is no conflict of interests regarding the publication of this paper.
Acknowledgments
The authors thank the RFID Lab at Universidad del Norte for providing equipment and materials for this research. Also, the authors would like to acknowledge the support provided by Roberto Rossetti from Kereon RFID Solutions.