
Abstract
Abnormal events detection plays an important role in the video surveillance, which is a challenging subject in the intelligent detection. In this paper, based on a novel motion feature descriptor, that is, the histogram of maximal optical flow projection (HMOFP), we propose an algorithm to detect abnormal events in crowded scenes. Following the extraction of the HMOFP of the training frames, the one-class support vector machine (SVM) classification method is utilized to detect the abnormality of the testing frames. Compared with other methods based on the optical flow, experiments on several benchmark datasets show that our algorithm is effective with satisfying results.
1. Introduction
Nowadays, more and more surveillance cameras have been used in public places. Behavior analysis in crowded scenes [1–5] becomes more and more popular and important for public safety. In order to eliminate the world representation layer which can be a significant source of errors for algorithm modeling, an approach based on modeling directly at the pixel level was described in [6]. In [7, 8], social force model was used in abnormal crowd behavior detection. In [9, 10], a model named social attribute-aware force model was proposed. In this model, in order to improve the algorithm performance for the interaction behavior of the crowd, social characteristics of crowd behavior were taken into account.
In [11], SIFT features were extracted for the Bag of Words (Bow) model with Spatial Pyramid Matching Kernel (SPM). Then a SVM classifier was used for cross-scene abnormal events detection. In [12], based on the fact that the occurrence of abnormal events is rare while the frequently occurring events are normal in general human perception, proximity clustering for abnormal events detection in video sequence was proposed. In [13], when labeled information about normal events was limited and information about abnormal events was not available, projection subspace associated with detectors was discovered by using both labeled and unlabeled segments. In wireless sensor networks, a fact has been observed that instead of being transient, most abnormal events persist over a considerable period time. Thus, a technique for handling data in a segment-based manner was introduced in [14]. Without using any tracking and motion features, a feature extraction and events detection method were presented in [15], where features were extracted from foreground blobs and then confined in SVM based models for real-time events detection.
Unlike most existing approaches used for abnormal events detection, sparse representation based approaches attracted many researchers in the recent years. In [16], a method to detect abnormal events by a sparse subspace clustering was proposed. In [17, 18], a model based on the optical flow was described, which utilized the sparse reconstruction cost (SRC) over the normal dictionary to measure the normalness of the tested samples. As we know, optical flow is the approximated motion vector at each pixel location, which can reflect the relative distances of moving objects. Therefore, it is important and useful in video surveillance and abnormal events detection. Other methods based on the histogram of optical flow were described in [19–21]. Also, it was improved and used in this paper.
Although the above approaches could successfully realize abnormal events detection, they were limited in some aspects. Some models were established complicatedly and others cost a long time in the detection process. Based on these, we propose a novel detection model in crowded scenes, which is relatively simple and time-saving in calculation. Similar to the approach introduced in [21], our algorithm is mainly based on a proper processing method in the optical flow field.
The rest of the paper is organized as follows. In Section 2, we present how to acquire the motion features. In Section 3, the theory of one-class SVM is reviewed. In Section 4, the algorithm of abnormal events detection is introduced in detail. Section 5 presents our experiment results. Finally, some conclusions are presented in Section 6.
2. Motion Feature Extraction
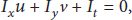
Optical flow field is the movement on the surface of grayscale images, which reflects the movement information of two consecutive frames. Optical flow provides the information of direction and amplitude of the moving object in a scene, which can describe the behavior of people very well. Optical flow is derived from the following basic equation:


In this paper, we propose a novel motion feature descriptor, called histogram of maximal optical flow projection (HMOFP). Figure 1 briefly shows the process for computing the HMOFP.

The process for computing the HMOFP feature.
As shown in Figure 2, the optical flow field of frame s is divided into m image patches with overlap areas. Each block contains

Block-division of the optical flow field belonging to the frame s.

(a) The calculation of HMOFP in each bin. (b) Components of the global feature descriptor of the frame s.
In order to describe a crowd scene well, sufficient crowd movement information is required. On the other hand, for distinguishing two different scenes, detailed comparisons of them are needed and useless information in these two scenes should be eliminated. In the classification process, overlapping block-division can increase the number of significant motion features in two different frames such that these two frames can be more distinguishable. Thus, it is adopted in our algorithm since the optical information can be utilized sufficiently. Moreover, to describe the motion of a crowd, we need two factors: explicit directions and the moving distance along each direction. The operation of segmenting the
3. One-Class SVM
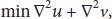
SVM was initiated by Vapnik and Lerner [23]. Since the kernel methods were introduced, SVM has been applied extensively in nonliner classification problems [24–26]. In one-class classification problem, the substance is that the boundary, that is, an appropriate region, needs to be determined in the data space
The correspondence between data space and feature space. (a) The boundary in the data space
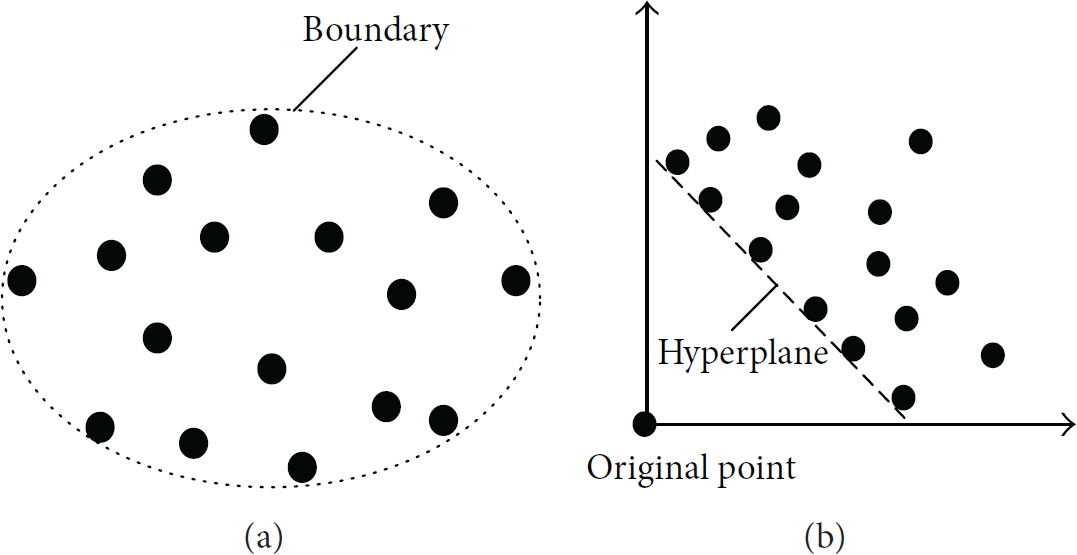
One-class SVM problem can be presented as an optimization model:

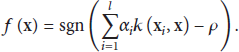

In our method, one-class SVM is utilized as follows. Firstly, the training set is used to establish a model. Then an appropriate boundary in the data space can be determined. The new incoming frames will be clustered by the following rule: if the HMOFP feature of the testing frame falls inside the boundary, it will be clustered as a normal frame. Otherwise, it is abnormal.
4. Abnormal Events Detection
In this section, an algorithm for abnormal events detection in surveillance video is described in detail. Suppose that for a given scene, there is a set of training frames
Step 1.
Calculate the optical flow, that is,

Step 2.
Extract the motion features of the first

Step 3.
Based on HMOFP, one-class SVM is utilized to calculate the optimal boundary of the set
Step 4.
Detect HMOFP of the testing frames based on the model trained by the motion feature of the first
The whole procedure is illustrated in Figure 5.
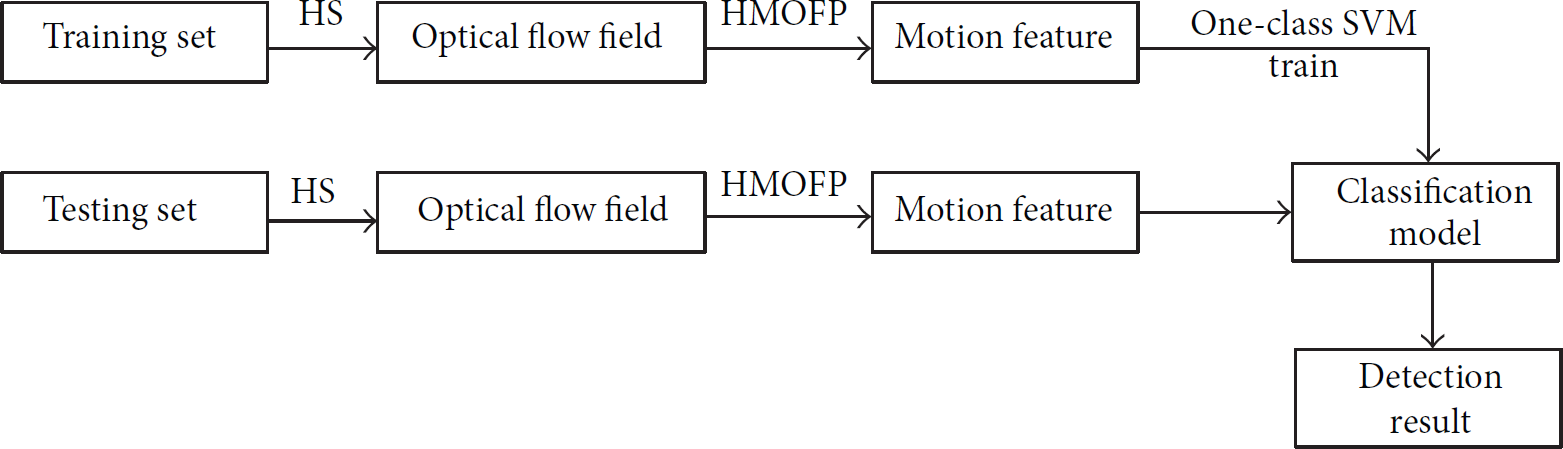
The flowchart of the proposed abnormal events detection algorithm.
5. Experimental Results
In this section, based on the UMN dataset [29] and PETS2009 dataset [30], we evaluate our method for abnormal event detection. Image patch size is set as
5.1. Experiments on the UMN Dataset
There are three different crowded scenes in the UMN dataset, which are named lawn, indoor, and plaza, respectively. In our experiments, we select a part of the normal frames of each scene as the training set and take the rest of the video sequence as the testing set.
5.1.1. Detection in the Lawn Scene
The video sequence of the lawn scene contains 1453 frames in total. The first 480 frames are taken as the training set. As shown in Figure 6, in the lawn scene, the normal event is that individuals walk in different directions. The abnormal event is that individuals suddenly run away. The detection results of the lawn scene are shown in Figure 7. The accuracy of the detection results is 95.5141%.

Two different scenes in the sequence of lawn.

Classification results of the lawn scene.
5.1.2. Detection in the Indoor Scene
The video sequence of the indoor scene contains 4144 frames in total. The first 319 frames are taken as the training set. As shown in Figure 8, in the indoor scene, the normal event is that some people are talking and standing in a relatively fixed location while some others are walking along the road in the hall. The abnormal event is that people run out of the doors suddenly. The detection results of the indoor scene are shown in Figure 9. The accuracy of the detection results is 91.2857%.
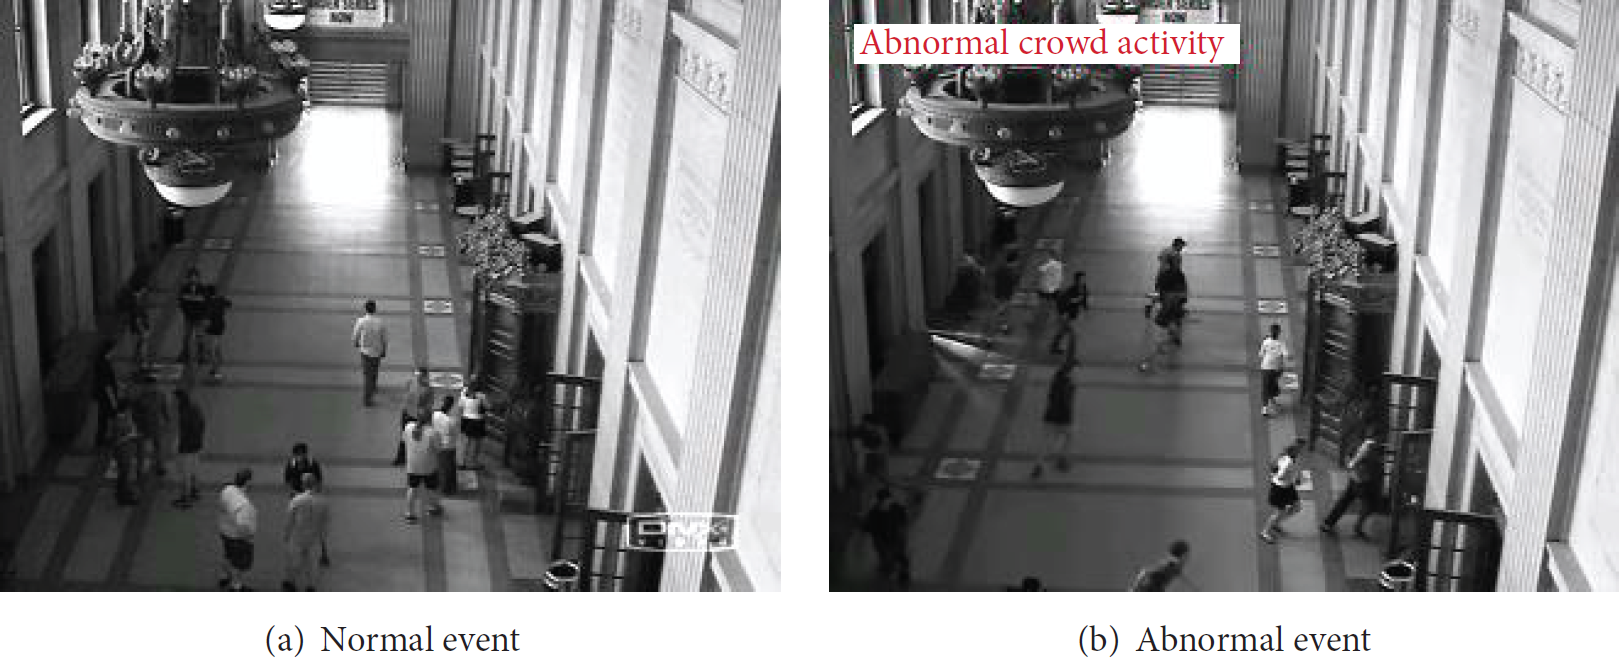
Two different scenes in the sequence of indoor.

Classification results of the indoor scene.
5.1.3. Detection in the Plaza Scene
The video sequence of the plaza scene contains 2412 frames in total. The first 550 frames are taken as the training set. As shown in Figure 10, in the plaza scene, the normal event is that people walk around the center of the square. The abnormal event is that people suddenly run away from the square. The detection results of the plaza scene are shown in Figure 11. The accuracy of the detection results is 94.3352%.
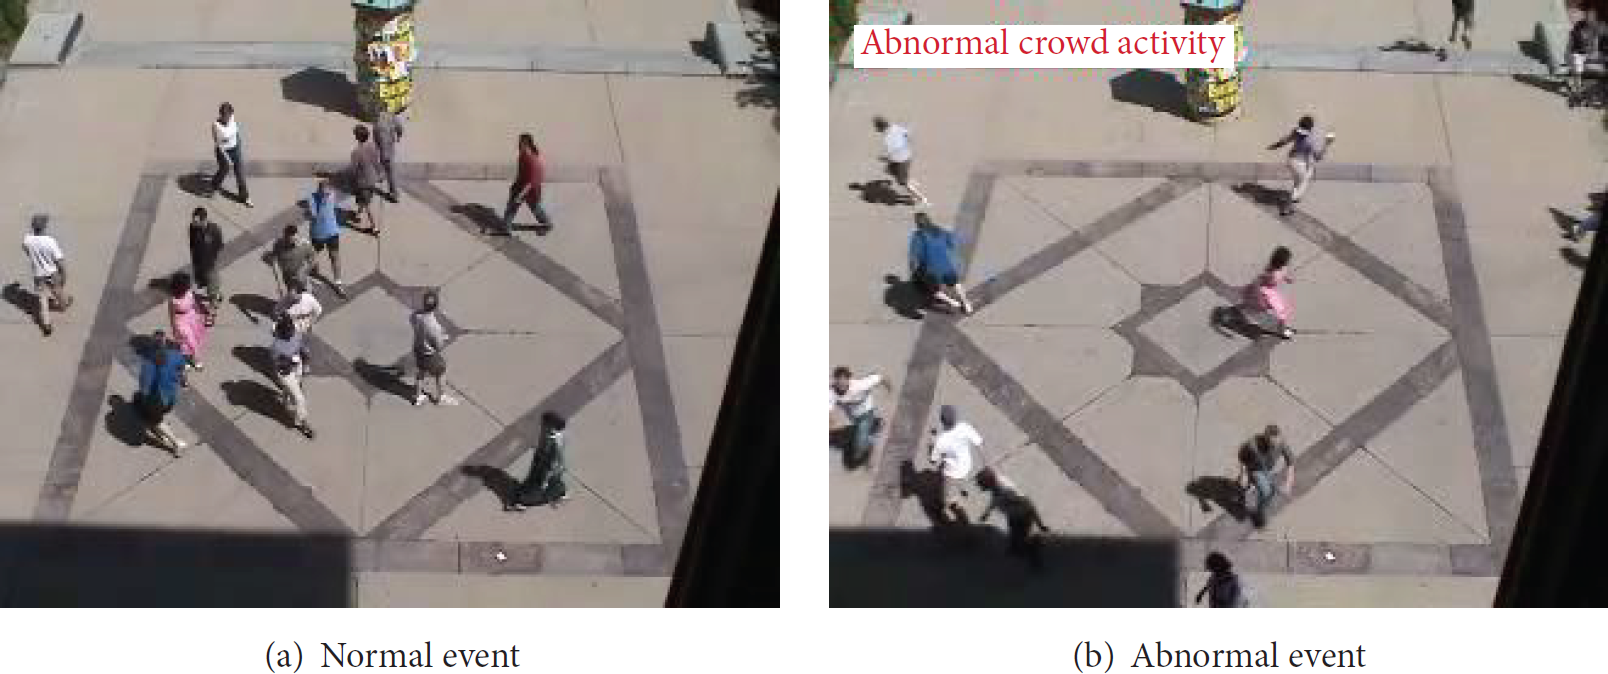
Two different scenes in the sequence of plaza.

Classification results of the plaza scene.
5.2. Experiments on the PETS2009 Dataset
In the following experiments, we can choose some specific scenes we are interested in as the targets in the detection progress. In the PETS2009 dataset, we firstly select the training set and the normal testing set, respectively, in the same scene. Then another video clip in a different scene is taken as the corresponding abnormal testing set. Our experiments and the detection results are shown as follows.
5.2.1. People Scatter Detection
In this part, the training set is the video sequence Time 14-16 (Frame 0 to Frame 222), where people are walking or running towards one direction. The normal testing set includes 41 frames (Frame 48 to Frame 88) of Time 14-17. 41 frames (Frame 337 to Frame 377) of Time 14-33 are labeled as abnormal for testing, in which people are scattered in all directions. The two different scenes are shown in Figure 12. The accuracy of the detection results is 97.5%, as shown in Figure 13.

Two different scenes in the same location.

The detection results of the sequence Time 14-33. “1” means normal and “−1” means abnormal.
5.2.2. Crowd Movement Direction Detection
In this part, the training set is the video sequence Time 14-55 (Frame 0 to Frame 399), where people are walking towards all directions. The normal testing set includes 89 frames (Frame 400 to Frame 488) of Time 14-55. 89 frames (Frame 0 to Frame 88) of the video sequence Time 14-17 are labeled as abnormal for testing, in which people are walking towards one direction. The two different scenes are shown in Figure 14. The accuracy of the detection results is 92.6136%, as shown in Figure 15.

Two different scenes in the same location.
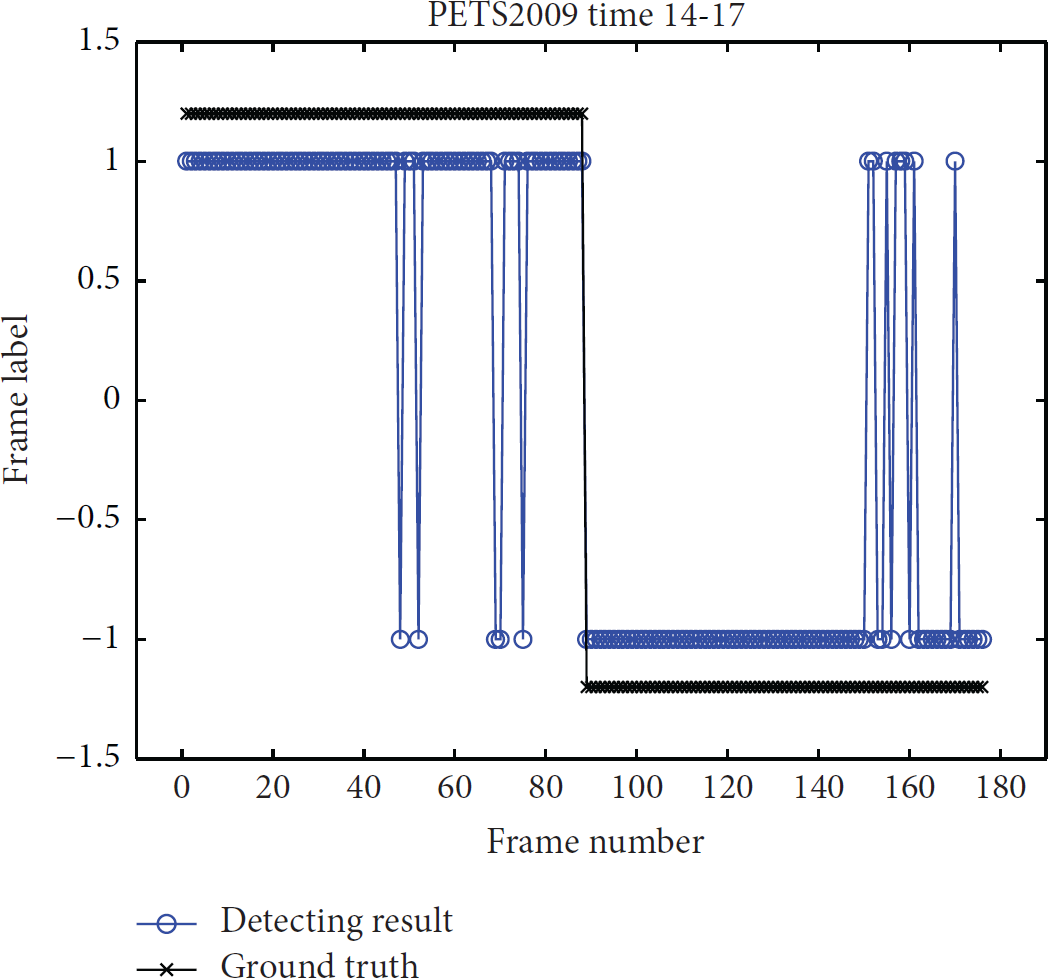
The detection results of the sequence Time 14-17. “1” means normal and “−1” means abnormal.
5.2.3. People Running Detection
In this part, the training set contains 50 frames (Frame 0 to Frame 49) of the video sequence Time 14-31 and 61 frames (Frame 0 to Frame 60) of the video sequence Time 14-17, where people are walking from right to left and from left to right, respectively. The normal testing set includes 104 frames (Frame 0 to Frame 37 and Frame 108 to Frame 173) of Time 14-16. 119 frames (Frame 38 to Frame 107 and Frame 174 to Frame 222) of Time 14-16 are labeled as abnormal for testing, in which people are running towards one direction. The two different scenes are shown in Figure 16. The accuracy of the detection results is 93.6937%, as shown in Figure 17.

Two different scenes in the same location.
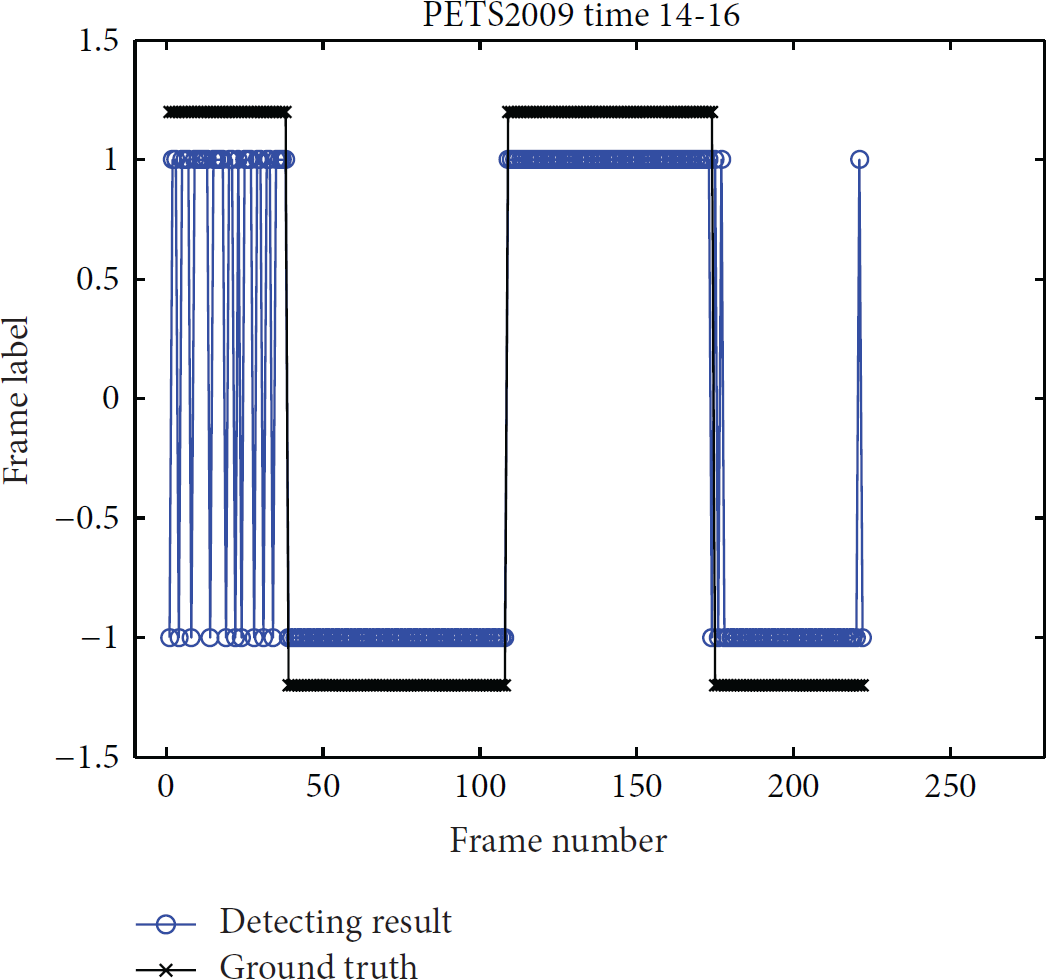
The detection results of the sequence Time 14-16. “1” means normal and “−1” means abnormal.
5.2.4. People Splitting Detection
In this part, the training set contains Frames 0 to 40 of the video sequence Time 14-16, where people are walking towards the same direction. The normal testing set includes 64 frames (Frame 0 to Frame 63) of Time 14-31. 66 frames (Frame 64 to Frame 129) of the video sequence Time 14-31 are labeled as abnormal for testing, in which the crowd is splitting. The normal scene and abnormal scene are shown in Figure 18. The accuracy of the detection results is 96.1538%, as shown in Figure 19.

Two different scenes in the same location.

The detection results of the sequence Time 14-31. “1” means normal and “−1” means abnormal.
5.2.5. Comparison
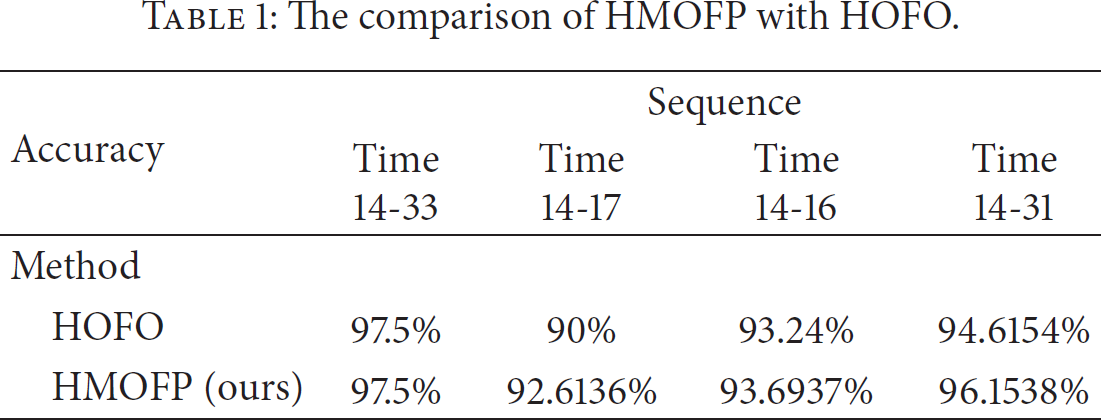
We compared our algorithm with the histogram of optical flow orientation (HOFO) method proposed in [21], as shown in Table 1. Most results of our algorithm are better than those of HOFO.
The comparison of HMOFP with HOFO.
6. Conclusion
In this paper, we proposed an algorithm for abnormal events detection in crowded scenes with global-frame scale. Our method contains two main procedures: first is computing the histogram of maximal optical flow projection (HMOFP) descriptor of the input video sequence. Second, one-class SVM classifier is utilized for nonlinear classification of the testing sets. The proposed method has been tested on several surveillance video datasets with good detection accuracy.
Footnotes
Conflict of Interests
The authors declare that there is no conflict of interests regarding the publication of this paper.
Acknowledgments
This work is supported by the NSFC (nos. 61273274, 61370127, 61572067, and 61272028), 973 Program (no. 2011CB302203), National Key Technology R&D Program of China (nos. 2012BAH01F03, NSFB4123104, FRFCU 2014JBZ004, and Z131110001913143), and Tsinghua-Tencent Joint Lab. for IIT.